BTC - Top-Down Analysis 📹 from Weekly to H4Hello TradingView Family / Fellow Traders. This is Richard, also known as theSignalyst.
📈 Here is a detailed update top-down analysis for #BTC.
Which scenario do you think is more likely to happen? and Why?
📚Always follow your trading plan regarding entry, risk management, and trade management.
Good Luck!.
All Strategies Are Good; If Managed Properly!
~Rich
TECH

NIO - Massive long at what could be the absolute bottom. I posted this a week ago but not much has changed. It was taken down by moderators because I mentioned something that went against house rules. Nonetheless:
ORIGINAL POST:
Nio has double bottomed on the weekly at local level with bullish divergence on the MaCD. It is also showing a clear shift in momentum on the 4H and Daily timeframes. We took this position a few days ago, and have already taken very small profits at the first tp level. I was unable to post here as my account has been hacked for the past 3 weeks and I have only just gotten it back, hence the lack of updates overall. Having said that the community took this trade.
I am posting this now as I believe that if we get above 8.36 then one could strategise a trade on a backtest of that level, so you guys could enter there if you haven't already.
The weekly is posted below

MSFT EARNINGS CHART - PRICE TARGETS AND TRENDSMSFT
Trying to get multiple charts done so description will be short.
Sorry to those asking about my website. Work in progress, and progress was slowed due to migraines.
Basically, Short term shows a drop, mid term shows a pump, and long term shows a drop.
With this in mind, it sets up strategy to keep risk to a minimum during earnings.
IF MSFT is pushing 336-342 around close. Look to see a final pump to maybe 348-354, with some fast retracements in the AH.
IF MSFT is around 326-327 around 10am-11am, I would look to buy call options, and I would sell those call options before close.
Personally, I see the same indicators setup on almost all the technology stocks, THEY ALL show a small pump to the topside, with a near 20% retracement.

NAS100 H4 | Approaching 38.2% Fibo supportNAS100 could fall towards an overlap support and potentially bounce off this level to rise towards our take-profit target.
Entry: 16,663.60
Why we like it:
There is an overlap support that aligns close to the 38.2% Fibonacci level
Stop Loss: 16,517.35
Why we like it:
There is a pullback support that aligns close to the 50.0% Fibonacci retracement level
Take Profit: 16,995.45
Why we like it:
There is a swing-high resistance level
Please be advised that the information presented on TradingView is provided to Vantage (‘Vantage Global Limited’, ‘we’) by a third-party provider (‘Everest Fortune Group’). Please be reminded that you are solely responsible for the trading decisions on your account. There is a very high degree of risk involved in trading. Any information and/or content is intended entirely for research, educational and informational purposes only and does not constitute investment or consultation advice or investment strategy. The information is not tailored to the investment needs of any specific person and therefore does not involve a consideration of any of the investment objectives, financial situation or needs of any viewer that may receive it. Kindly also note that past performance is not a reliable indicator of future results. Actual results may differ materially from those anticipated in forward-looking or past performance statements. We assume no liability as to the accuracy or completeness of any of the information and/or content provided herein and the Company cannot be held responsible for any omission, mistake nor for any loss or damage including without limitation to any loss of profit which may arise from reliance on any information supplied by Everest Fortune Group.

COINBASE #COIN suggests a cooling off period may occurCOIN is already quite significantly off it's highs
after NEARLY reaching a major Linear inverse Head and shoulders
we now have a lower timeframe Head and shoulders top that has nearly triggered
a warning sign that the crypto market needs a breather.
The target projects down to the initial neckline of the larger pattern.
Wow big moves!

EURGBP: Long Trade Explained
EURGBP
- Classic bullish formation
- Our team expects pullback
SUGGESTED TRADE:
Swing Trade
Long EURGBP
Entry - 0.8604
Sl - 0.8591
Tp - 0.8653
Our Risk - 1%
Start protection of your profits from lower levels
❤️ Please, support our work with like & comment! ❤️

PayPal Holdings, Inc.💰Daily log chart.
Uptrend with short-term acceleration, in the second channel.
The question, will prices exit the medium-term channel, from above?
Price above the 200-day moving average.
Make up your mind.

Tesla (TSLA) 🚗Daily chart with ichimoku.
The trend is downward, we must pay attention to the twist of the ichimoku cloud which is upon us!
MACD cross down, RSI at 44.04.
Caution is advised on the title.
Make up your mind.

XRP Analysis and Trading Plan for 2024 📊Hello TradingView Family / Fellow Traders,
On Daily: Left Chart
XRP has been hovering inside a significant range between 0.55 and 0.75, and it is currently retesting the lower bound of the range.
Moreover, it is approaching the lower red trendline of the channel that XRP has been respecting for a couple of weeks now.
🏹 Hence, XRP is situated around a strong area to look for buy setups as it is the intersection of the blue support and the lower red trendline.
Thus, we will be looking for buy setups on lower timeframes as long as the 0.54 support holds.
On H4: Right Chart
📈 For the bulls to take over in the short term, we need a momentum candle close above the last minor high in green at 0.592.
And then, for the bulls to remain in control from a medium-term perspective, we need a break above the last major high in red around 0.66.
📉 Meanwhile, until the bulls take over, XRP would be bearish, and if the 0.54 support is broken downward, we can expect a bearish continuation towards the 0.45 - 0.5 weekly support zone.
📚 Always follow your trading plan regarding entry, risk management, and trade management.
Good luck!
All Strategies Are Good; If Managed Properly!
~Richard Nasr

Magnificent seven 🚀Monthly chart: magnificent seven
Impressive increase, with a performance of 125.48%
The year was rich for the American technology sector.
Good year ! 🚀

c3.AI #AI Cup and handle, indicates the mania is still to come!And doesn't it have the best ticket to capitalise on the AI investment blowoff top mania phase.
We have seen it so many times now.
The chart pattern is still forming off course.
It gives you a roadmap, doesn't it.

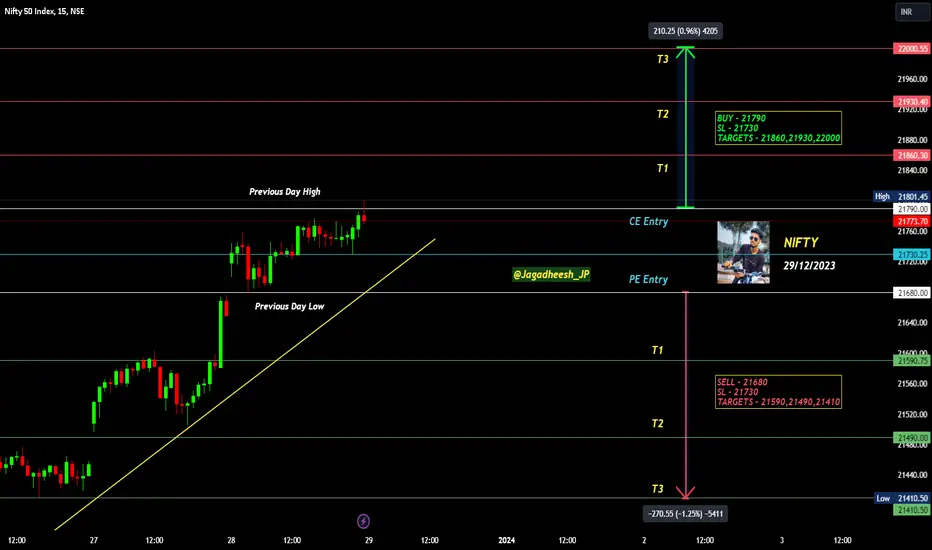
NIFTY INTRADAY LEVELS FOR 29/12/2023BUY ABOVE - 21790
SL - 21730
TARGETS - 21860,21930,22000
SELL BELOW - 21680
SL - 21730
TARGETS - 21590,21490,21410
NO TRADE ZONE - 21680 to 21790
Previous Day High - 21790
Previous Day Low - 21680
I am sharing NIFTY levels this levels acts as important support & resistance for intraday. if you want to trade with this levels wait for 15 min Candle closing above that levels. You can trade with breakout and reversal both.
In this channel, I share my expertise in trading strategies, technical analysis, and market trends to help you make informed decisions in your trading ventures.
Stay tuned for daily updates, in-depth market analyses, and real-time trading scenarios to witness firsthand how we transform from Zero to Hero in the trading world. My Only aim is to empower you with the knowledge and skills necessary to navigate the complexities of the financial markets successfully.
Based on price action major support & resistance's are here, the red lines acts as resistances, the green lines acts as supports. If the price breaks the support/resistance, it will move to the next support/resistance line. White lines indicates previous day high & low, high acts as a resistance & low acts as a support for next day.
Please NOTE: this levels are for intraday trading only.
Disclaimer - All information on this page is for educational purposes only,
we are not SEBI Registered, Please consult a SEBI registered financial advisor for your financial matters before investing And taking any decision. We are not responsible for any profit/loss you made.
Request your support and engagement by liking and commenting & follow to provide encouragement
HAPPY TRADING 👍
BTC - Top-Down Analysis 📹 2023 =>2024 Hello TradingView Family / Fellow Traders. This is Richard, also known as theSignalyst.
📈 Here is a detailed update top-down analysis for #BTC.
Which scenario do you think is more likely to happen? and Why?
📚 Always follow your trading plan regarding entry, risk management, and trade management.
Good Luck!.
All Strategies Are Good; If Managed Properly!
~Rich

ETH - A Major High To Be Broken in 2024Hello TradingView Family / Fellow Traders,
ETH has been hovering within a range for a couple of weeks, now fluctuating between 2120.0 and 2320.0.
📈 For the bulls to remain in control and take over from a medium-term perspective again, we need an H4 candle close above the range, at 2320.0
In this case, a movement to the 2,500 round number and upper red trendline would be expected.
📉 Meanwhile , ETH would be stuck inside a range, but the bulls will remain in control as long as the 2,100 level holds.
📚 Always follow your trading plan regarding entry, risk management, and trade management.
Good luck!
All Strategies Are Good; If Managed Properly!
~Richard Nasr

QQQ rejected off top of 2009-2023 channelBlue channel represents the primary trading channel since the 2009 crash. Only during the Covid bubble was QQQ able to escape that channel (ended up doubling it). Price can still work its way up along this resistance line, such as 2014 and 2018, but both of those times the stock market averaged out to be pretty flat over about a year time frame.
Here it is on the 1W

TESLA Do or Die moment to break the 2021 Resistance.Tesla (TSLA) is extending the rally following the buy signal (see chart below) we gave on November 07 at the bottom of the 1 year Channel Up:
The price has had 6 green candles out of a total of 7 and looks to repeat the Bullish Legs of April - July and January - February. What's more important than that, is that Tesla is approaching its 'Do or Die' moment as for the 5th time in 2 years (since November 2021), it is about to test the Lower Highs trend-line of the All Time High (ATH).
This huge Resistance level has rejected the price 4 times already, always initiating strong sell-offs. The 1W RSI has already broken above its own Lower Highs trend-line of July, so this could be an early signal of strength accumulation.
If we get a 1W candle close above the Lower Highs, we expect the final phase of the Bullish Leg to materialize and that would have practically confirmed that Tesla finally officially entered into a new Cycle of long-term growth. The target remains $345.00, representing a +75% rise from the recent Channel Low (-20% from the previous Leg).
-------------------------------------------------------------------------------
** Please LIKE 👍, FOLLOW ✅, SHARE 🙌 and COMMENT ✍ if you enjoy this idea! Also share your ideas and charts in the comments section below! This is best way to keep it relevant, support us, keep the content here free and allow the idea to reach as many people as possible. **
-------------------------------------------------------------------------------
💸💸💸💸💸💸
👇 👇 👇 👇 👇 👇

Marathon Digital #MARA Inverse Head and Shoulders. To over $100!Back in 21/22 Looking at the #Bitcoin miners helped me directionally to confirm the bear market.
Now in 2023 we have the flip flop
Miners exploded out of the bear market lows.
Check Back, with a healthy retracement. Putting in higher lows.
And now look ready to resume their climb higher.
#Marathon is a great example. A leading name and company within in this sector. And is showing a potential inverse head and shoulder's
The chart shows two targets Linear and Log.
Log target suggests a #Bitcoin price that will trade over $100k --- The promised land.
Will people's live actually be better with BTC @100K ???
Well, only if they are investing now... not buying above that magical mark obviously. :)

AI about to break upwards aggressively.AI (C3.ai) has made a Higher High yesterday, the highest level it's been since August 15. Having put both the 1D MA50 (blue trend-line) and the 1D MA200 (orange trend-line) behind, this rebound is taking place after a perfect bottom on the long-term Channel Up.
The first Bullish Leg of this pattern peaked on the 1.382 Fibonacci extension before a 1D MA200 pull-back. As a result, we are taking this early buy signal to target $60.00.
-------------------------------------------------------------------------------
** Please LIKE 👍, FOLLOW ✅, SHARE 🙌 and COMMENT ✍ if you enjoy this idea! Also share your ideas and charts in the comments section below! This is best way to keep it relevant, support us, keep the content here free and allow the idea to reach as many people as possible. **
-------------------------------------------------------------------------------
💸💸💸💸💸💸
👇 👇 👇 👇 👇 👇

CIBR: Cybersecurity Stocks Surge Into Year EndIt has been a record year... for cyber extortion. Orange Cyberdefense data, detailed in a Bloomberg article this week, reveal that there have been four straight quarters of increased corporate victims of hacks and financial blackmails. Major recent cyberattacks include those on MGM Grand, Clorox, Boeing, and China’s ICBC just this year alone. It is all good news for companies engaged in protecting against the increasing threat of large-scale ransomware attacks, among other tech-based crimes.
While shares of CrowdStrike and Palo Alto Networks have been strong lately, investors can play the trend at a higher level through the First Trust NASDAQ Cybersecurity ETF (CIBR). The $5.9 billion fund has a moderate 0.60% expense ratio, and it pays a modest 0.3% dividend yield. The issuer notes that the portfolio’s price-to-earnings ratio is lofty at 27.7x, but Morningstar reports that the ETF’s long-term earnings growth rate is respectable near 10%. To boot, you also get some semiconductor chip exposure, too.
For traders, CIBR’s momentum has been off the charts lately. Up seven weeks in a row, the basket of cybersecurity names has risen from the low $40s to the mid- FWB:50S as we head into 2024. A key thematic play, with fundamental strength (see CrowdStrike’s earnings late last month), I see the potential for CIBR to continue to rally, though shares have historically consolidated over the first 10 weeks of the year. As it stands, I see support between $47 and $48 with another layer of potential buying activity coming into play at $43. On the upside, keep your eye on the November 2021 all-time high just shy of $57.
The ETF successfully held its rising 200-day moving average earlier this quarter, and the breakout through $47 projects a measured move price objective to $58 based on the rounded bottom formation from Q2 this year to the December near-term breakout. With a daily RSI north of 86, we could see CIBR cool off, but the broader trend remains constructive in my view, and new all-time highs are certainly in play over the coming weeks.

Long $NIO and $BABABought Chinese tech stocks last week because they are cheap and appear to be at technical bottoms.

PALANTIR Buy opportunities within the Channel Up.Palantir (PLTR) is trading within a 16-month Channel Up and is right now below the 1D MA50 (blue trend-line) and above the Channel's median. Once the 1D RSI hits again the Support Zone, it will be a buy opportunity again (assuming it also hits the Channel's median). The previous Bullish Leg on the median rose by 58.85%. As a result our target will be $25.00.
This trade will be invalidated if the price breaks below the 1D MA200 (orange trend-line). In this case, we will wait until the stock approaches the bottom (Higher Lows trend-line) of the Channel Up again. The previous Bullish Leg on the Channel's bottom rose by +136.50%, which is marginally above the $25.00 target.
-------------------------------------------------------------------------------
** Please LIKE 👍, FOLLOW ✅, SHARE 🙌 and COMMENT ✍ if you enjoy this idea! Also share your ideas and charts in the comments section below! This is best way to keep it relevant, support us, keep the content here free and allow the idea to reach as many people as possible. **
-------------------------------------------------------------------------------
💸💸💸💸💸💸
👇 👇 👇 👇 👇 👇

Magnificent sevenDaily chart.
Comparison between Magnificent seven and S&P500.
Profit taking?
Make up your mind.

SNAP The best short on the market.Snap Inc (SNAP) has been on an incredible rise since practically October 26, which was straight after the bottom on the Higher Lows trend-line of the 1-year Bullish Megaphone pattern. Technically that is the pattern's 4th bullish leg towards its top (Higher Highs trend-line). The price is very close to that level, which is also where the 1W MA100 (red trend-line) is waiting.
That is a trend-line that has been untouched for almost two years (January 04 2022). Obviously it is a major Resistance and coupled with the fact that the 1D RSI, besides touching its Higher Highs trend-line, is on the highest overbought level in three years (Oct 23 2020), makes a case for one of the strongest sell stock picks in the market.
All of the Megaphone's Higher Highs rejections have pulled-back to at least the 0.5 Fibonacci retracement level before a bounce. As a result, as long as we close the 1W candles below the 1W MA100, we are shorting Snap, targeting 12.00 (slightly above the 0.5 Fib).
-------------------------------------------------------------------------------
** Please LIKE 👍, FOLLOW ✅, SHARE 🙌 and COMMENT ✍ if you enjoy this idea! Also share your ideas and charts in the comments section below! This is best way to keep it relevant, support us, keep the content here free and allow the idea to reach as many people as possible. **
-------------------------------------------------------------------------------
💸💸💸💸💸💸
👇 👇 👇 👇 👇 👇
