Is ASX 200 waiting for a catalyst?Looking at the technical picture of the MARKETSCOM:AUS200 Cash index, we can see that the price remains on an uptrend, while balancing above a medium-term tentative upside support line taken from the lowest point of August 2024. Despite seeing a relatively strong correction lower throughout the whole of December, the index remains resilient to downside pressure. That said, in the short-run, at the time of writing, MARKETSCOM:AUS200 is struggling to break above a key resistance area, around the 8370 barrier.
In order to shift our attention to some higher areas, a break above that key resistance area would be needed. That’s when we may see some more bulls entering the field. If such a move occurs, we might start aiming for the current highest zone, near the 8522 hurdle.
For the downside scenario, we will take a more conservative approach and wait for a break below the previously mentioned upside line. Additionally, a drop below the current lowest point of January, at around 8131 area may invite more bears into the market, potentially opening the door for a move towards the 200-day EMA and the psychological 8000 mark. If that hurdle is unable to withstand the pressure from the sellers, further declines might be possible.
RISK DISCLAIMER
74.2% of retail investor accounts lose money when trading CFDs with this provider. You should consider whether you understand how CFDs work and whether you can afford to take the high risk of losing your money. Past performance is not necessarily indicative of future results. The value of investments may fall as well as rise and the investor may not get back the amount initially invested. This content is not intended for nor applicable to residents of the UK. Cryptocurrency CFDs and spread bets are restricted in the UK for all retail clients.
Technical-analysis
BTCUSD | 1D SMC Short Setup with Refined SL and TargetsDescription:
This analysis identifies a high-probability short opportunity for BTCUSD on the 1D timeframe using the Smart Money Concepts (SMC) framework. The chart shows clear bearish confluences, including market structure, supply zones, liquidity levels, and Fibonacci retracement zones. I believe the current bullish momentum is merely a manipulation driven by inflation news and the upcoming Trump inauguration. Following these events, I anticipate a significant market correction. Here’s the detailed breakdown and trade plan:
Analysis:
Market Structure:
Break of Structure (BOS): Price has confirmed a bearish trend with BOS to the downside, signaling a continuation of lower highs and lower lows.
Trendline Resistance: A well-defined downward trendline indicates selling pressure, reinforcing the bearish bias.
Key Zones and Liquidity:
Supply Zone: Highlighted in purple at $102,000-$104,000 . This zone represents an area where strong selling previously occurred, creating an imbalance.
Golden Zone (Fibonacci Retracement): Located around $101,000-$103,000 , this area aligns with the 61.8%-78.6% retracement levels and offers a high-probability reversal opportunity.
Weak High: The high near $104,000 represents untapped liquidity, which smart money may target for a liquidity grab before reversing lower.
Equal Lows (EQL): Around $92,000 , these act as a bearish target where liquidity rests, aligning with the continuation of the bearish trend.
Confluences for Short Entry:
Price is approaching the supply zone and Fibonacci Golden Zone , indicating a potential reversal point.
The weak high may trigger a liquidity grab to entice buyers before sellers regain control.
Previous BOS and trendline resistance add further validation to the bearish bias.
Trade Plan:
Short Entry Setup:
Entry Zone: $102,000-$104,000 (inside the supply zone and Golden Zone).
Stop Loss (SL): $105,500 (above the supply zone and imbalance to account for liquidity grabs).
Take Profit Levels:
TP1: $97,000 – Close partial profits at this imbalance mitigation level.
TP2: $92,000 – Target the equal lows and resting liquidity.
TP3: $88,000 – Final target near the blue demand zone for maximum reward.
Risk-Reward Ratio:
With the entry at $103,000 (midpoint of supply), SL at $105,500, and TP at $92,000, the trade offers a 1:4 RR or better, depending on execution and scaling.
Additional Notes:
Monitor the price action closely as BTC approaches the supply zone for confirmation, such as bearish candlestick patterns or lower timeframe CHoCH (Change of Character).
Scaling into the trade in smaller portions across the supply zone can improve overall entry precision.
Adjust stop loss or take profit levels as market conditions evolve
Can a breakthrough to the upside be maintained of S&P500?From the technical side, we are seeing a small push higher, breaking above a short-term downside line. Despite this being a somewhat positive occurrence, we would rather wait to see where we close at the end of Friday. For more information, please see the video.
MARKETSCOM:US500
RISK DISCLAIMER
74.2% of retail investor accounts lose money when trading CFDs with this provider. You should consider whether you understand how CFDs work and whether you can afford to take the high risk of losing your money. Past performance is not necessarily indicative of future results. The value of investments may fall as well as rise and the investor may not get back the amount initially invested. This content is not intended for nor applicable to residents of the UK. Cryptocurrency CFDs and spread bets are restricted in the UK for all retail clients.
GOLD approaching key short-term resistance. What's next?Gold is moving in the upwards direction, despite the higher US CPI reading, which benefits the US dollar. However, there is a possibility that the higher inflation reading was already priced in and maybe this could lead to slower upside pace for the US dollar. Let's dig in...
TVC:GOLD TVC:DXY MARKETSCOM:GOLD MARKETSCOM:DOLLARINDEX
RISK DISCLAIMER
74.2% of retail investor accounts lose money when trading CFDs with this provider. You should consider whether you understand how CFDs work and whether you can afford to take the high risk of losing your money. Past performance is not necessarily indicative of future results. The value of investments may fall as well as rise and the investor may not get back the amount initially invested. This content is not intended for nor applicable to residents of the UK. Cryptocurrency CFDs and spread bets are restricted in the UK for all retail clients.
Tesla Inc. (NASDAQ: TSLA) Comprehensive AnalysisOverview
Tesla Inc. (NASDAQ: TSLA) has been a focal point of market activity, showcasing significant volatility and creating substantial opportunities for both short-term traders and long-term investors. The current price is $411.58, with the stock trading below its absolute high of $488.54 recorded on December 18, 2024. This represents a deviation of approximately -15.75% from the peak. This technical and fundamental analysis will leverage advanced tools, including VSA patterns, price action analysis, and volume dynamics, to project future movements.
Technical Analysis
Key Support and Resistance Levels
Support Levels: $383.30, $376.04, $358.62.
Resistance Levels: $420.00, $430.50, $448.00.
Moving Averages
MA50: $394.08
MA100: $397.55
MA200: $413.63
The price currently trades above the MA50 but below the MA200, suggesting consolidation within a broader bullish trend. The RSI (14) at 70.76 signals overbought conditions on shorter intervals, necessitating caution for immediate buy entrie.
Volume Spread Analysis (VSA) and Patterns
Recent trading data reveals patterns indicative of institutional activity:
Buy Volumes (Jan 13): Closing at $391.96 with increased buying pressure, marking a 14.61% movement from its three-bar low of $380.07.
VSA Manipulation Patterns: A confirmed "Buy Pattern 3" formed on January 13, showcasing a potential bullish continuation with a high of $396.95.
Predicted Scenarios
Short-Term (1 Week):
Tesla appears poised to test its $420 resistance level based on bullish volume patterns. A break above $420 with significant volume could target $430 as the next level of interest. However, failure to breach $420 may result in a retracement to $400-$405 support.
Medium-Term (1 Month):
Given the observed bullish manipulation patterns and technical support at $383, Tesla may aim for a recovery toward its MA200 at $413. If sustained buying interest persists, the stock might challenge its December highs.
Long-Term (3-6 Months):
Tesla’s trajectory could see it revisiting the $450-$470 range, contingent upon macroeconomic conditions and its quarterly earnings surpassing market expectations. The psychological level of $500 remains a potential long-term target if the broader market maintains bullish momentum.
Stop-Loss and Target Levels
Proposed Trade Setup:
Entry: $412.00
Stop-Loss: $400.00
Target 1: $420.00
Target 2: $435.00
Target 3: $450.00
Fundamental Analysis
Tesla remains a key player in the EV market, with growing adoption of its vehicles worldwide. Its latest production numbers exceeded market expectations, signaling robust demand despite economic headwinds. Recent initiatives in energy storage and AI-based technology further diversify its revenue streams, underpinning its premium valuation.
Conclusion
Tesla's technical and fundamental indicators suggest a cautiously bullish outlook. While short-term retracements are possible, the stock's overall trend aligns with upward momentum, supported by strong institutional interest and robust fundamentals.
For further inquiries or personalized trading setups, feel free to contact me directly. All relevant indicators and tools used for this analysis can be found in the profile header.
Concept of Rays
Explanation of the "Rays from the Beginning of Movement" Concept
Core Idea
My proprietary analysis method is based on using rays constructed on Fibonacci mathematical and geometric principles. These rays create a system of dynamic levels that help predict precise asset movements and identify key zones where price interactions occur. Price interaction with these rays signals probable scenarios: either a reversal or a continuation of movement, but only after interaction and the appearance of dynamic factors and patterns.
Why Predicting Specific Levels is Not Possible
Financial markets are nonlinear systems, where price movement is determined by numerous variables, including market volumes, liquidity, macroeconomic factors, and participant psychology. Instead of attempting to predict specific levels, I propose analyzing probabilities of price reaction at pre-calculated key zones. Price interaction with rays provides additional insights into the direction and strength of movement.
How Rays Work
Fibonacci Rays: Each ray corresponds to a specific angle of inclination, which is mathematically significant and correlates with natural proportions and the start of movement.
Primary Advantage: Rays are constructed from the beginning of a movement pattern, rather than traditional extremum points commonly used in classical technical analysis. This allows for the rapid and accurate accounting of new trend or corrective movement phases.
Adaptability: When a new pattern emerges, rays are automatically adjusted to show the potential movement range. Price may exit this range and enter another, interacting similarly with a different ray.
Rays are Ascending and Descending: They define the boundary of the movement channel.
How to Use Rays
Historical Analysis: On historical charts, observe how price interacted with rays. This helps evaluate how often levels defined by rays led to significant movement changes.
Real-Time Monitoring: By observing current price behavior relative to rays, you can highlight key points where scenarios such as reversal or continuation are likely.
Confirmation Tool: Rays do not replace other analysis methods but enhance them, adding a structured perspective on market behavior.
Scientific Basis
Fibonacci proportions, underlying the construction of rays, are observed in nature, physics, and financial markets, making them a universal tool.
Geometric angles and trends are based on mathematical analysis of historical price behavior.
The principle of minimizing subjectivity in analysis is also applied: rays are constructed strictly algorithmically, excluding human bias.
Why It Matters
My name is Denis Mikheev, and my method does not offer magical solutions or "predictions" of exact price movements. Instead, it identifies key interaction zones where market participants, as well as automated market-maker algorithms, are likely to make decisions. This allows you to act based on probabilities, not guesses.
Example Visualization
On a chart with rays already constructed, you can see:
How price reacts to intersections or proximity to rays.
Where current interaction points may signal potential changes in movement dynamics.
Trade Safe!
Denis MikheevTheWaved™ Team
BTC -USDT UPDATE on the 4th of JANUARY 2025 ! Trade closed with BTC -USDT UPDATE on the 4th of JANUARY 2025 ! Trade closed with a "healthy " profit...
"Inglorious" BTC again ! ;) Well Well Well.... Profit again ;)
Waiting for a new opportunities again...
I do hope you are in profit already... if not... You still got all year to do it ! ;)
PS: printer friendly "KISS" chart... & BTW...leverage *10 on Binance recommended... ;)
ATOM - USDT UPDATE for 4th of January... $ ---- 100%+ already...ATOM - USDT UPDATE on the 4th of January... What happened in the last 4 days ???
Well, account "went" double & plenty of room to go further....
I do hope you are all in the profit already... if not... blame yourselves only ! ;)
PS: printer friendly "KISS" chart
NVIDIA set to make one more higher high to $165?Technical Analysis:
================
A series of higher highs and higher lows in Weekly Timeframe:
NVIDIA has found support at $132, which previously acted as a resistance area during June, July, and August 24. If the stock continues to rise from this level, we could see another higher high (yellow cap) around $165. Alternatively, a deeper correction toward $104 could still be on the table if the support fails.
Fundamental Analysis:
==================
1) If NVIDIA struggles, it would suggest AI's momentum is waning—which is clearly not the case. This downtrend might simply reflect profit-taking by large traders.
2) The "Santa Rally" is in play, and NVIDIA appears to be on the "nice" list, signaling potential upward momentum.
3) NVIDIA's Blackwell product line is expected to contribute significantly to profits in the next quarterly earnings, potentially providing a substantial boost to the stock.
I bought NVIDIA stock at $145 and plan to hold sell at $160.
Quick technical idea on S&P 500The EASYMARKETS:SPIUSD has been on a roller coaster ride lately. But the main question is, will we see a new all-time high by the end of this year.
Disclaimer:
easyMarkets Account on TradingView allows you to combine easyMarkets industry leading conditions, regulated trading and tight fixed spreads with TradingView's powerful social network for traders, advanced charting and analytics. Access no slippage on limit orders, tight fixed spreads, negative balance protection, no hidden fees or commission, and seamless integration.
Any opinions, news, research, analyses, prices, other information, or links to third-party sites contained on this website are provided on an "as-is" basis, are intended only to be informative, is not an advice nor a recommendation, nor research, or a record of our trading prices, or an offer of, or solicitation for a transaction in any financial instrument and thus should not be treated as such. The information provided does not involve any specific investment objectives, financial situation and needs of any specific person who may receive it. Please be aware, that past performance is not a reliable indicator of future performance and/or results. Past Performance or Forward-looking scenarios based upon the reasonable beliefs of the third-party provider are not a guarantee of future performance. Actual results may differ materially from those anticipated in forward-looking or past performance statements. easyMarkets makes no representation or warranty and assumes no liability as to the accuracy or completeness of the information provided, nor any loss arising from any investment based on a recommendation, forecast or any information supplied by any third-party.
Quick technical idea on EURUSDWaiting for a breakout through one of my key areas to consider the next short-term directional move.
FX_IDC:EURUSD EASYMARKETS:EURUSD
Disclaimer:
easyMarkets Account on TradingView allows you to combine easyMarkets industry leading conditions, regulated trading and tight fixed spreads with TradingView's powerful social network for traders, advanced charting and analytics. Access no slippage on limit orders, tight fixed spreads, negative balance protection, no hidden fees or commission, and seamless integration.
Any opinions, news, research, analyses, prices, other information, or links to third-party sites contained on this website are provided on an "as-is" basis, are intended only to be informative, is not an advice nor a recommendation, nor research, or a record of our trading prices, or an offer of, or solicitation for a transaction in any financial instrument and thus should not be treated as such. The information provided does not involve any specific investment objectives, financial situation and needs of any specific person who may receive it. Please be aware, that past performance is not a reliable indicator of future performance and/or results. Past Performance or Forward-looking scenarios based upon the reasonable beliefs of the third-party provider are not a guarantee of future performance. Actual results may differ materially from those anticipated in forward-looking or past performance statements. easyMarkets makes no representation or warranty and assumes no liability as to the accuracy or completeness of the information provided, nor any loss arising from any investment based on a recommendation, forecast or any information supplied by any third-party.
NSTR - Technical Analysis of Key Bullish and Bearish LevelsKey Observations:
Expanded Volume Profile:
The volume profile on the left indicates significant trading activity (support/resistance zones).
The high-volume node around 360–380 suggests a key area of interest where the price might consolidate or face resistance/support.
Bullish Levels:
Bullish Week (376): A breakout above this level could trigger upward momentum toward 400 and potentially higher.
Close Week Swing (363): Currently being tested. Sustained strength above this level would be a sign of bullish continuation.
Key Target at 400: Bullish swing level acting as a psychological and technical resistance point.
Bearish Levels:
Bear Swing (348): A breakdown below this level could lead to further downside, with the next support at Bear Week (325).
Week ATR (328): If the price approaches this level, it signals a deeper bearish sentiment.
Price Action:
The yellow line shows a recovery attempt after a sharp drop. The price appears to be testing resistance at Close Week Swing (363).
The upward trend from lower levels near 325 suggests some buying interest at lower prices.
Annotations and Targets:
Close Week Swing (363) is pivotal; crossing this level with volume might lead to a test of higher resistance levels.
The area around 325–328 has shown strong support previously, and a retest might attract buyers.
Analysis:
Bullish Scenario:
The price needs to decisively close above 363 to gain bullish momentum. If this happens, look for targets at 376 and then 400.
Volume supporting an upward move would confirm bullish sentiment.
The Bullish Week (376) level is critical for mid-term trend confirmation.
Bearish Scenario:
Failure to hold above 363 could lead to a retest of 348 (Bear Swing) and possibly further downward moves toward 325–328.
Increased volume at lower levels might indicate bearish control.
Neutral Scenario:
Consolidation between 348 and 363 could signal indecision, with a breakout or breakdown likely depending on market sentiment.
Recommendations:
For Bullish Traders:
Look for strong volume above 363 and consider targets at 376 and 400.
Watch for consolidation near 360–363 as a possible entry point.
For Bearish Traders:
A rejection at 363 or a breakdown below 348 would signal opportunities to target 325–328.
Use volume and candlestick patterns to confirm breakdowns.
Risk Management:
Stops should be placed slightly beyond key levels (e.g., above 376 for shorts or below 348 for longs).
This setup emphasizes the importance of the 363 level as a tipping point for direction. Let me know if you'd like further insights!
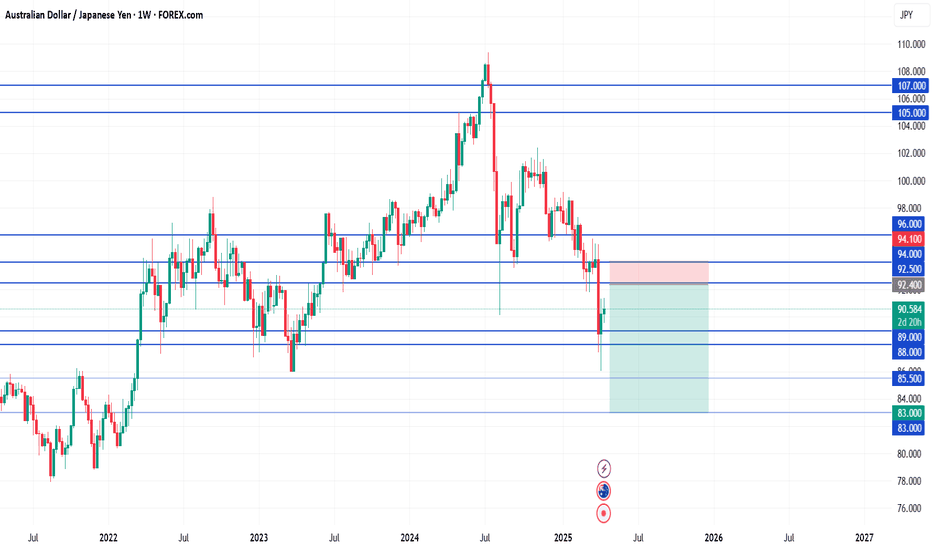
AUDJPY Analysis - BuyAUDJPY Analysis Overview
1. Seasonality:
AUD: Bearish until midweek — Seasonal weakness in AUD early in the week aligns with a short-term bearish sentiment.
JPY: Bullish — JPY strength throughout the week supports its safe-haven appeal.
---
2. COT Report (Commitment of Traders):
AUD:
4-week flip indicates a Sell bias.
Non-commercial short positions are increasing, signaling bearish sentiment for AUD.
JPY:
4-week flip indicates a Buy bias.
Non-commercial long positions are increasing, reinforcing bullish sentiment for JPY.
---
3. Fundamental Analysis:
LEI (Leading Economic Indicator):
AUD:Decreasing — Suggests deteriorating economic momentum, adding to bearish pressure.
JPY: Range — Neutral economic conditions but still supportive due to JPY's safe-haven status.
Endogenous Factors:
AUD: Mix to Decreasing — Weak internal factors limit AUD’s strength.
JPY: Increasing — Improving domestic conditions support JPY buying.
---
4. Exogenous Factors:
GBPJPY: Strong Sell — Broader risk-off sentiment in the market favors safe-haven currencies like JPY over risk-sensitive ones like AUD.
---
5. Technical Analysis:
On the 1-hour chart:
A Cup and Handle pattern and an ABCD pattern are forming, indicating bullish potential.
After point C, the price is making Higher Highs (HH) and Higher Lows (HL), suggesting a bullish continuation.
These bullish patterns present a good Buy Opportunity, especially as the price confirms its breakout above the handle.
---
Bias: Buy
Despite AUD's seasonal weakness early in the week, the technical setup on the 1-hour chart favors a bullish bias for AUDJPY. JPY's strength provides additional support for safe-haven flows, but the technical patterns indicate that AUDJPY has room to rally in the short term. Consider entering long positions upon confirmation of the breakout above the handle.
S&P 500 Technical Analysis Ascending Triangle vs Rising Wedge I've identified two potential patterns on the S&P 500 SP:SPX chart:
Ascending Triangle (blue trendlines): Higher lows and flat highs, with breakout potential above the flat top or a breakdown below the higher lows. Indicated by blue arrows.
Rising Wedge Developing (red trend lines and arrows): Higher highs and higher lows, with a potential bearish breakout below the lower trend line or a less common bullish breakout above the upper trend line. Red arrows highlight the touch points on the rising wedge pattern.
Pattern Rules:
For a valid pattern, the following rules apply:
Ascending Triangle:
At least two higher lows
Flat highs
Decreasing volume
Breakout above the flat top or breakdown below the higher lows
Rising Wedge:
At least three touch points on each trend line (I will use as few as 2)
Higher highs and higher lows
Decreasing volume
Breakout below the lower trend line or above the upper trend line (less common)
Quick Review for Beginners:
New to chart patterns? Here's a quick rundown:
Higher lows: A series of lows that are higher than the previous ones.
Flat highs: A series of highs that are roughly the same level.
Decreasing volume: The trading volume decreases as the pattern forms.
Breakout: When the price moves above or below the pattern's boundary.
Trend lines: Lines drawn to connect the highs or lows of a pattern.
Keep in mind that chart patterns are not a guarantee of future price movements, but rather a tool to help identify potential trends and trading opportunities.
Short-term EURUSD ideaAfter yesterday's better than expected flash PMIs from Germany, we saw EURUSD finding some buying interest. Let's see if we can get a larger correction to the upside.
EASYMARKETS:EURUSD
Disclaimer:
easyMarkets Account on TradingView allows you to combine easyMarkets industry leading conditions, regulated trading and tight fixed spreads with TradingView's powerful social network for traders, advanced charting and analytics. Access no slippage on limit orders, tight fixed spreads, negative balance protection, no hidden fees or commission, and seamless integration.
Any opinions, news, research, analyses, prices, other information, or links to third-party sites contained on this website are provided on an "as-is" basis, are intended only to be informative, is not an advice nor a recommendation, nor research, or a record of our trading prices, or an offer of, or solicitation for a transaction in any financial instrument and thus should not be treated as such. The information provided does not involve any specific investment objectives, financial situation and needs of any specific person who may receive it. Please be aware, that past performance is not a reliable indicator of future performance and/or results. Past Performance or Forward-looking scenarios based upon the reasonable beliefs of the third-party provider are not a guarantee of future performance. Actual results may differ materially from those anticipated in forward-looking or past performance statements. easyMarkets makes no representation or warranty and assumes no liability as to the accuracy or completeness of the information provided, nor any loss arising from any investment based on a recommendation, forecast or any information supplied by any third-party.
USD/JPY Forecast: Bullish Bias Expected – Key Factors to Watch.USD/JPY Forecast: Bullish Bias Expected – Key Factors to Watch (20/09/2024)
As we analyze the USD/JPY pair on 20/09/2024, the outlook appears to be slightly bullish for this week and next. Several key drivers are pushing the U.S. dollar higher against the Japanese yen, creating an attractive opportunity for traders. In this article, we’ll break down the fundamental factors behind this forecast and highlight the elements influencing USD/JPY price action in the coming days.
1. US Dollar Strength Bolsters USD/JPY
The strength of the U.S. dollar is a critical factor contributing to the bullish bias in USD/JPY. With the Federal Reserve signaling a commitment to maintaining high interest rates for an extended period, the greenback remains in demand. Fed officials have recently emphasized their concerns about persistent inflation, leading markets to believe that U.S. interest rates will stay elevated for longer than previously expected.
This hawkish monetary stance, coupled with strong economic data, has made the U.S. dollar more attractive to investors. As a result, USD/JPY has been moving higher, with the strong dollar likely to continue exerting upward pressure on the pair.
Key SEO keywords: USD/JPY forecast, US dollar strength, Federal Reserve policy, interest rate hike, USD/JPY price action.
2. Dovish Bank of Japan Keeps the Yen Weak
On the other side of the equation, the Japanese yen remains under pressure due to the Bank of Japan’s (BoJ) ultra-loose monetary policy. The BoJ has shown no signs of tightening monetary policy in the near term, despite global inflationary trends. Japan’s central bank continues to prioritize economic support, maintaining low interest rates while avoiding any drastic policy shifts.
This dovish stance contrasts sharply with the Federal Reserve’s hawkish policy, widening the interest rate differential between the U.S. and Japan. This is a major driver of USD/JPY’s bullish outlook, as investors gravitate towards the higher-yielding U.S. dollar over the lower-yielding yen.
Key SEO keywords: Bank of Japan policy, Japanese yen weakness, dovish BoJ, USD/JPY interest rate differential, yen depreciation.
3. Interest Rate Differentials Favor USD/JPY Upside
One of the most important factors pushing USD/JPY higher is the widening interest rate differential between the U.S. and Japan. While U.S. Treasury yields remain attractive, the yield on Japanese government bonds remains low due to the BoJ’s dovish policy stance. This gap in yields makes the U.S. dollar more appealing for investors seeking better returns.
The widening interest rate gap is a key bullish signal for USD/JPY, as capital continues to flow into U.S. dollar-denominated assets. As long as the Federal Reserve maintains its hawkish tone, and the BoJ remains accommodative, this dynamic will likely support the bullish bias for USD/JPY.
Key SEO keywords: Interest rate differentials, U.S. Treasury yields, Japanese bond yields, USD/JPY bullish outlook, capital flows into USD.
4. Japanese Economic Weakness Adding Pressure on the Yen
Another factor supporting the bullish bias for USD/JPY is the ongoing weakness in the Japanese economy. Japan has struggled with slow economic growth and weak inflation, further justifying the BoJ’s cautious approach to monetary policy. Domestic consumption remains low, and Japan’s economic recovery has been uneven.
As a result, the Japanese yen continues to face downside pressure, while the U.S. dollar benefits from stronger economic fundamentals. This divergence between the U.S. and Japanese economies adds to the case for a stronger USD/JPY in the coming weeks.
Key SEO keywords: Japanese economic weakness, low inflation in Japan, weak yen, Bank of Japan policy, USD/JPY forecast.
5. USD/JPY Technical Analysis Suggests Further Upside Potential
From a technical standpoint, USD/JPY is showing signs of further upside. The pair has been testing key resistance levels, and if these levels are broken, we could see a more significant bullish move. The recent price action has shown strength, with USD/JPY consistently finding support at higher lows.
Traders should watch for a potential breakout above these resistance zones, as it could signal further gains for USD/JPY. With strong fundamentals supporting the pair, the technical outlook aligns with the overall bullish bias.
Key SEO keywords: USD/JPY technical analysis, key resistance levels, USD/JPY price action, bullish trend, support and resistance.
Conclusion: Bullish Bias Expected for USD/JPY
In conclusion, several fundamental and technical factors support a slightly bullish bias for USD/JPY over the next couple of weeks. The ongoing strength of the U.S. dollar, the dovish stance of the Bank of Japan, favorable interest rate differentials, and Japan’s economic challenges all point towards further upside potential for USD/JPY.
Traders and investors should closely monitor these key drivers as they make their trading decisions. As always, staying updated on central bank policies, economic data, and technical signals will be crucial in navigating the USD/JPY price action during this period.
Key SEO keywords: USD/JPY forecast, bullish bias, USD/JPY key drivers, US dollar strength, Bank of Japan policy, interest rate differential, USD/JPY technical analysis.
USDJPY: Slight Bullish Bias This Week? (19/09/2024)As of September 19, 2024, traders are closely monitoring the USDJPY pair for potential bullish momentum. Several fundamental factors and market conditions indicate that the pair might see a slight upward bias this week. Let’s dive into the key drivers affecting the USDJPY price action.
1. Diverging Central Bank Policies
One of the primary influences on USDJPY is the monetary policy divergence between the Federal Reserve (Fed) and the Bank of Japan (BoJ).
- Federal Reserve’s Stance: As we move into the week, the market expects the Fed to maintain a hawkish stance or at least keep interest rates elevated. Although there’s some speculation about a possible pause in future rate hikes, the Fed's priority remains controlling inflation. This higher interest rate environment in the US makes the US dollar more attractive, pushing USDJPY upwards.
- Bank of Japan’s Ultra-Loose Policy: In contrast, the BoJ continues its ultra-loose monetary policy, aiming to stimulate Japan’s sluggish economy. Despite rising inflation in Japan, the BoJ has shown little inclination to raise rates aggressively. This Interest rate differential between the US and Japan tends to weaken the yen, giving a bullish outlook for USDJPY.
2. Risk Sentiment in Global Markets
Risk sentiment plays a crucial role in the movement of USDJPY. When global markets are in a risk-off mode, investors tend to flock to safe-haven assets like the Japanese yen, strengthening it. However, recent global economic data and financial news have maintained a somewhat stable risk appetite, leaning towards a risk-on environment.
- US Economic Data: Recent reports from the US, such as better-than-expected retail sales and strong labor market data, continue to support the narrative of economic resilience. This fuels demand for the dollar and supports USDJPY’s bullish momentum.
- Global Geopolitical Risks: While geopolitical tensions in regions like Europe and the Middle East may inject some volatility, there hasn’t been a major shift toward a risk-off sentiment that would heavily favor the yen. For now, dollar strength seems to dominate.
3. Japanese Economic Conditions
Japan’s economy continues to struggle with low growth despite rising inflation. The BoJ’s consistent approach to stimulus, combined with the government's push for wage growth, has not yet translated into significant yen strength. Additionally, trade deficits in Japan, exacerbated by higher import costs, have weighed on the yen’s valuation.
Without a major shift in BoJ policy or a significant improvement in Japan's economic performance, the yen will likely remain under pressure, keeping USDJPY on a slightly bullish path.
4. US Bond Yields
US Treasury yields are another major factor driving the USDJPY. Higher US bond yields, often seen in response to tighter monetary policy and strong economic data, make the dollar more attractive to foreign investors. The upward trajectory of bond yields has been a persistent theme, reinforcing dollar strength. If this trend continues through the week, we can expect additional support for USDJPY.
5. Technical Indicators
Looking at the technical analysis for USDJPY, the pair has been trading near key resistance levels in recent sessions. If the pair breaks above these resistance zones, we could see further bullish momentum.
- Key Support and Resistance Levels: The 145.00 level has been a psychological support level for USDJPY, while 148.50 serves as resistance. Should the pair break beyond this resistance, it could trigger more buying pressure, pushing USDJPY higher.
Conclusion: USDJPY’s Slight Bullish Bias
In conclusion, the USDJPY pair is expected to exhibit a slight bullish bias this week, primarily driven by:
- Monetary policy divergence between the Fed and BoJ.
- Favorable US economic data and rising Treasury yields.
- Limited economic growth in Japan, with persistent trade deficits.
- Stable global risk sentiment supporting the dollar over the yen.
Traders should keep an eye on US bond yields, Fed comments, and any sudden shifts in risk sentiment or geopolitical events, as these could influence USDJPY’s trajectory throughout the week.
---
Keywords:
- USDJPY forecast
- USDJPY bullish bias
- USDJPY analysis September 2024
- USDJPY technical analysis
- USDJPY key drivers
- USDJPY trading strategy
- USDJPY and Federal Reserve policy
- USDJPY support and resistance levels
- USDJPY risk sentiment
- USDJPY bond yields impact
EUR/USD to tag 1.11 before its next leg lower?It is good to finally see the USD strength we were calling for finally come into play. It may have a little further to run, which could see further downside on the weekly chart for EUR/USD. But first, we look at a potential long on the daily and 4-hour chart, taking the weekly analysis into account.
GBPUSD: Sell any retracements towards 1.3145-65 for 1.3080-90GBPUSD is in a downtrend in the short term with Weekly, Daily and 4H charts technical picture favoring the continuation of the move lower.
Strategy:
SELL at current levels and at any advance towards 1.3145-60
STOP LOSS above 1.3205
TP: 1.3085 or 1.3055-60
MULTITIME FRAME TECHNICAL PICTURE AND ANALYSIS
Weekly: Reversal Weekly Bar at double channel top
Daily: Reversal Patterns and RSI Double top
4H: H&S pattern pointing lower