AUDJPY, our risk on/off monitor, is near a key resistance areaAUDJPY has been on a good run lately. The driving force behind it was the improved market sentiment due to the calming moment in the tariff wars. Can this be sustained?
Let's look at the technical picture of AUDJPY.
Let us know what you think in the comments below.
Thank you.
77.3% of retail investor accounts lose money when trading CFDs with this provider. You should consider whether you understand how CFDs work and whether you can afford to take the high risk of losing your money. Past performance is not necessarily indicative of future results. The value of investments may fall as well as rise and the investor may not get back the amount initially invested. This content is not intended for nor applicable to residents of the UK. Cryptocurrency CFDs and spread bets are restricted in the UK for all retail clients.
Technical-analysis

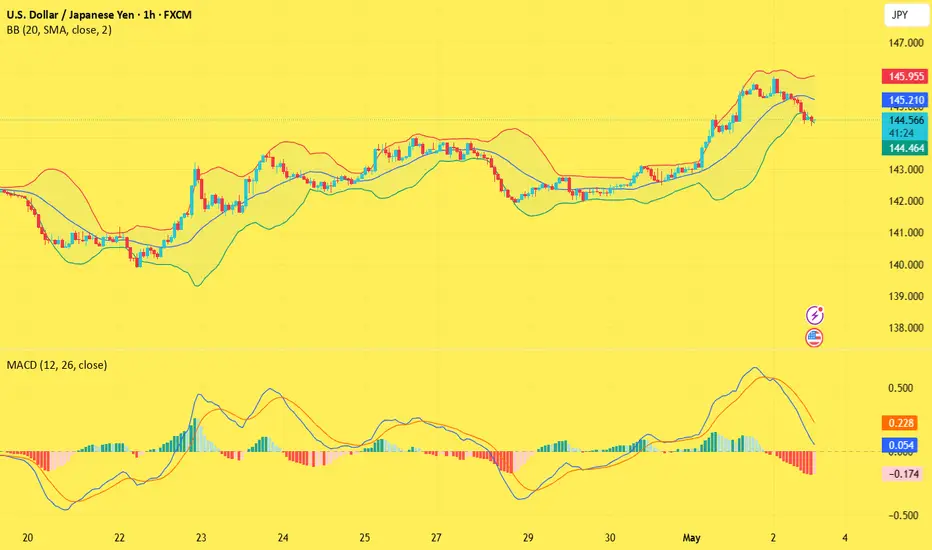
USD/JPY(20250502)Today's AnalysisToday's buying and selling boundaries:
144.67
Support and resistance levels:
147.49
146.44
145.75
143.58
142.90
141.84
Trading strategy:
If the price breaks through 145.75, consider buying, the first target price is 146.44
If the price breaks through 144.67, consider selling, the first target price is 143.58
USD/JPY(20250430)Today's AnalysisMarket news:
The European Central Bank expects prices to rise 2.9% over the next 12 months, up from 2.6% in February, according to a monthly survey released on Tuesday. This is the highest level since April 2024. The three-year indicator rose slightly to 2.5%. The ECB's first five-year forecast was 2.1%.
Technical analysis:
Today's long-short boundary:
142.32
Support and resistance levels:
143.13
142.83
142.63
142.01
141.81
141.51
Trading strategy:
If the price breaks through 142.32, consider buying, the first target price is 143.00
If the price breaks through 142.01, consider selling, the first target price is 141.81

USD/JPY(20250429)Today's AnalysisMarket news:
The U.S. Treasury Department raised its second quarter debt forecast to $514 billion. U.S. Treasury Secretary: The "X Day" for the debt ceiling issue will be announced soon.
Technical analysis:
Today's long-short boundary:
142.62
Support and resistance levels:
144.52
143.81
143.35
141.89
141.43
140.72
Trading strategy:
If the price breaks through 142.62, consider buying, the first target price is 143.35
If the price breaks through 141.89, consider selling, the first target price is 141.43

USD/JPY(20250428)Today's AnalysisMarket news:
The Fed's subsequent policy path considers two scenarios: First, there is no substantial progress in the negotiations between the United States and its trading partners. After 90 days, the US tariffs are still high. Weakened economic demand may prompt the Fed to cut interest rates starting in July, and the annual rate cut may reach 100 basis points; second, the negotiations are fruitful, tariffs are reduced, and the demand shock is small, but inflationary pressure continues. The Fed may postpone easing and only cut interest rates slightly in December. For the market, although the easing comes early in the first scenario, the "recession-style" rate cut may suppress risky assets.
Technical analysis:
Today's buying and selling boundaries:
143.40
Support and resistance levels:
144.89
144.33
143.97
142.83
142.47
141.91
Trading strategy:
If the price breaks through 143.97, consider buying, the first target price is 144.33
If the price breaks through 143.40, consider selling, the first target price is 142.83

USD/JPY(20250425)Today's AnalysisMarket news:
Federal Reserve-①Hamack: If economic data is clear, the Fed may cut interest rates in June
②Waller: It will take until July to get a clearer understanding of how tariffs affect the economy. If tariffs lead to higher unemployment, interest rate cuts may be initiated. ③The Atlanta Fed GDPNow model predicts that the US GDP growth rate in the first quarter will be -2.5%. ④Kashkari: The frequent announcements from Washington have brought challenges to policymakers and everyone.
Technical analysis:
Today's buying and selling boundaries:
142.79
Support and resistance levels:
143.94
143.51
143.23
142.34
142.06
141.63
Trading strategy:
If the price breaks through 142.79, consider buying, the first target price is 143.23
If the price breaks through 142.34, consider selling, the first target price is 142.06

btc . w4 . fancy SHORTthe 'OTF - one time frame' Break of the monthly is still due.
There was no chance for LONGS during the week for retail buyers, only late buyers.
We've traded 2 days just under resistance, accumulating:
- late LONGS
- early SHORTS
I'm willing to SHORT now on friday, once the OTF has been hit.
Scalling in from cwHigh upwards
Invalidation would be to keep pumping and then potentialy SFP on monday for downside.
R:R is alright! I like to give myself a 3% invalidation range till SL.

USDJPY Buy UpdateUSDJPY Buyers stepping in fully...
Analyzing the information from what the yearly candle printed a strong buy is building up at these level

USD/JPY(20250424)Today's AnalysisMarket News:
The United States hit a 16-month low in April. The total number of new home sales in the United States in March was an annualized to a new high since September 2024.
Technical analysis:
Today's buying and selling boundaries:
142.82
Support and resistance levels:
144.93
144.14
143.63
142.01
141.50
140.71
Trading strategy:
If the price breaks through 143.63, consider buying, the first target price is 144.14
If the price breaks through 142.82, consider selling, the first target price is 142.01

GOLD (XAU/USD) Breakout Watch –Bullish Continuation or Pullback?🔍 Instrument Analysis: XAU/USD (Gold vs USD)
Timeframe: Likely 1H or 4H (based on candle structure)
Indicators:
EMA 50 (Red) – Current value: 3,365.25
EMA 200 (Blue) – Current value: 3,248.04
📈 Current Market Structure
Price: Trading at 3,433.62, in a strong uptrend with higher highs and higher lows.
Trend: Bullish, supported by price trading above both the 50 EMA and 200 EMA.
Key Zones:
Immediate Resistance: ~3,430 - 3,440 zone (currently being tested).
First Support Zone: ~3,315 - 3,330
Second Support Zone: ~3,250 - 3,270
🧠 Scenario Analysis
✅ Bullish Scenario (Primary Bias)
Price is attempting a break and retest of the resistance zone.
If a successful retest confirms it as support, next upside leg could target 3,480+.
Bullish continuation is favored as long as price holds above 3,385 (recent breakout level).
⚠️ Bearish Scenario (Secondary Bias)
If price fails to hold above 3,385, we may see a pullback to:
3,315 - 3,330 support area (reaction likely due to proximity to EMA 50).
A deeper retracement toward the 3,250 zone, aligned with EMA 200, which would be a critical level for bullish continuation or breakdown.
📊 EMA Insight
EMA 50 > EMA 200: Confirms bullish momentum.
The slope of both EMAs is upward, reinforcing current upward trend.
A test of the EMA 50 may offer a buy opportunity if structure holds.
🔔 Trade Outlook
Bullish bias remains intact above 3,385.
Look for bullish price action confirmation (bullish engulfing, pin bars, etc.) on retest of resistance-turned-support.
Monitor volume/activity around 3,385-3,400 for potential rejection or continuation clues.

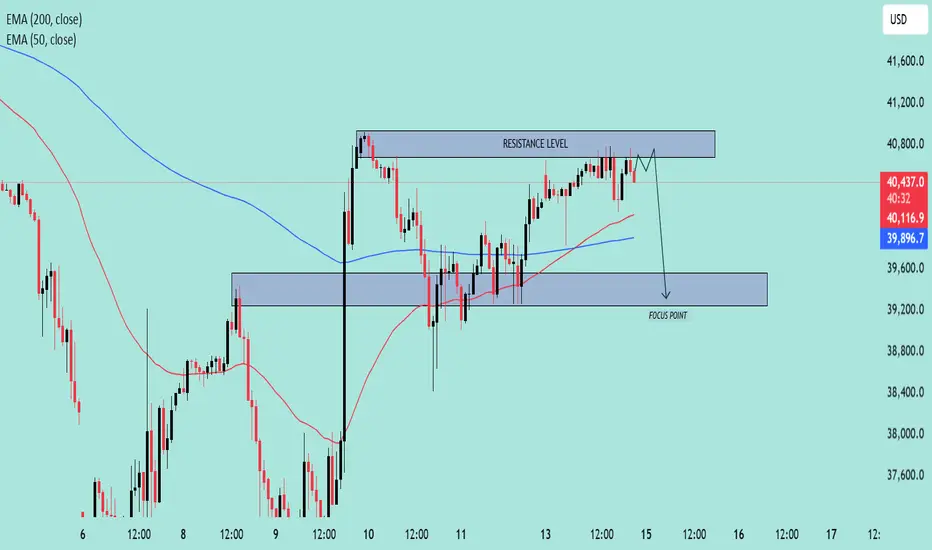
US30 Approaching Key Resistance–Potential Reversal Setup in Play🧠 Chart Overview
Asset: US30 (likely the Dow Jones Industrial Average)
Timeframe: Appears to be 1H or 2H
Indicators:
EMA 50 (Red): 40,119.5
EMA 200 (Blue): 39,897.3
Price at time of chart: Around 40,503
🔍 Key Technical Levels
🔴 Resistance Zone
Range: ~40,750 to 40,850
Price has tested this level multiple times and is currently hovering near it.
The resistance is holding, and no strong breakout has occurred.
🟦 Support / Focus Zone
Range: ~39,200 to 39,600
Marked as the “FOCUS POINT” – likely the expected target on a breakdown.
EMAs Insight:
Price is above both the 50 EMA and 200 EMA, suggesting short-term bullishness.
However, since it’s stalling at resistance, it could flip bearish on rejection.
🧭 Price Action Narrative
The chart suggests a potential fakeout above resistance, followed by a sharp rejection.
The path drawn shows a short-term dip, targeting the FOCUS POINT (support zone).
Rejection at resistance aligns with typical distribution behavior.
📌 Trade Idea (Bearish Bias)
Entry Idea: Short near or just above the resistance level (~40,800)
Target: 39,400 zone
Stop-Loss: Above the resistance level (~40,900+)
Risk/Reward: Favorable if price fails to break above resistance convincingly
📉 Bias: Bearish Reversal
Unless price breaks and closes above resistance with strong momentum, the chart favors a pullback scenario.
Gold (XAU/USD) Bullish Continuation Setup – Key Support Levels 📊 Chart Context & Setup
Chart Type: Candlestick
Indicators Used:
50 EMA (red): Currently at 3,199.009
200 EMA (blue): Currently at 3,123.168
Support Zone: Around 3,157.786 – 3,123.168
Current Price: Approximately 3,211.90
Focus Point (Target Zone): 3,283.810
🧠 Technical Analysis
🔹 Trend Analysis
Overall Trend: Bullish
Price is trading above both the 50 EMA and 200 EMA.
The EMAs are sloping upward, indicating strong momentum.
Golden Cross previously occurred (50 EMA crossing above 200 EMA).
🔹 Key Support & Resistance
Immediate Resistance Zone: Around 3,240
This area is acting as a potential rejection zone, with minor consolidation.
Support Zone (Highlighted): 3,157 – 3,123
This zone was previously a breakout level and now serves as a retest support.
It coincides with the 200 EMA, adding to its strength.
🔁 Scenarios Presented
Scenario A – Bullish Rejection from Immediate Support (3,199)
Price could hold above or near the 50 EMA.
Break and retest of minor resistance could lead to a push toward 3,283.81 (target).
This is a higher-risk entry as the support is not deeply tested yet.
Scenario B – Deeper Pullback to Major Support (3,157 – 3,123)
A drop below current price into the main demand zone.
Bullish engulfing or strong reaction in this zone would offer a high-probability long setup.
Ideal entry point for swing traders, especially if confirmed by volume or bullish candlestick reversal.
🎯 Trade Strategy Suggestion
✅ Long Setup
Entry Option 1: On bullish rejection above 3,199 with confirmation.
Entry Option 2 (Preferred): At strong support zone 3,157 – 3,123 with bullish reversal signal.
Target: 3,283.81
Stop Loss:
For Entry 1: Below 3,157
For Entry 2: Below 3,100 or 200 EMA, depending on aggressiveness
📌 Conclusion
This chart illustrates a classic bullish continuation setup with two potential entry scenarios:
A minor pullback and bounce from the 50 EMA.
A deeper retracement into a strong support zone aligned with the 200 EMA.
The uptrend remains intact as long as the price holds above the 200 EMA and the major demand zone. A break below 3,100 would invalidate the bullish outlook short-term

USD/JPY(20250417)Today's AnalysisMarket news:
U.S. import prices fell 0.1% in March from the previous month, the first month-on-month decline since September last year.
Technical analysis:
Today's buying and selling boundaries:
143.10
Support and resistance levels:
144.08
143.72
143.48
142.72
142.48
142.11
Trading strategy:
If the price breaks through 143.10, consider buying, the first target price is 143.48
If the price breaks through 142.72, consider selling, the first target price is 142.48
USD/JPY(20250416)Today's AnalysisMarket news:
U.S. import prices fell 0.1% in March from the previous month, the first month-on-month decline since September last year.
Technical analysis:
Today's buying and selling boundaries:
143.10
Support and resistance levels
144.08
143.72
143.48
142.72
142.48
142.11
Trading strategy:
If the price breaks through 143.10, consider buying, the first target price is 143.48
If the price breaks through 142.72, consider selling, the first target price is 142.48

USD/JPY(20250414)Today's AnalysisMarket news:
Fed Collins: It is currently expected that the Fed will need to keep interest rates unchanged for a longer period of time. If necessary, the Fed is "absolutely" ready to help stabilize the market; Kashkari: No serious chaos has been seen yet, and the Fed should intervene cautiously only in truly urgent situations; Musallem: The Fed should be wary of continued inflation driven by tariffs.
Technical analysis:
Today's buying and selling boundaries:
143.41
Support and resistance levels:
146.00
145.03
144.40
142.41
141.79
140.82
Trading strategy:
If the price breaks through 144.40, consider buying, the first target price is 145.03
If the price breaks through 143.41, consider selling, the first target price is 142.41

USD/JPY(20250411)Today's AnalysisMarket news:
The annual rate of the US CPI in March was 2.4%, a six-month low, lower than the market expectation of 2.6%. The market almost fully priced in the Fed's interest rate cut in June. Trump said inflation has fallen.
Technical analysis:
Today's long-short boundary:
145.38
Support and resistance levels:
149.05
147.68
146.79
143.97
143.08
141.71
Trading strategy:
If the price breaks through 145.38, consider buying, the first target price is 146.79
If the price breaks through 143.97, consider selling, the first target price is 143.08

USD/JPY(20250410)Today's AnalysisToday's buying and selling boundaries:
146.66
Support and resistance levels:
150.90
149.32
148.29
145.03
144.01
142.42
Trading strategy:
If the price breaks through 148.29, consider buying, the first target price is 149.32
If the price breaks through 146.66, consider selling, the first target price is 145.03

USD/JPY(20250408)Today's AnalysisToday's buying and selling boundaries:
146.92
Support and resistance levels
150.22
148.99
148.18
145.65
144.85
143.61
Trading strategy:
If the price breaks through 148.18, consider buying, the first target price is 148.99
If the price breaks through 146.92, consider selling, the first target price is 145.65

USD/JPY(20250407)Today's AnalysisMarket news:
Fed Chairman Powell: Wait for clearer news before considering adjusting policy stance. One year later, as the impact of Trump's policies becomes clearer, uncertainty should be greatly reduced. Intends to complete the entire term. Potential tariffs may have a lasting impact on inflation. The impact of tariffs on the economy may be greater than expected. Downside risks have increased, but the economy is still in good shape.
Technical analysis:
Today's buying and selling boundaries:
146.32
Support and resistance levels
149.17
148.11
147.41
145.22
144.53
143.46
Trading strategy:
If the price breaks through 146.32, consider buying, the first target price is 147.41
If the price breaks through 145.22, consider selling, the first target price is 144.53

USD/JPY(20250404)Today's AnalysisToday's long and short boundaries:
146.84
Support and resistance levels
150.91
149.39
148.40
145.27
144.28
142.76
Trading strategy:
If the price breaks through 146.84, consider buying, the first target price is 148.40
If the price breaks through 145.27, consider selling, the first target price is 144.28

USD/JPY(20250403)Today's AnalysisMarket news:
US trade policy-① Trump signed an executive order to establish a 10% "minimum base tariff" for all countries, and will impose reciprocal tariffs, including 20% for the EU, 24% for Japan, 46% for Vietnam, and 25% for South Korea. The tariff exemption for goods that meet the USMCA will continue, and the tariff for those that do not meet the requirements will remain at 25%; ② The US Treasury Secretary called on countries not to retaliate; ③ The base tariff will take effect on April 5, and the reciprocal tariff will take effect on the 9th. In addition, the 25% automobile tariff will take effect on the 3rd, and the automobile parts tariff will take effect on May 3rd; ④ Gold bars, copper, pharmaceuticals, semiconductors and wood products are also not subject to "reciprocal tariffs".
Today's buying and selling boundaries:
149.61
Support and resistance levels
150.97
150.46
150.13
149.08
148.75
148.24
Trading strategy:
If the price breaks through 148.75, consider buying, the first target price is 149.08
If the price breaks through 148.24, consider selling, the first target price is 148.00

USD/JPY(20250402)Today's AnalysisToday's buying and selling boundaries:
149.55
Support and resistance levels
150.70
150.27
149.99
149.11
148.83
148.40
Trading strategy:
If the price breaks through 149.99, consider buying, the first target price is 150.27
If the price breaks through 149.55, consider selling, the first target price is 149.11

USOIL Daily Analysis: Bullish Reversal from Key Support USOIL (WTI Crude Oil) daily chart showing price action analysis.
Key Observations:
Support Zone:
A strong demand zone is marked around $65-$66, which has acted as a reversal area in the past.
The price has recently bounced off this zone, indicating potential buyer interest.
Current Price Action:
Price is currently trading at $68.25.
A bullish move started from the support region, with a higher low formation suggesting potential upside momentum.
Potential Scenario:
The chart suggests a pullback before continuation to the upside.
If the support holds, $70-$72 could be the next target.
If price fails to hold above $66, further downside towards $64 may be possible.
Outlook:
Bullish Bias 📈 as long as the price remains above the demand zone.
Watch for a higher low confirmation before entering a long trade.
Breakout above $70 could signal a stronger rally.
