Technical-analysis

EURUSD Long-term analysis. Be prepared...Greetings fellow traders,
As time goes by, the markets evolve...
If your way of TA is strong, then the path will lead its way...
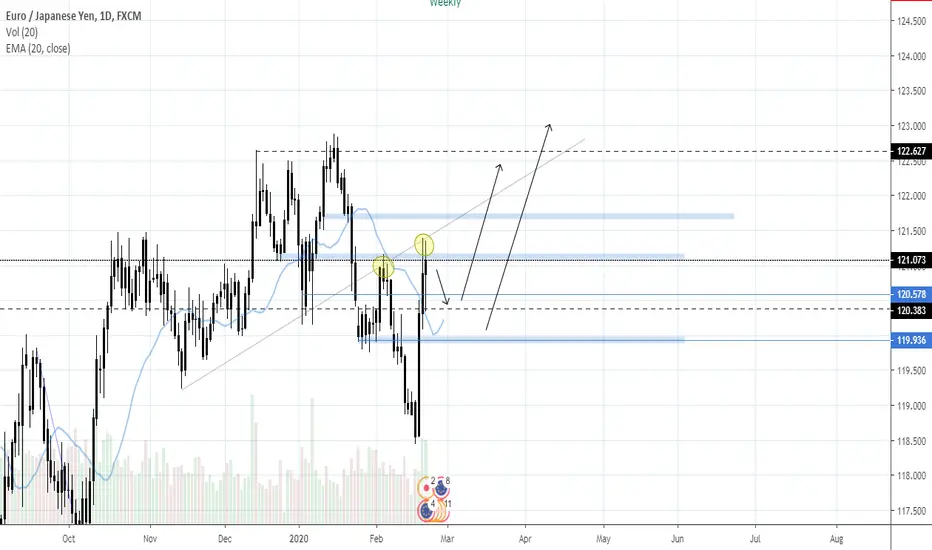
More visible, more probable:
Dashed lines; Possible forming patterns
Solid lines; Confirmed patterns / Support or Resistance
Dotted lines; Possible price-action trajectories / wave trend
Lighten colors = Support | Darken colors = Resistance
Today's Note:
Since I live in the EU zone, from time to time I shall publish my perspective on this market. This is going to be a long one...
I really hope I'm wrong with this. But, It's looking pretty bad. This might be another "The Great Short" moment. Meanwhile I've been analyzing the EURUSD for quite some time. Fundamentally, I don't see any reason for the Euro increasing its value to all-time highs. The tensions between Iran and USA is just another smokescreen of what truly is happening. After ECB establishing the negative interest rates, in the meantime, the first banks in the Netherlands has introduced the 0% savings interest rate. Most probably soon enough, the rest will follow. This is due to the new yearly cost for the banks. Concerning banks have to pay approximately, 100K Euro annually to the ECB. In short, if our citizens want to save their money, they will actually have to pay for it. I reckon this is happening everywhere in the EU zone. If you ask me, this is the real reason of the sudden increase of value and interest of the prominent commodities and bitcoin as well. Obviously, informed people are looking for safe havens.
"If you don't read the newspaper, you're uninformed. If you do read it, you're misinformed,"
~ Denzel Washington ~
Although It's logical that the current leaders and the mainstream media are lying about this. Otherwise it might cause a disastrous effects, like a great depression or worst case scenario, total anarchy.
I'm sorry to tell you, but it's not over yet...EU's moto: "If we're failing, let's do more of the failing!". The EU recently just agreed upon the "Green Deal", which is going to cost EU-citizens tax payers, at least, a whopping 11.000 billion euro project. Yes, you've read it right, it's not a typo, billions . I can imagine people are thinking, "you're crazy, why would they do that?". Unfortunately you can fact check this. I would not mention it, if it wasn't evidently fact checked. Although please do look it up yourself, it's always good to be informed. Most crazy about it, it's all based on fairy tales. But that's another subject I would rather avoid for now.
People are concerned about the huge debt of America. Clearly those people are misinformed about the value of money and how this is being used in the current economies of the 21st century. If you know your algebra, the variables of the equations are currently equal. Since all FIAT currencies are debt. Well, some tried but failed. Like colonel Qadhafi, who tried to introduce gold standards to a united states of Africa. I reckon I don't have to explain what happend after that. Needless to say, It does not matter that the US has a huge debt. Currently it's not about how much debt there is, but the velocity. How fast it is increasing, is more important now these days. We already know by now that every previous US presidents just made sure it didn't crash on their terms. Trump is doing a phenomenal job on decreasing the velocity even more.
Can't stress enough that I truly wish I am wrong with this, don't forget that I live in the EU zone. I'd rather not make money on this, than watching my people suffer. Honestly, I'm hoping for a NExit, get out of this sinking ship called, EU...
If you made it this far, appreciate taking your time. Hopefully this will be helpful to you.
To be concluded...

Oil Pushes Higher in Asia up 0.8% as Traders Await API DataHeadlines:
• Fortescue Metals Group Posts Half-Yearly Report Showing Revenues Up
• NOC Condemns Attack on Port & Asks for International Intervention
• Oil Pushes Higher in Asia up 0.8% as we Await API Data

AUDJPY watch for breakoutOn daily time-frame, it shows break and retest, Break of this Counter-trendline will take it down. Watch out for breakout and then short this pair

Platinum There is a head and Shoulders formation on platinum that could keep bulls on the hold,
One thing about price action and TA though is that what can not evolve vertical in price it can evolve sideways in time.
What I mean here is one would expect according to that H&S for price to go in lower levels, instead of that though and because of the strong support we found on the 50MA on the daily - marked by the green line on chart - price has been moving sideways using that level as a good buy zone
Also the down slopping trend line underneath is the trend we broke out after that multiyear bear market taken from that pick we had back on end of February 2008 , so we see that having all this support underneath we have a good reason to believe that price is set to go to the upside on the long term.
Forming that sideways move as we do at the moment negates the bearish sentiment of the H&S formation . A spike up will not favor the bulls at the moment as it will valid the bearish pattern.
I would like to see the price moving sideways for a while reversing slowly to the upside as it actually does for the last couple of days.

Waiting for USDCAD to do one of two things!Waiting for the market to give me a signal in one way or the other. The money is made in the waiting!

Bitcoin - Safe Entry Points - Dont Get Rekt!Fibonacci Retracement Levels:
Key levels have been totally respected at various moments and have acted as either support and resistance in different rallies.
Current bottom just so happens to be the .618 fib level. Not the cleanest but clean enough where it dipped to the level and traded sideways for over a month before this current rally back up to the 10k region.
Note: We are currently sitting right at the .382 fib level. Pretty much waiting to see if we break above or below.
Bullish Outlook:
We have broken the down-trend channel and currently sit at the .382 fib level while approaching a possible golden cross. This is an awesome sign from a bullish perspective.
RSI is trending upwards. Now just looking for a new high following a healthy retracement.
NVT beginning to signal a possible market-top upcoming. This means we need to see some huge price moves to the upside real soon to be convinced, else it could mean a huge dump in the future..lol
Reasons to be cautious here?
We are at a major resistance level as highlighted above.
Bitcoin has so many times had the 500MA approach the 200MA just to get rejected and continue its downside/sideways action.
RSI is trending upwards sure, but we’re in overbought territory for quite some time now and haven’t quite yet made a new high in RSI or a healthy retracement for that matter. I would be very attentive to the price level when that retracement does occur.
What am I looking for?
Bitcoin’s retracement is what’s most important to me at this very moment. In the near future it will become much clearer whether we make a new high in our RSI and have our price level break the current resistance and continue on up. I’d like to see RSI indicators cool off as we hold current price levels or break them. I’m going to have to see some fireworks with regards to price movement to be totally convinced about a trend reversal.
Mind the Gap:
Now the gap boys would love to see the $8500 price gap get filled. Now this doesn’t need to happen but it has 95% of the time, so that’s a good enough reason for me to take a look at it.
The $8500 gap price level just so happens to be at the .5 fib level.
With that being said I am pretty convinced that we are going to have a golden cross because of how sharp this rally upwards is. On the flip side, it’s going to take a massive dump down to reject that idea.
Conclusion: I can easily see us getting rejected here at this resistance, having a healthy retracement to fill the $8500 gap at the .5 fib level and still be at/above the 50MA. This is still bullish. This will also still complete the golden cross and BTC can continue and bounce up to break the resistance level and make new highs. I’ve circled a similar scenario in April of 2019 where we had a dump at the golden cross but remained above it, continuing a massive bull cycle that went on to about $14k.
Or..
We can hold current price levels or break above it as we have our technical indicators cool off. This will totally change my strategy and I will update this idea as it plays out.
Let me know what you think. This isn’t trading advice. Just my ideas and opinions on the current market.
Safe trading. Cheers!

BTC could hit 24k in JulyBTC just broke fib 0.382 resistance and is headed towards fib 0.5 at 11400 (weekly high from 2019 is around that area). If broken we are headed towards very important fib 0.618 which is last year's daily high at around 14000. BTC was parabolic in the first half of 2019 and it could be the same this year. If this is true we can hit ATH at around 24k by July. There are two important resistance lines before (the area around fib 0.786; 16800-18000) and of course ATH at around 20k. Parabolic target is also the top of the smaller bullish channel. RSI is relatively low at 60. MA cross happened in late December which is a very bullish sign. If BTC fails to broke 10k resistance-top of symmetrical triangle, retest of previous low is expected (around 7k), there is also channel support at 8k and fib 0.236 at 6400. I expect consolidation around 10k for now (8500-10500) before pump.

platinum looking goodPlatinum looking good at the moment .
We just created a higher high taking the 0.5 level that we got stopped recently after breaking out of that descending channel,
Strong resistance above us the 0.786 fib level that also coincides with the resistance we found on those levels in mid January.

Bitcoin weekly Uptrend confirmation! Up to 14000?Hello Guys,
last week has been closed with confirmation of uptrend. There signal to close all short positions and looking for entry points for new long trades.
We are prognosing short term correction and next impulse wave. Buy zone is expected to be in 8600-9200 area.
First resistance will be experienced on the yearly highs in area of 14000. In case of sucessful buyer attacks we are expect up move to all time highs.
Best Regars,
FOBS Team

9.3k support has held nicely. 11.5k by Valentines Day!Nothing more to say that I haven't already noted in the last two charts. Keep holding tight traders. We're about to pop!


Oil potential downside targetsOil has an aggressive fibonacci sequence pushing us lower. Oil has another sequence trying to push us lower if we continue and break above 53.40's then we will retest this aggressive fibonacci sequence at the 38 and 50% levels. Until we break above 55.50's I am bearish on oil. If we break above 55.50 then I will be prepared for the long setups to take place. If you like these setups or want to learn more, then like/comment/follow I will be having a free trade room and chat room available soon.

Gold to 159750% retracement will hold as support and potentially take us to target. If you like fibonacci or technical analysis like/comment/follow I will have a free trading chat room and trade room coming soon you can join.

GBPJPY: Analysis after the Bank of England.This is a break down analysis of GBPJPY after today's Bank of England Interest Rate Decision.
Fundamental Analysis:
- The BoE left the rates unchanged giving a minor lift to the GBP.
- JPY continues to work as a safe-haven under the current geopolitical conditions (coronavirus) and may work against the BoE lift on GBP.
Technical Analysis:
- The Resistance is set at 148.900 and the Support at 138.800
- The MA200 has the role of Support and the MA50 has just turned into a Resistance on the 1D chart.
- The RSI is on a bearish divergence since mid December 2019.
- The sequence is similar to the March 2019 top.
The above mix indicates that under the current geopolitical tension (China virus) demand for JPY as a safe heaven will continue to work against the pair. Assuming the RSI continues to be under a bearish divergence and the price will not break above the 1D MA50 by a wide margin, we expect the price to decline the lower support levels of 138.800 and 135.900 once 140.900 breaks.
If you like this idea give us a like, follow and share your thoughts in the comments section below. Remember to stay tuned for future technical analysis , news, updates, and more from PrimeXBT!


CADJPY short IdeaTrendline has been broken already on Daily Timeframe. Wait for market to fill the gap then enter the short position and Hold for few weeks, ENjoy pRofits.. !!!

EURNZD Go short Overall Trend is bearish and in co-relation to NZD it's Likely to go down since NZD will get strength soon

BTCUSD Inception day 18-1-2020, Weekend forecast.Greetings fellow traders,
As time goes by, the markets evolve...
If your way of TA is strong, then the path will lead its way...
More visible, more probable:
Dashed lines; Possible forming patterns
Solid lines; Confirmed patterns / Support or Resistance
Dotted lines; Possible price-action trajectories / wave trend
Lighten colors = Support | Darken colors = Resistance
' I’m trying to free your mind, Neo. But I can only show you the door. You’re the one that has to walk through it. '
~ Morpheus, The Matrix ~
With that having quoted, this is my way of keeping order in the chaos. I call it, "Pattern Formation Level(PFL)":
Alpha > Beta > Delta > Echo > Gamma > Theta
Explanation PFL:
This is an additional stage of usage of the pattern formations. Some level of experience in pattern formations is required. You can also ignore this part and head straight to 'Today's Note', just read the patterns between the brackets.
Alpha; ST / Bullish Pennant pattern formation, a.k.a. "The End Game", a.k.a. "The Big Long". (Daily and higher time-frames)
Beta; Most recent relevant and biggest forming pattern within The Alpha forming pattern. FW / DC. (4-24 hour time-frames)
Delta; Most recent relevant forming patterns within The Beta pattern. (4-8 hour time-frames)
Echo; Most recent relevant forming patterns within The Delta pattern. (1-4 hour time-frames)
Gamma; You get the picture... (10-60 min. time-frames)
Theta; Do not thread these treacherous waters. At least for master level TA skills or higher. (10 min. and lower time-frames)
Eventually the PFL's are all connected. Gamma patterns combines into Echo pattern and Echo patterns combines into Delta patterns etc. Until the Alpha patterns has been formed. I'm not calling it just the Alpha for dominance in size. For as this pattern, is, the Alpha and Omega. Which will end current market cycles and start anew. From time to time, I might thread the secret level when I'm feeling gutsy.
Additional advantage of the PFL system is, when you have to determine whether a certain pattern will have its usual breakout direction.
By inserting pattern formations in the PFL as parameter. This makes it easier keeping track of which pattern formations are relevant to the current TA and entry or exit strategies.
It might be hard to learn, but it is certainly easy to master. As a programmer and I like playing chess, as result to my TA. I like to look ahead as far as possible. This is only doable, if you have reasonable reliable trends to follow. In time, as I gain experience in the markets. My TA skills evolves and in parallel my systems and indicators.
-------------------------------------
Current Alpha patterns:
The End Game: Symmetrical Triangle 1st confirmations support & resistance establish, still in progress.
Current Beta patterns:
Falling Wedge/Descending Channel currently breaking out, might evolve into a Descending Broadening Wedge
Current Delta patterns:
Rising Wedge, 2nd confirmation of resistance established. But this might not breakout to the usual breakout direction of this pattern due to the Beta pattern's break out trajectory.
Current Echo patterns:
Ascending Broadening Wedge, 1st resistance confirmation established. Possibly heading to retest support.
Current Gamma patterns:
Ascending Broadening Wedge, 2nd support confirmation established. Possibly heading to retest resistance.
Current Theta patterns:
This level is currently too dangerous to trade. Greater patterns might break out or follow its trajectory.
Today's Note:
UFC fight tonight Connor vs. Cowboy, return of the notorious and Cowboy is pretty bad ass as well. Sorry completely off topic, but I'm expecting a great fight, don't wanna miss it. Hence the reason for this late update, I'm pretty much just been awake for few hours.
Anyways, there has been some nice scalping trade though. It looks like there might be even more scalping trade opportunities up ahead. However, what we really want to know, is there more room for upwards movements? My best guess is, that we'll know more after the weekends. When the futures market opens, I'll be waiting for a retest of a resistance in the lower time frames then I'm taking profits, partially. Momentum Waves are currently converging possible bearish divergences, might wanna keep an eye on that. Money flow's velocity in the higher time frames is slowly declining which is quite concerning. But the weekly is still very bullish but I want to see the money flow crossover the 0 line. In short, it's hard to tell whether bitcoin is going up more or not from this point. It might as well just consolidate moving forward. But it also might just shoot through the resistance tonight.
Anyways have a good evening or -night & weekend!
To be concluded...
Current Targets:
Exit long position / Entry short position target: $9.6K - $10.3K regions.
Tip's/FYI:
People = Psychology > Patterns > Indicators > Fundamentals. Nonetheless, all is crucial. Psychology? When you observe a chart. Ask yourself who's the most in pain? Bears or Bulls?
Watch & learn from experienced traders and discover your style of TA. Hence develop this, imitating will only get you as far.
The most accurate trend indicator when using logarithmic, are the; Relative-, Exponential-, Weighted-, Simple- and regular Moving Averages. At least use Heikin Ashi candles if you don't like MA's and vice versa or using both might be even better. The algorithms of these indicators adepts to logarithmic variables visually. Linear tools and pattern formations obviously do not for that matter. Since it doesn't concern logarithmic variables.
The trend is your friend!
Pattern Formations is the most accurate method, when it comes to observing the behavior of buyers and sellers. If you don't understand this, don't be lazy and google. Learn this as basics, pattern formations are ideal to combine with other methods.
Why I use the body instead of wicks when drawing patterns? Because I like to(and you should also) switch up between lines and candles and I hate to constantly change the properties... If you're an experienced analyst, you'll know this is a pain in the a... Nevertheless crucial. Figuring this out and looking at the charts with different perspectives, will give you more confidence finding the possible trends regardless of the method.
-------------------------------------
Epilogue:
Hopefully in time and it would be my honor, when other analyst implement at least some of my systems, methods and techniques into their TA. Henceforth bringing their TA skills & abilities to the next level. I have taken a lot of information from this community. However I believe. When you take, you should also share. After all, knowledge and experience are the most valuable things in life. This is why I share my daily TA. Hopefully other will learn from it, but never use someone else's TA. Always do your own do diligence before even considering trading.
If you don't want to miss out on any of my daily technical analysis. Then click or tap on follow and don't forget to smash on that like button ^^, thanks in advance. If you're worthy I'll follow you back!
In case you're wondering which indicator I'm using. She's called EMI , short for 'Epic Market Indicator' and she's a collection of diverse indicators. How to use, is in the description. You can use them like any other indicators. Search for 'epic market indicator' then add. I have recently published the latest versions. EMI 1 v3.0 & EMI 2 v2.0. Like any other instrument, practice makes perfect. If you have any input for EMI or questions about my way of TA(*Asian sound-effects*). Please leave a comment or DM me and I'll try to respond a.s.a.p. Be careful and good luck fellow traders, may the trend gods be with you!

TRX midterm uptrend comes. TRON up to $0.045 till July.Hello Guys,
Breaking up of bearish trend line and signals from our momentum strategies for long trades are coming on weekly TRX/USD chart.
We suppose it's end of bearish trend for TRX. There is begin of new midterm upmove . First target is going to be in area $0.023-0.024 .
We will support this positon trade on weekly base.
If this post was useful for you - please leave your likes and follow us on social networks! If you don't agree - write your vision in comments.
Best regards,
FOBS Team
