Technical

20 Reason for long GBPUSD1 Structure analysis time frame h4
2 target base: daily High
3 Current Move impulse
4 Entry Time Frame: h4
4.1 Entry TF Structure: bullish
4.2 entry move: bullish impulse
5 Support resistance base: fair value gap filled
6 FIB: shallow retracement
7 candle Pattern: bull momentum
8 Chart Pattern: falling wedge
9 Volume: Average
10 Momentum UNCONVENTIONAL Rsi: bullish above 60
11 Volatility measure Bollinger bands: support at middle bands
12 strength ADX: bullish
13 Sentiment ROC: bull at current time frame
14 Final Comment: buy
15: decision long
16 Entry: right now
17 Stop losel: 1.1495
18 Take profit: 1.2195
19 Risk to reward Ratio: 1:10
Excepted Duration: 10 days

EU BEARSIHEU it is currently retraced and is moving to a bearish move it has also broken the previous low in the lower time frame and testing the fib level

💁♀️ ETHUSDT / 1D 💁♀️Hi
💹Currently, the price is trading in the range of $1516. We may see a correction in the supply area of $1557/$1650.
Important resistance range $1557/$1650❗
It is important to maintain the range of $1240. ‼ ❗
Important support range $1100 / $1000 / $890 ⚠️
what do you think about it? I'M glad to know your idea..😊

NASDAQ100NASDAQ chart provide major indication where to buy or sell trend is sell yet but buy with stop lose is profitable

¡Only the begining, stay alert!Hello trader comunity! We are seeing that the markets want to change their trend. More especifically the people thats is behind the computers wants to make gtains after two trimesters in loss. In the other hand, the DXY is fatally crushing after reach the level of 114 and we are seeing lower highs as the index cling to supports. The pair USDJPY after reach the level of 152 gets a reaction from the bears of the pair and then found support in the level of 147 (ema 21). Next week we have de interest rate decision of the Bank of Japan, event that could bring volatily to the pair. But what we must see is how the DXY start the week, anf if it continuos dropping behind 112 ( acting as resistance), we expect a recover from the US500, pairs against the dolar, and the crypto market. This is not a financial advice, good trades and profits!

DXY/BTC inverse relationship holding In recent time an inverse relationship has emerged with BTC and DXY
Previously there were spikes that had inverse relationships between DXY and BTC (2018 and 2020) but since November last year there has been a solid inverse relationship that has been sustained the inverse pattern quite consistently.
** Disclaimer** I'm a novice trader working to put my thoughts out there to see how they stack up against the market - please feel free to share/comment on my studies - please don't use this chart as financial advice
Normally when I see blood in the water any morning I look at DXY movement and comfortably I can see that if DXY has moved several dollars up, BTC general takes a nose dive, and with that all other coins that are directly influenced by BTC (which is all of them) follow suite. It's unclear what drove the link between these two financial mechanisms but for the time being I monitor DXY against BTC to help manage my expectations and activity of crypto. I suspect people bail on BTC when DXY is up to flip into forex positions that may seem more lucrative. I may try to see if maybe USDC or USDT gain value from DXY in the future also.
That being said it's hard to pinpoint WHY specifically these two are now directly inversely linked in a sustained manner. It could also be just be strawman correlation while the fiat and crypto market consolidate the global financial situation, however its worth monitoring.
I will track these inverse relationship over time to see if at any point there is a decoupling or a strengthening of influence between these two indicators.

APE Coin potential dump into rally** Disclaimer** I'm a novice trader working to put my thoughts out there to see how the stack up against the market - please feel free to share/comment on my thoughts - please don't use this chart as financial advice
At this point, though, $APE coin sits in a precarious symmetrical triangle and has progressed quite deeply into it. It would suggest that APE is preparing for a move downward, and the predicted bottom price is ~$3. As my chart indicates, it has rejected its ATL resistance line three times. There could be a good reason for this leading to longer-term holders and speculative investors buying the coin when it hits its bottom. For the time being, I would wait to see how the coin stacks up in its triangle.
Considerations and Fundamentals;
$APE coin is a coin I've been following closely. As an artist with his own NFT collections, I enjoy looking at what influences the NFT market and how NFTS interacts with coins. For those that are not aware, NFTS, in theory, are deployed as tokens (same as coins) against a smart contract; however, their operability is adjusted slightly within the contract to do things like display an image. Many are unaware that the tokens, rather than ERC-20, are an ERC-721 standard, which is a convoluted way of stating that NFTs are non-devisable and non-fungible.
$APE coin is a relatively controversial coin. Most view it as a scam driven by a bunch of Crypto Bros who hit it big with their Bored Ape Yacht Club offering, which rocketed to price heights a year after release. I have no idea why that token, in particular, did so well. Regardless, it has enabled Yuga Labs (the brain trust of BAYC) to absorb voluminous amounts of money to invest in other projects. Projects such as Meebits, Cryptopunks (an OG NFT - close to 5 years old), and establish "Otherside", an upcoming metaverse game I'm interested in and want to play.
Two significant points of interest have had me bullish on $APE coin for much of this environment. Firstly, Otherside (the game) will utilise $APE coin as the mainstay currency. At this point, there is not enough information about the coin's utility in the universe or if people can potentially earn $APE coin through game mechanics; what it suggests is a future currency demand.
Beyond that, a staking mechanism has been on the cards for some time. The $APE Coin DAO voted and passed the concept six months ago. Company Horizen has been the key partner in establishing and delivering this mechanism. In a very lazy, low-key twitter post - the test net version of the staking mechanism has been released for public testing. The mainnet version is due "soon" - but was initially earmarked for the 31st of October - most are currently assuming with little comms that the date may be pushed back - some speculating even into December.
The short of the long is that this mechanism will allow Bored Ape collectors to stake their NFT within a pool for returns; however, there is a premium to stake your NFT. Two thousand odd Ape coins are required PER staked NFT. A prompt that will contribute to demand on the circulating supply of the coin further. With only 300m of the total supply in circulation and a good chunk of the coin being held by exchanges and early holders, I can see some short-term rallies coming.
At this point it would be safe to remain out of APE coin - but do note there are points of interest for the large community invested in the ecosystem to soak up the circulating supply coming in the future, so it may be a coin to watch.

Market going down? What do you thinkDISCLAIMER: I DO NOT GIVE SOLICITATION TO BUY OR SHORT
Seems like market is continue its down trend based on pattern. What do you think ? OCTOBER 21 , 2022
I cover various stocks which can be profitable based on the stock charts and technical indicators. I try my best to explain as detailed as possible but your feedback is also appreciated
Before you enter a trade , one must learn how to master the charts as Stock charts play a big role in deciding when to buy or when not to buy. Technical Trading help in predicting price movements and have a risk management. Stock trading is like any other business and must be taken seriously. Lot of people lose money because they don't educate themselves and end up placing trades blindly which results in big losses
Stock charts is the major component day traders, swing traders, core traders use. Times and technology has changed and if you cannot adapt to the new methods , there is a high chance you will be left behind
Millions of shares are traded now using desktop , laptop or gadgets and stock charts is what majority of traders look at.
So , if you want to be a daytrader , swingtrader or coretrader learn how to read and interpret charts. There are lot of great books out there like Thomas Bulkowski's Encyclopedia of chart patterns and Steve Nison Japanese Candlesticks interpretation
Having someone experienced can also cut the learning curve time for a new trader. Trading does take time and with discipline , hardwork , dedication and most importantly Passion for this needs to be there.


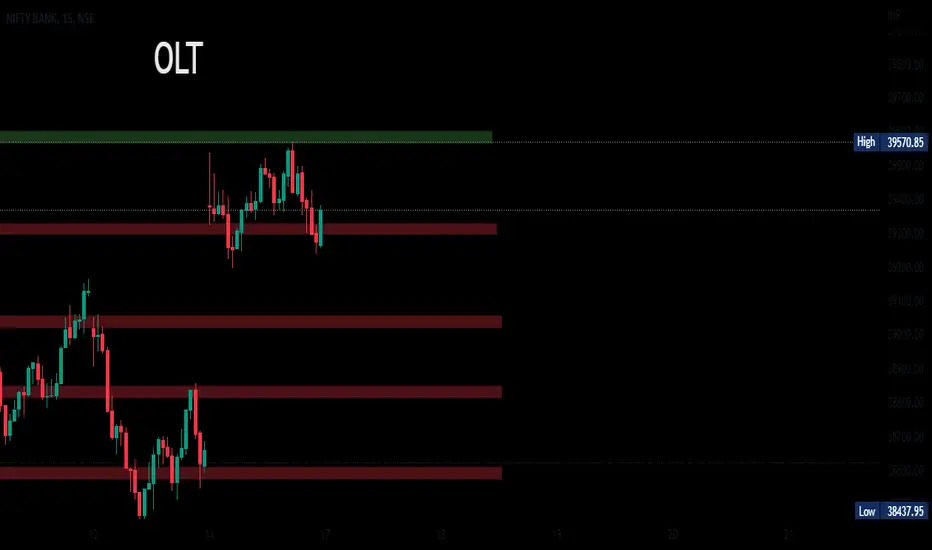
17/10/2022 BANKNIFTY SUPPORT AND RESISTANCE ZONEGood Morning guy's,
* As per data banknifty will open with gap down,
* So major support zone 39000
* If sustain above 39000 Banknifty then open target for 39300.
* Or break 39000 and sustain below open target 38800-38600

EURJPY SHORTThe pair just reached the H4 Resistance. I predict it will be a sell to 142.302422.
And there was no news that affectrd the price rejection. Pure Price Movement

ICPUSDT /1D
Currently, the price is fluctuating between 5.60 and 6.
The first support limits are $5/$5.50. Most likely, the price in these ranges will be associated with a positive reaction. If it is accompanied by a lot of selling pressure, further correction may be made. To enter, we must wait for the confirmation of the candlestick in these ranges. 💹
The important resistance range of 6.20 for a positive price trend should be above the stabilization range so that the next resistance range has a positive movement.
It is important to maintain the range of 4.64
what do you think about it? 🙂

APEUSDT/ D 💁🏼♀️#APEUSDT 1D
The price is currently fluctuating.
The first scenario that can be considered is that part of the important resistance range of 5.34/5.70 starts to be corrected or we see price correction from this range.
For a positive price trend, we should stabilize the price by crossing the dynamic resistance above the 5.80 range.
what do you thin about it ?
📆✨8/10/2022✨
💁🏻✨ @MehrnaziJiTrading_crypto✨

Bitcoin [ TA ] 08.10.2022Welcome to my daily chart of Bitcoin - this is a series of technical analyses
Think of it as a standard trade "newspaper"
#DYOR
Comment:
In the wake of yesterday's data, bitcoin did not feel too well and reacted perfectly to our liquidity zone and orderblock.
Accumulation in this area can be seen over the weekend or early Monday

USDT.D 4H
Dominance Tether
As you can see, it has reacted to the 7.25% support range and the 7.72% resistance range every time. It is currently in the range of 7.55%. It may move towards the range of 7.72. This issue can be a negative reaction for the cryptocurrency market. 💹
In case of exiting the box to the top and fixing the limited high of 7.72%, the possibility of growth up to the range of 7.80%/8% can be considered.❗️
It is important to maintain the range of 7.46%/7.43% to continue the trend ❗❗❗
what do you think about it?

LINKUSDT / 4H
#LINKUSDT
Currently, the price is in an important range. In order for the positive fluctuation to continue, the price must be stabilized above the range of $8, so that we can see growth up to 8.50.
But there is one point that the price is still lower than the second LOW that has been identified. If this range is lost, we may see further correction.

Bitcoin [ TA ] 07.10.2022Welcome to my daily chart of Bitcoin - this is a series of technical analyses
Think of it as a standard trade "newspaper"
#DYOR

Eos long short term
direction : long
Entry 1.154
Stop robat: 1.136
Target robat : 1.206
Leverage : cross 50X
Up: 1.22
Down : 1.13
Amount :(X pocket * leverage high) / leverage now )/ ( ((up/down ) /order difference (atr(240) (1min)% ) *min amount ))
Pocket :10
Pocket volume : balance /10
Amount : (100*50)/50 /( ((1.22/1.13)/0.05)*)5))
Amount : 23
Order difference : 0.05%
Order sell: 0.12%
Tp: 10% pocket used or tp 1
Please Notice the SL & TP on the chart are not exact numbers because no one can ever tell the market to the dot so therefore this is an area of interest . the If you have any questions please contact us via Private Message or via comment . Please add a comment ..... Positive feedback and constructive criticism are important to authors and community . Robotrade Not Financial Advice ; Rather, the trade assistant is by your side to avoid losses

Bitcoin [ TA ] 06.10.2022
Welcome to my daily chart of Bitcoin - this is a series of technical analyses
Think of it as a standard trade "newspaper"
#DYOR

BRENT OIL Daily chart
I will be looking for a long position potentially at the 61 fib / key level /right shoulder area also if price comes up to the red zone I will also take a short position

EUR /USD EUR / USD 1 hour chart
Here I will looking for a short position if we get the Head and shoulders play I will be looking for I will be looking for a bear flag pattern potentially to create the right shoulder then look at taking the trade down to my green box area for a buy also looking for another short position from the purple zone as a break retest
