Bitcoin [ TA ] 05.10.2022Welcome to my daily chart of Bitcoin - this is a series of technical analyses
Think of it as a standard trade "newspaper"
#DYOR
Technical

EURJPY SHORTThe pair has been going on a long for days now but in the weekly it touched the resistance heading to support. It recently touched the 4hrs resistance My prediction is it will go to 140.731.
And more importantly there was no news that affected the prices


Bitcoin [ TA ] 04.10.2022Welcome to my daily chart of Bitcoin - this is a series of technical analyses
Think of it as a standard trade "newspaper"
#DYOR

💲USD / CAD, Continuation of the uptrend, price accumulation💲USD / CAD, Continuation of the uptrend, price accumulation before the move.
In the current analysis, we look at USD / CAD.
We are currently at key levels, the price area around 1.36 1.38 is a moment of accumulation for this pair, which has been going on since September 26.
Today the level of 1.364 was defended, which gave us the confirmation of the Head and Shoulders Pattern. Considering that we are in a long-term upward trend, and the dollar continues to dominate other currencies in terms of strength, which is due to the flight of capital from Europe to America due to geopolitical tensions.
An interesting opportunity has arisen and it would be worth taking advantage of.
It is also worth mentioning the event that took place today and was the most important event today, i.e. the Core PCE Price Index (MoM) (Aug), which surprised the market consensus by beating expectations and amounting to 0.6% compared to the previous month in which was 0.1%.

Bitcoin [ TA ] 03.10.2022 - UPDATEWelcome to my daily chart of Bitcoin - this is a series of technical analyses
Think of it as a standard trade "newspaper"
#DYOR

Bitcoin [ TA ] 03.10.2022Welcome to my chart for bitcoin for today - this is a series of technical analyses that appear daily on my profile.
I encourage you to watch because this is a standard presser that is worth keeping an eye on daily during your speculations.
#DYOR

USDCAD Long to 1.40Hey traders!
Here's another opportunity that we're looking at.
USD and CAD has been known to be closely tied together especially in terms of its central banks.
However, with Canadian inflation softening, BoC might be looking to slow down on its tightening.
With this said, we're looking to long USDCAD based on terminal rate differential and in the back of broad USD strength.

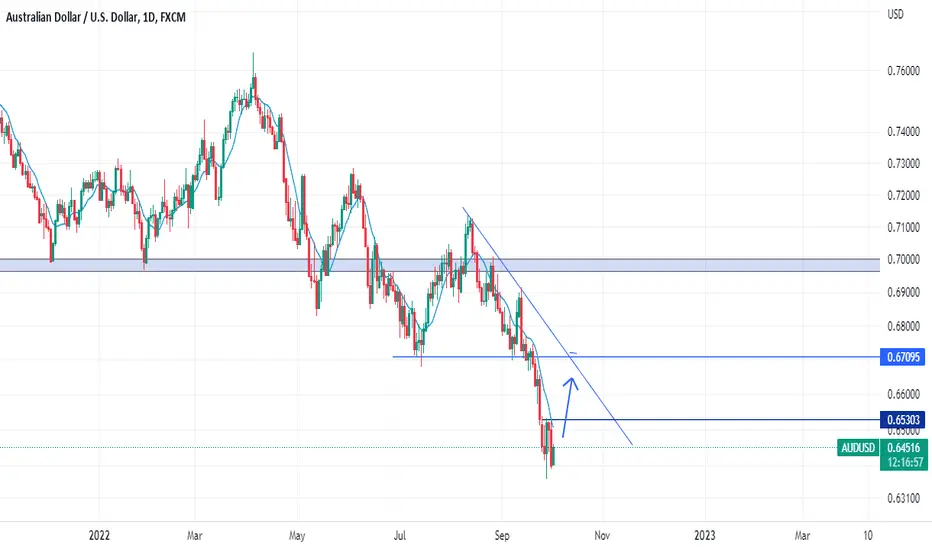
AUDUSD REVERSAL????AUDUSD might have suddenly have gotten tired of falling, a lot of profit taking from that zone
WHATS NEXT??? They would be bullish momentum to that upside, to the trendline area which also happens to be the 0.618 fibonacci level, this is enough confluence to later complete the overall bearish movement on AUDUSD. FINGERS CROSSED
NZDUSD Plan !Hello traders around the world!
Here's NZDUSD on a high time frame.
As you can see, we have three good reversal areas to take long positions if the price gave us a clear pattern.
I will be personally looking on the 1H chart for reversal patterns.
Patience is key.
#ThePrimes

adausdt/daily hi 😊
In the daily time frame, the price is currently in the support range of 0.42 cents, the important support range of Cardano is 0.40, if the important support it breaks , it is possible to correct it up to the support range of 0.35. Another scenario that can be considered is to fluctuate in the range of 0.40 to 0.43, in case of breaking the dynamic resistance, the price will move to the range of 0.45/0.48.

Educational Series: Trading with Boxes (Part 2)Remember from Part 1, that boxes
- identify momentum
- is trend-following
- is reactionary, and does not predict or anticipate a move.
In addition to using boxes to identify support/resistance levels, we can use boxes to identify breakout levels.
Breakout levels are identified when the price breaks from a previous day's low/high. If the price breaks from the low/high of multiple days, then you can expect a more significant move in that direction.
In Example 1:
- Price rejects the resistance level (formed by the confluence of 2 previous day's high)
- Breaking below the previous day's low
- Selling opportunity, SL beyond the box high, TP at the lower support level formed by the confluence of 2 box lows.
In Example 2:
- Price rejects resistance level (formed by the confluence of 4 previous days' high)
- Breaking below the previous day's low
- Selling opportunity, SL beyond the resistance level, TP at the lower support level, formed by the confluence of 2 box lows.
Note: In this case, the Risk:Reward ratio is lower than 1.
When using boxes, because it is reacting to price, it can have a tendency to be slightly lagging.
It is always a good practice to combine at least 2 different types of indicators in your analysis.

BTC - Symmetric TriangleBTS is actually into a symmetric triangle composed of a series of lower highs and higher lows, which will be pivotal in defining future price direction.
At the moment of this writing, 1H candle price action doesn't look great or seem suggesting that a move upwards is due. I would stay very cautious before entering a trade on BTC

ETHUSDT/ DAILY HI 😊
eth at the daily chart as you can see the price rang of between 1200/1400 $ / the important resistance of zone it's 1415$ and 1450$
first scenario is the price correction from the first resistance of zone 1415$/1450$
2 scenario is the price correction from here to support zone 1000$ and pullback to the price of 1200 $ /
the important support zone ; 1000$ / 800$ / 600 $
what do you think about it ?🤔

btcusdt/ DAILY the price rang of between 18000 to 20000 /
1: scenario/ If the downward trend breaks and stabilization above 20500/20800 its possible to touch 22000/
2: scenario/ is the price come back to the support zone range of 17000 , it will be break and The price will be continue to downward trend /
the important supports zone: 17600/ 14000/12000
what do you think about it ???

GBPUSD _ H4 SellSelling GBPUSD
**See below for detailed analysis**
- Multi time frame analysis
- Correlation analysis
GBPUSD :
- Q2 Pre-Direction
- Breakout of Structural low (weekly)
- Channel retest + 61.8% + Rejection
- Algorithm signal
- Lower TF Trendline Breakout/retest/rejection
- Structural Uptrend channel formation

EURUSD NEXT MOVES!Ill be keeping an eye on price action towards market close and early next week. I'm very interest in a longer term swing short trades but for the mean time I'm looking at a short term continuation long.. hope everyone has had a good trading week and ill be back on Sunday to cover any possible setups.

Good Swing opportunity in Berger paintGood opportunity in Berger paint
Berger paint making Flag and pole pattern
And it's making Inside bar candle and it's
taking
support from Fib level of 0.618.
If it's break above @643 Then target O is 677/700/711.
It's only for educational purpose buy on ur Risk

US10Y Elliot Wave Analysis (fun might be over) **WHERE DO WE START**
At this point it is nearly unarguable that the move up form the Covid lows looks impulsive, meaning we are in some sort of a new bull cycle.
In the past, since US10Y's inception back in the late 1970s the path it followed had a downwards trajectory that made new lows after each bull cycle was done. The US10Y would then correct those lows over the next 2-4 years or so and retrace to .5 fib or .618 fib of the previous high. It did this every single time, however in 2022 it is acting very different. For the first time in history since inception the US10Y blasted through the .618 fibonacci retracement of the previous top which was in November of 2018.
My view was bearish for most of this year since we were coming up against strong resistances, however since the price pierced through them all with little effort and continued up makes me lean bullish on the Macro outlook.
**TRUNCATION**
Truncation (definition) - What is truncation in trading. In most impulses, the fifth of the Elliott waves extends beyond the extremum of the third wave, but sometimes the fifth wave may not reach the end of the third wave . This phenomenon is called truncation or truncated wave.
The next event I need to go into is the truncation of the 5th wave down that took place in August of 2020. Truncations are rare events in Elliot Wave Theory and require very careful analysis to ensure the count is not something different. It is more likely to see a truncation in very volatile environments, and Covid crash of 2020 was undoubtably one. This truncation does not show up on US05Y or US02Y leading me to believe the actual bottom on US10Y was in August of 2020 and NOT in March of 2020. However this doesn't change the current count, just some clarification for those using Elliot Waves.
**WHERE ARE WE NOW**
Since the bottom we see an impulse up of which waves (1) and (2) are complete and wave (3) is in progress currently finishing it's 5th subwave. I expect the price to come to 4% or even 4.5% before the likelihood of a pullback for wave (4) becomes highly likely. The wave (4) retracement should be relatively large pulling back to .236 or .382 on the fibonacci levels from the top of wave (3). The price could come down to 2.75% - 3.5% on US10Y depending on how high wave (3) ends up going, although wave (4) pullback is allowed to go as low as .5 fib which could bring the US10Y down even below 2.75%, but I must say I find that unlikely considering how bullish this move up is coming to be.
**LIKELY PRICE PATH**
What's beginning to look clear is that after we finish wave (4) in a 3 wave structure down or perhaps a triangle formation (common in wave 4 pullbacks), we are still going to need to complete the impulse sequence and start a wave (5) up. Yes, I expect US10Y to hit and possibly go past 5%. Once there we have a completed wave 1 on a Macro outlook since the crash of 2020. I will then expect government treasury bond yields to enter a short term "bear market" and correct the entire move shown in the chart as red ABC down. This could then be last great pullback... and an opportunity to buy a house at a very affordable rate. Why? Because once this ABC that will correct this entire bull move up is done, we should see continuation in rising interest rates in a new bull cycle up. A 5 wave Elliot impulse is not a complete sequence, it should be followed by a 3, 7, or 11 wave down correction. Typically retracing to .5 or .618 on fibonnaci retracement levels and continue up again in a minimum of 5 waves.
**CONCLUSION**
The era of cheap rates might be coming to an end, and 2020 covid crash might have marked a long term bottom on treasury yields.
Cheers,

AUDCAD Next MoveTechnical Analysis Chart Update
AUD / CAD ( Australian Dollar / Canadian Dollar )
Time Frame - H4
Expanding Diagonal in Long Time Frame #LTF
Break of Structure ( 0.89088 - 0.88988 )
Fibonacci Level - 61.80% ( 0.89186 )
Rising Wedge in Short Time Frame #STF
" 4th " Impulsive wave completed and it will Follow Sell to Complete its Impulse
Selling Divergence

TESLA - Time to recharge batteries? Looking at Tesla from an Elliot Wave perspective shows a very bullish uptrend since inception of the stock itself. Corrections & Bear Markets are there to beat you down and make you want to give up, and once in a while we are do for a big one. Looking at the chart I see a completion of Macro wave III which started in June of 2019. This was a huge move for Tesla gaining approx. 3,350%. Yes you heard that right, so when we see a large pull back, we shouldn't question it.
The current correction can have many complex variations in Elliot Wave Theory, so far I see an ABC down complete, a correction up for wave (X), and now working on (Y) which should be in 3 waves as another ABC that could bring the price down to $138 as a 1:1 extension of wave A from top of wave (X). If it decides to go even deeper, suppose we have a drastic recession in the world markets including U.S., then the price is allowed to go as low as $28 or a 1.618 fibonacci retracement from wave B of (Y).
In a slightly more bullish view, suppose the elections get markets to have a bear market rally and prices start going up, then we have a possibility that we are still not done with wave B of (Y) show in red colored ABC. However, I see this rally too is likely to fail if it happens; in the end gravity will win brining Tesla down somewhere in the support box (area outlined). Here, a longterm probable bottom as well as a reversal to the upside is likely.
Cheers,

EUR/NZD UNIQUE IDEA ..(Sell)hi to all friends
Hope you all are enjoying me ideas and analysis. Now i am here to discuss about OANDA:EURNZD
OANDA:EURNZD Located in a descending channel ( DOUBLE TOP )....more downside....
NOTE:: Most likely, it will fall to the 61% Fibonacci support level
Trade Idea:
- Watch for bearish price action at the 38-50 fibonacci level and take OANDA:EURNZD down.
- Stoploss above the rejected price
- For take profit, once price moves down, use a descending trendline to manage your trade and exit when price breaks that.
After that it will follow again downtrend. Keep in touch we will update further soon.
Goodluck and as always, trade safe!

EURCADWe on price 1.325... This price level was used as Resistance while EurCad was consolidation phase... It gave the first touch n now going down again. Possibilities = it might make Double bottom N go bullish Or breakout on bearish but out entries on bearish will come after retest...
