Technical_analysis
USUALUSDT: What Price Action Is Telling Us Today - Usual◳◱ With Super Trend in play and the price at 0.5389, the market whispers opportunity. Breaking past 0.8931 | 1.196 | 1.6671 could spark a rally, while 0.422 | 0.2538 anchors bullish sentiment.
◰◲ General Information :
▣ Name: Usual
▣ Rank: 288
▣ Exchanges: Binance, Kucoin, Gateio, Mexc
▣ Category / Sector: N/A
▣ Overview: Usual project overview is currently unavailable. I'll try to update this in the upcoming analysis.
◰◲ Technical Metrics :
▣ Current Price: 0.5389 ₮
▣ 24H Volume: 92,622,307.521 ₮
▣ 24H Change: -3.145%
▣ Weekly Change: -13.97%%
▣ Monthly Change: -41.17%%
▣ Quarterly Change: N/A%
◲◰ Pivot Points :
▣ Resistance Level: 0.8931 | 1.196 | 1.6671
▣ Support Level: 0.422 | 0.2538
◱◳ Indicator Recommendations :
▣ Oscillators: BUY
▣ Moving Averages: STRONG_SELL
◰◲ Summary of Technical Indicators : SELL
◲◰ Sharpe Ratios :
▣ Last 30 Days: 1.10
▣ Last 90 Days: 3.20
▣ Last Year: 3.20
▣ Last 3 Years: 3.20
◲◰ Volatility Analysis :
▣ Last 30 Days: 3.18
▣ Last 90 Days: 2.94
▣ Last Year: 2.94
▣ Last 3 Years: 2.94
◳◰ Market Sentiment :
▣ News Sentiment: N/A
▣ Twitter Sentiment: N/A
▣ Reddit Sentiment: N/A
▣ In-depth BINANCE:USUALUSDT analysis available at TradingView TA Page
▣ Your thoughts matter! What do you think of this analysis? Share your insights in the comments below. Your like, follow, and support are greatly valued and help sustain high-quality content.
◲ Disclaimer : Disclaimer
The content provided is for informational purposes only and does not constitute financial, investment, or trading advice. Always conduct your own research and consult a qualified professional before making any financial decisions. Use of the information is solely at your own risk.
▣ Explore the Power of Charting with TradingView
Unlock a wide range of financial analysis tools, data, and features to elevate your trading experience. Take a tour and see the possibilities. If you decide to upgrade your plan, you can receive up to $30 back. Discover more here - affiliate link -
The Whispered Secrets Behind CGPTUSDT’s Movements - ChainGPT◳◱ On the BINANCE:CGPTUSDT chart, the BollingerBand Breakout pattern suggests an upcoming trend shift. Traders might observe resistance around 0.4838 | 0.6085 | 0.8686 and support near 0.2237 | 0.0883. Entering trades at 0.3872 could be strategic, aiming for the next resistance level. Currently, the price is trading near 0.3872, with key support at 0.2237 | 0.0883 and resistance at 0.4838 | 0.6085 | 0.8686.
◰◲ General Information :
▣ Name: ChainGPT
▣ Rank: 267
▣ Exchanges: Binance, Kucoin, Huobipro, Gateio, Mexc, Hitbtc
▣ Category / Sector: N/A
▣ Overview: ChainGPT project overview is currently unavailable. I'll try to update this in the upcoming analysis.
◰◲ Technical Metrics :
▣ Current Price: 0.3872 ₮
▣ 24H Volume: 94,764,005.058 ₮
▣ 24H Change: 13.582%
▣ Weekly Change: 65.21%%
▣ Monthly Change: 101.73%%
▣ Quarterly Change: 170.98%%
◲◰ Pivot Points :
▣ Resistance Level: 0.4838 | 0.6085 | 0.8686
▣ Support Level: 0.2237 | 0.0883
◱◳ Indicator Recommendations :
▣ Oscillators: NEUTRAL
▣ Moving Averages: STRONG_BUY
◰◲ Summary of Technical Indicators : BUY
◲◰ Sharpe Ratios :
▣ Last 30 Days: 3.22
▣ Last 90 Days: 2.45
▣ Last Year: 1.13
▣ Last 3 Years: 0.87
◲◰ Volatility Analysis :
▣ Last 30 Days: 3.32
▣ Last 90 Days: 2.17
▣ Last Year: 1.47
▣ Last 3 Years: 1.51
◳◰ Market Sentiment :
▣ News Sentiment: N/A
▣ Twitter Sentiment: N/A
▣ Reddit Sentiment: N/A
▣ In-depth BINANCE:CGPTUSDT analysis available at TradingView TA Page
▣ Your thoughts matter! What do you think of this analysis? Share your insights in the comments below. Your like, follow, and support are greatly valued and help sustain high-quality content.
◲ Disclaimer : Disclaimer
The content provided is for informational purposes only and does not constitute financial, investment, or trading advice. Always conduct your own research and consult a qualified professional before making any financial decisions. Use of the information is solely at your own risk.
▣ Explore the Power of Charting with TradingView
Unlock a wide range of financial analysis tools, data, and features to elevate your trading experience. Take a tour and see the possibilities. If you decide to upgrade your plan, you can receive up to $30 back. Discover more here - affiliate link -
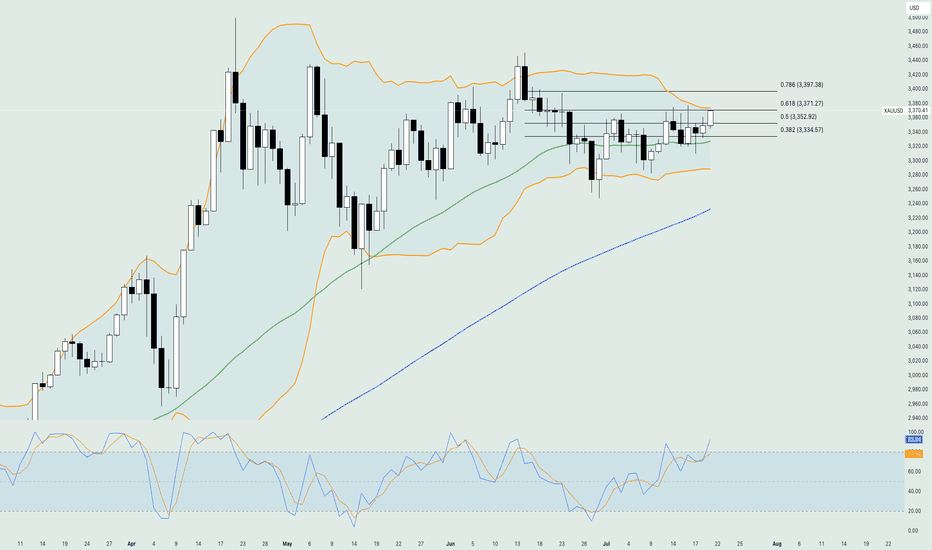
Understanding Symmetrical Triangle Breakout and Retest XAUUSD (Gold vs. US Dollar) is currently priced at 2680, with a target price set at 2660. This indicates a bearish outlook, suggesting the price is expected to drop. The pair has recently experienced a symmetrical triangle breakout, which is a technical chart pattern signaling potential price movement. After the breakout, the price is now in a retesting phase, a common occurrence where the price revisits the breakout level to confirm the move. Traders often view this as a critical period to assess the strength of the breakout. If the retest holds, it could validate the downtrend, increasing the probability of reaching the target price. However, failure to maintain the breakout level could result in a reversal. This scenario highlights the importance of monitoring key support and resistance levels. The retest phase provides an opportunity for risk management and strategic entry.
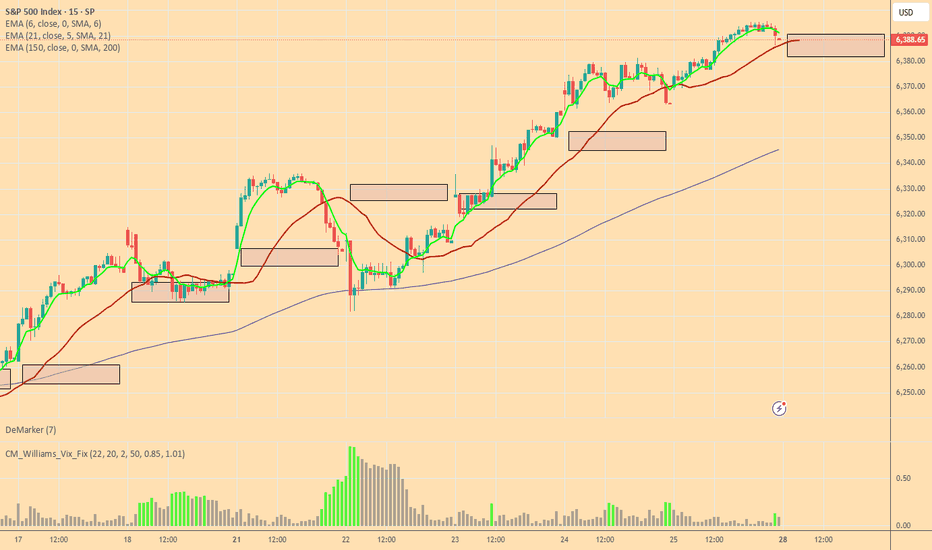
Bulls and Bears zone for 01-08-2025Yesterday S&P 500 sold off and closed near LOD which could caution momentum traders.
Any test of ETH session High could provide direction for the day.
Level to watch: 5956 --- 5958
News to watch:
US FOMC Minutes --- 2:00PM EST
Wishing everyone Happy, Healthy and Wealthy Year !!!
ZECUSDT: What the Market Is Whispering About Today - Zcash◳◱ On the BINANCE:ZECUSDT chart, the Super Trend pattern suggests a pause in volatility, potentially gearing up for a breakout. Traders might observe resistance around 66.05 | 73.53 | 93.48 and support near 46.1 | 33.63 | 13.68. Entering trades at 59.68 could be strategic, aiming for the next resistance level.
◰◲ General Information :
▣ Name: Zcash
▣ Rank: 121
▣ Exchanges: Binance, Kucoin, Huobipro, Gateio, Mexc, Hitbtc
▣ Category / Sector: Payments - Currencies
▣ Overview: Zcash is a privacy-preserving cryptocurrency providing anonymous value transfer using zero-knowledge cryptography. The protocol provides the option for transactions to be either shielded, in which case they will be completely anonymous, or transparent, in which case they will be visible on the Zcash blockchain. Zcash pays out a portion of its block rewards, called the "Founder's Reward", to fund protocol development. It currently allocates the Founder's Reward to the Electric Coin Company and the Zcash Foundation who develop and steward the Zcash protocol respectively.
◰◲ Technical Metrics :
▣ Current Price: 59.68 ₮
▣ 24H Volume: 26,131,359.620 ₮
▣ 24H Change: 8.786%
▣ Weekly Change: 4.11%%
▣ Monthly Change: 23.08%%
▣ Quarterly Change: 106.32%%
◲◰ Pivot Points :
▣ Resistance Level: 66.05 | 73.53 | 93.48
▣ Support Level: 46.1 | 33.63 | 13.68
◱◳ Indicator Recommendations :
▣ Oscillators: SELL
▣ Moving Averages: STRONG_BUY
◰◲ Summary of Technical Indicators : BUY
◲◰ Sharpe Ratios :
▣ Last 30 Days: 2.32
▣ Last 90 Days: 2.64
▣ Last Year: 1.06
▣ Last 3 Years: 0.01
◲◰ Volatility Analysis :
▣ Last 30 Days: 1.50
▣ Last 90 Days: 1.17
▣ Last Year: 0.94
▣ Last 3 Years: 0.88
◳◰ Market Sentiment :
▣ News Sentiment: N/A
▣ Twitter Sentiment: N/A
▣ Reddit Sentiment: N/A
▣ In-depth BINANCE:ZECUSDT analysis available at TradingView TA Page
▣ Your thoughts matter! What do you think of this analysis? Share your insights in the comments below. Your like, follow, and support are greatly valued and help sustain high-quality content.
◲ Disclaimer : Disclaimer
The content provided is for informational purposes only and does not constitute financial, investment, or trading advice. Always conduct your own research and consult a qualified professional before making any financial decisions. Use of the information is solely at your own risk.
▣ Explore the Power of Charting with TradingView
Unlock a wide range of financial analysis tools, data, and features to elevate your trading experience. Take a tour and see the possibilities. If you decide to upgrade your plan, you can receive up to $30 back. Discover more here - affiliate link -
VIDTUSDT: The Tipping Point Every Trader Is Watching - VIDT DAO◳◱ On the BINANCE:VIDTUSDT chart, the Td Sequential pattern suggests a pause in volatility, potentially gearing up for a breakout. Traders might observe resistance around 0.04192 | 0.05218 | 0.06923 and support near 0.02487 | 0.01808 | 0.00103. Entering trades at 0.03207 could be strategic, aiming for the next resistance level.
◰◲ General Information :
▣ Name: VIDT DAO
▣ Rank: 1044
▣ Exchanges: Binance, Kucoin, Mexc
▣ Category / Sector: N/A
▣ Overview: VIDT DAO project overview is currently unavailable. I'll try to update this in the upcoming analysis.
◰◲ Technical Metrics :
▣ Current Price: 0.03207 ₮
▣ 24H Volume: 2,649,650.101 ₮
▣ 24H Change: 0.564%
▣ Weekly Change: N/A%
▣ Monthly Change: N/A%
▣ Quarterly Change: N/A%
◲◰ Pivot Points :
▣ Resistance Level: 0.04192 | 0.05218 | 0.06923
▣ Support Level: 0.02487 | 0.01808 | 0.00103
◱◳ Indicator Recommendations :
▣ Oscillators: NEUTRAL
▣ Moving Averages: STRONG_SELL
◰◲ Summary of Technical Indicators : SELL
◲◰ Sharpe Ratios :
▣ Last 30 Days: N/A
▣ Last 90 Days: N/A
▣ Last Year: N/A
▣ Last 3 Years: 1.77
◲◰ Volatility Analysis :
▣ Last 30 Days: N/A
▣ Last 90 Days: N/A
▣ Last Year: N/A
▣ Last 3 Years: 2.17
◳◰ Market Sentiment :
▣ News Sentiment: N/A
▣ Twitter Sentiment: N/A
▣ Reddit Sentiment: N/A
▣ In-depth BINANCE:VIDTUSDT analysis available at TradingView TA Page
▣ Your thoughts matter! What do you think of this analysis? Share your insights in the comments below. Your like, follow, and support are greatly valued and help sustain high-quality content.
◲ Disclaimer : Disclaimer
The content provided is for informational purposes only and does not constitute financial, investment, or trading advice. Always conduct your own research and consult a qualified professional before making any financial decisions. Use of the information is solely at your own risk.
▣ Explore the Power of Charting with TradingView
Unlock a wide range of financial analysis tools, data, and features to elevate your trading experience. Take a tour and see the possibilities. If you decide to upgrade your plan, you can receive up to $30 back. Discover more here - affiliate link -
ILVUSDT: A High-Stakes Moment for Traders - Illuvium◳◱ On the BINANCE:ILVUSDT chart, the Td Sequential pattern suggests momentum building up for a significant move. Traders might observe resistance around 53.59 | 67.39 | 90.06 and support near 30.92 | 22.05. Entering trades at 40.77 could be strategic, aiming for the next resistance level.
◰◲ General Information :
▣ Name: Illuvium
▣ Rank: 267
▣ Exchanges: Binance, Kucoin, Gateio, Mexc, Hitbtc
▣ Category / Sector: Media and Entertainment - Gaming
▣ Overview: Illuvium is a decentralised game studio that merges the worlds of gaming and cryptocurrency. The game studio is building an open-world RPG adventure game on the Ethereum blockchain that allows players to collect, exchange and battle NFT assets.
◰◲ Technical Metrics :
▣ Current Price: 40.77 ₮
▣ 24H Volume: 4,601,102.937 ₮
▣ 24H Change: -1.212%
▣ Weekly Change: -24.25%%
▣ Monthly Change: -12.83%%
▣ Quarterly Change: 7.46%%
◲◰ Pivot Points :
▣ Resistance Level: 53.59 | 67.39 | 90.06
▣ Support Level: 30.92 | 22.05
◱◳ Indicator Recommendations :
▣ Oscillators: NEUTRAL
▣ Moving Averages: STRONG_SELL
◰◲ Summary of Technical Indicators : SELL
◲◰ Sharpe Ratios :
▣ Last 30 Days: 0.36
▣ Last 90 Days: 0.73
▣ Last Year: -0.42
▣ Last 3 Years: -0.70
◲◰ Volatility Analysis :
▣ Last 30 Days: 1.37
▣ Last 90 Days: 1.19
▣ Last Year: 1.03
▣ Last 3 Years: 0.98
◳◰ Market Sentiment :
▣ News Sentiment: N/A
▣ Twitter Sentiment: N/A
▣ Reddit Sentiment: N/A
▣ In-depth BINANCE:ILVUSDT analysis available at TradingView TA Page
▣ Your thoughts matter! What do you think of this analysis? Share your insights in the comments below. Your like, follow, and support are greatly valued and help sustain high-quality content.
◲ Disclaimer : Disclaimer
The content provided is for informational purposes only and does not constitute financial, investment, or trading advice. Always conduct your own research and consult a qualified professional before making any financial decisions. Use of the information is solely at your own risk.
▣ Explore the Power of Charting with TradingView
Unlock a wide range of financial analysis tools, data, and features to elevate your trading experience. Take a tour and see the possibilities. If you decide to upgrade your plan, you can receive up to $30 back. Discover more here - affiliate link -
Will DEXEUSDT Be the Next Market Leader? - DeXe◳◱ On the BINANCE:DEXEUSDT chart, the Bband Breakout pattern suggests an upcoming trend shift. Traders might observe resistance around 12.742 | 15.315 | 20.602 and support near 7.455 | 4.741. Entering trades at 11.943 could be strategic, aiming for the next resistance level.
◰◲ General Information :
▣ Name: DeXe
▣ Rank: 151
▣ Exchanges: Binance, Kucoin, Huobipro, Gateio, Mexc
▣ Category / Sector: N/A
▣ Overview: DeXe project overview is currently unavailable. I'll try to update this in the upcoming analysis.
◰◲ Technical Metrics :
▣ Current Price: 11.943 ₮
▣ 24H Volume: 50,568,227.836 ₮
▣ 24H Change: 9.338%
▣ Weekly Change: 40.39%%
▣ Monthly Change: 39.05%%
▣ Quarterly Change: 35.69%%
◲◰ Pivot Points :
▣ Resistance Level: 12.742 | 15.315 | 20.602
▣ Support Level: 7.455 | 4.741
◱◳ Indicator Recommendations :
▣ Oscillators: NEUTRAL
▣ Moving Averages: STRONG_BUY
◰◲ Summary of Technical Indicators : STRONG_BUY
◲◰ Sharpe Ratios :
▣ Last 30 Days: 2.41
▣ Last 90 Days: 1.19
▣ Last Year: 1.42
▣ Last 3 Years: 0.43
◲◰ Volatility Analysis :
▣ Last 30 Days: 1.19
▣ Last 90 Days: 0.93
▣ Last Year: 1.01
▣ Last 3 Years: 1.03
◳◰ Market Sentiment :
▣ News Sentiment: N/A
▣ Twitter Sentiment: N/A
▣ Reddit Sentiment: N/A
▣ In-depth BINANCE:DEXEUSDT analysis available at TradingView TA Page
▣ Your thoughts matter! What do you think of this analysis? Share your insights in the comments below. Your like, follow, and support are greatly valued and help sustain high-quality content.
◲ Disclaimer : Disclaimer
The content provided is for informational purposes only and does not constitute financial, investment, or trading advice. Always conduct your own research and consult a qualified professional before making any financial decisions. Use of the information is solely at your own risk.
▣ Explore the Power of Charting with TradingView
Unlock a wide range of financial analysis tools, data, and features to elevate your trading experience. Take a tour and see the possibilities. If you decide to upgrade your plan, you can receive up to $30 back. Discover more here - affiliate link -
Are We on the Verge of a Major FXSUSDT Shift? - Frax Share◳◱ On the BINANCE:FXSUSDT chart, the Bband Breakout pattern suggests a consolidation phase that could precede a trend continuation or reversal. Traders might observe resistance around 3.366 | 4.186 | 5.572 and support near 1.98 | 1.414 | 0.028. Entering trades at 3.383 could be strategic, aiming for the next resistance level.
◰◲ General Information :
▣ Name: Frax Share
▣ Rank: 275
▣ Exchanges: Binance, Kucoin, Huobipro, Gateio, Mexc, Hitbtc
▣ Category / Sector: Financial - Stablecoins
▣ Overview: Frax attempts to be the first fractional-algorithmic stablecoin protocol to implement design principles of both collateralized and algorithmic stablecoins. The Frax protocol is a two token system - the stablecoin FRAX, and Frax Shares (FXS), which are used to stablise the system, accrue seigniorage revenue and fees, as well as provide governance rights. The degree to which FRAX is collateralized is determined by market forces, with the collateral ratio determining the proportion of FRAX outstanding to be backed by collateral, with the remainder in FXS.
◰◲ Technical Metrics :
▣ Current Price: 3.383 ₮
▣ 24H Volume: 47,158,096.844 ₮
▣ 24H Change: 34.299%
▣ Weekly Change: 0.52%%
▣ Monthly Change: 29.85%%
▣ Quarterly Change: 71.48%%
◲◰ Pivot Points :
▣ Resistance Level: 3.366 | 4.186 | 5.572
▣ Support Level: 1.98 | 1.414 | 0.028
◱◳ Indicator Recommendations :
▣ Oscillators: BUY
▣ Moving Averages: STRONG_BUY
◰◲ Summary of Technical Indicators : BUY
◲◰ Sharpe Ratios :
▣ Last 30 Days: 1.04
▣ Last 90 Days: 1.40
▣ Last Year: -0.92
▣ Last 3 Years: -0.04
◲◰ Volatility Analysis :
▣ Last 30 Days: 1.45
▣ Last 90 Days: 1.10
▣ Last Year: 0.96
▣ Last 3 Years: 1.13
◳◰ Market Sentiment :
▣ News Sentiment: N/A
▣ Twitter Sentiment: N/A
▣ Reddit Sentiment: N/A
▣ In-depth BINANCE:FXSUSDT analysis available at TradingView TA Page
▣ Your thoughts matter! What do you think of this analysis? Share your insights in the comments below. Your like, follow, and support are greatly valued and help sustain high-quality content.
◲ Disclaimer : Disclaimer
The content provided is for informational purposes only and does not constitute financial, investment, or trading advice. Always conduct your own research and consult a qualified professional before making any financial decisions. Use of the information is solely at your own risk.
▣ Explore the Power of Charting with TradingView
Unlock a wide range of financial analysis tools, data, and features to elevate your trading experience. Take a tour and see the possibilities. If you decide to upgrade your plan, you can receive up to $30 back. Discover more here - affiliate link -
Why STEEMUSDT Could Be the Market's Next Big Opportunity - Steem◳◱ On the BINANCE:STEEMUSDT chart, the Supertrend Bband Breakout pattern suggests an upcoming trend shift. Traders might observe resistance around 0.3086 | 0.3589 | 0.4556 and support near 0.2119 | 0.1655 | 0.0688. Entering trades at 0.2187 could be strategic, aiming for the next resistance level.
◰◲ General Information :
▣ Name: Steem
▣ Rank: 504
▣ Exchanges: Binance, Huobipro, Gateio, Mexc
▣ Category / Sector: Media and Entertainment - Content Creation and Distribution
▣ Overview: Steem is a blockchain database that supports community building and social interaction with a built-in reward system to incentivize individuals making subjective contributions.
◰◲ Technical Metrics :
▣ Current Price: 0.2187 ₮
▣ 24H Volume: 37,295,184.283 ₮
▣ 24H Change: 12.096%
▣ Weekly Change: -15.43%%
▣ Monthly Change: 2.14%%
▣ Quarterly Change: 14.21%%
◲◰ Pivot Points :
▣ Resistance Level: 0.3086 | 0.3589 | 0.4556
▣ Support Level: 0.2119 | 0.1655 | 0.0688
◱◳ Indicator Recommendations :
▣ Oscillators: SELL
▣ Moving Averages: BUY
◰◲ Summary of Technical Indicators : NEUTRAL
◲◰ Sharpe Ratios :
▣ Last 30 Days: 2.18
▣ Last 90 Days: 1.58
▣ Last Year: 0.36
▣ Last 3 Years: 0.16
◲◰ Volatility Analysis :
▣ Last 30 Days: 1.70
▣ Last 90 Days: 1.16
▣ Last Year: 0.89
▣ Last 3 Years: 0.98
◳◰ Market Sentiment :
▣ News Sentiment: N/A
▣ Twitter Sentiment: N/A
▣ Reddit Sentiment: N/A
▣ In-depth BINANCE:STEEMUSDT analysis available at TradingView TA Page
▣ Your thoughts matter! What do you think of this analysis? Share your insights in the comments below. Your like, follow, and support are greatly valued and help sustain high-quality content.
◲ Disclaimer : Disclaimer
The content provided is for informational purposes only and does not constitute financial, investment, or trading advice. Always conduct your own research and consult a qualified professional before making any financial decisions. Use of the information is solely at your own risk.
▣ Explore the Power of Charting with TradingView
Unlock a wide range of financial analysis tools, data, and features to elevate your trading experience. Take a tour and see the possibilities. If you decide to upgrade your plan, you can receive up to $30 back. Discover more here - affiliate link -
TONBTC: The Tipping Point Every Trader Is Watching - Toncoin◳◱ On the BINANCE:TONBTC chart, the Td Sequential pattern suggests an upcoming trend shift. Traders might observe resistance around 0.00006793 | 0.00007471 | 0.00008795 and support near 0.00005469 | 0.00004823 | 0.00003499. Entering trades at 0.00005604 could be strategic, aiming for the next resistance level.
◰◲ General Information :
▣ Name: Toncoin
▣ Rank: 15
▣ Exchanges: Binance
▣ Category / Sector: N/A
▣ Overview: Toncoin project overview is currently unavailable. I'll try to update this in the upcoming analysis.
◰◲ Technical Metrics :
▣ Current Price: 0.00005604 ₿
▣ 24H Volume: 2.171 ₿
▣ 24H Change: 2.114%
▣ Weekly Change: -15.40%%
▣ Monthly Change: -1.21%%
▣ Quarterly Change: -3.14%%
◲◰ Pivot Points :
▣ Resistance Level: 0.00006793 | 0.00007471 | 0.00008795
▣ Support Level: 0.00005469 | 0.00004823 | 0.00003499
◱◳ Indicator Recommendations :
▣ Oscillators: BUY
▣ Moving Averages: BUY
◰◲ Summary of Technical Indicators : BUY
◲◰ Sharpe Ratios :
▣ Last 30 Days: 0.78
▣ Last 90 Days: 0.00
▣ Last Year: 1.37
▣ Last 3 Years: 0.76
◲◰ Volatility Analysis :
▣ Last 30 Days: 0.95
▣ Last 90 Days: 0.67
▣ Last Year: 0.85
▣ Last 3 Years: 0.91
◳◰ Market Sentiment :
▣ News Sentiment: N/A
▣ Twitter Sentiment: N/A
▣ Reddit Sentiment: N/A
▣ In-depth BINANCE:TONBTC analysis available at TradingView TA Page
▣ Your thoughts matter! What do you think of this analysis? Share your insights in the comments below. Your like, follow, and support are greatly valued and help sustain high-quality content.
◲ Disclaimer : Disclaimer
The content provided is for informational purposes only and does not constitute financial, investment, or trading advice. Always conduct your own research and consult a qualified professional before making any financial decisions. Use of the information is solely at your own risk.
▣ Explore the Power of Charting with TradingView
Unlock a wide range of financial analysis tools, data, and features to elevate your trading experience. Take a tour and see the possibilities. If you decide to upgrade your plan, you can receive up to $30 back. Discover more here - affiliate link -
Unlocking DUSKUSDT: The Data That Tells the Real Story - Dusk...◳◱ On the BINANCE:DUSKUSDT chart, the Trendline Touch pattern suggests an upcoming trend shift. Traders might observe resistance around 0.3231 | 0.3765 | 0.4805 and support near 0.2191 | 0.1685 | 0.0645. Entering trades at 0.198 could be strategic, aiming for the next resistance level.
◰◲ General Information :
▣ Name: Dusk Network
▣ Rank: 539
▣ Exchanges: Binance, Kucoin, Huobipro, Gateio, Mexc, Hitbtc
▣ Category / Sector: Infrastructure - Smart Contract Platforms
▣ Overview: Dusk Network is a blockchain protocol designed to support the development and deployment of security tokens.
◰◲ Technical Metrics :
▣ Current Price: 0.198 ₮
▣ 24H Volume: 2,315,408.090 ₮
▣ 24H Change: -2.511%
▣ Weekly Change: -25.51%%
▣ Monthly Change: 5.26%%
▣ Quarterly Change: -10.18%%
◲◰ Pivot Points :
▣ Resistance Level: 0.3231 | 0.3765 | 0.4805
▣ Support Level: 0.2191 | 0.1685 | 0.0645
◱◳ Indicator Recommendations :
▣ Oscillators: NEUTRAL
▣ Moving Averages: STRONG_SELL
◰◲ Summary of Technical Indicators : SELL
◲◰ Sharpe Ratios :
▣ Last 30 Days: 1.92
▣ Last 90 Days: 0.01
▣ Last Year: 0.68
▣ Last 3 Years: 0.24
◲◰ Volatility Analysis :
▣ Last 30 Days: 1.30
▣ Last 90 Days: 1.09
▣ Last Year: 1.15
▣ Last 3 Years: 1.18
◳◰ Market Sentiment :
▣ News Sentiment: N/A
▣ Twitter Sentiment: N/A
▣ Reddit Sentiment: N/A
▣ In-depth BINANCE:DUSKUSDT analysis available at TradingView TA Page
▣ Your thoughts matter! What do you think of this analysis? Share your insights in the comments below. Your like, follow, and support are greatly valued and help sustain high-quality content.
◲ Disclaimer : Disclaimer
The content provided is for informational purposes only and does not constitute financial, investment, or trading advice. Always conduct your own research and consult a qualified professional before making any financial decisions. Use of the information is solely at your own risk.
▣ Explore the Power of Charting with TradingView
Unlock a wide range of financial analysis tools, data, and features to elevate your trading experience. Take a tour and see the possibilities. If you decide to upgrade your plan, you can receive up to $30 back. Discover more here - affiliate link -
The Crucial Numbers Defining SCUSDT's Next Steps - Siacoin◳◱ On the BINANCE:SCUSDT chart, the Trendline Breakout pattern suggests an upcoming trend shift. Traders might observe resistance around 0.007926 | 0.009005 | 0.011148 and support near 0.005783 | 0.004719 | 0.002576. Entering trades at 0.005505 could be strategic, aiming for the next resistance level.
◰◲ General Information :
▣ Name: Siacoin
▣ Rank: 254
▣ Exchanges: Binance, Huobipro, Gateio, Mexc, Hitbtc
▣ Category / Sector: Services - File Storage
▣ Overview: Sia is a blockchain that offers decentralized cloud data storage and a peer-to-peer marketplace. Skynet is a decentralized file sharing and content delivery network built on top of the Sia blockchain. Siacoin is the native token of the Sia blockchain platform.
◰◲ Technical Metrics :
▣ Current Price: 0.005505 ₮
▣ 24H Volume: 2,985,437.812 ₮
▣ 24H Change: 1.12%
▣ Weekly Change: -19.59%%
▣ Monthly Change: -6.82%%
▣ Quarterly Change: 21.28%%
◲◰ Pivot Points :
▣ Resistance Level: 0.007926 | 0.009005 | 0.011148
▣ Support Level: 0.005783 | 0.004719 | 0.002576
◱◳ Indicator Recommendations :
▣ Oscillators: NEUTRAL
▣ Moving Averages: STRONG_SELL
◰◲ Summary of Technical Indicators : SELL
◲◰ Sharpe Ratios :
▣ Last 30 Days: -0.69
▣ Last 90 Days: 0.81
▣ Last Year: 0.22
▣ Last 3 Years: 0.09
◲◰ Volatility Analysis :
▣ Last 30 Days: 1.04
▣ Last 90 Days: 0.86
▣ Last Year: 1.02
▣ Last 3 Years: 0.94
◳◰ Market Sentiment :
▣ News Sentiment: N/A
▣ Twitter Sentiment: N/A
▣ Reddit Sentiment: N/A
▣ In-depth BINANCE:SCUSDT analysis available at TradingView TA Page
▣ Your thoughts matter! What do you think of this analysis? Share your insights in the comments below. Your like, follow, and support are greatly valued and help sustain high-quality content.
◲ Disclaimer : Disclaimer
The content provided is for informational purposes only and does not constitute financial, investment, or trading advice. Always conduct your own research and consult a qualified professional before making any financial decisions. Use of the information is solely at your own risk.
▣ Explore the Power of Charting with TradingView
Unlock a wide range of financial analysis tools, data, and features to elevate your trading experience. Take a tour and see the possibilities. If you decide to upgrade your plan, you can receive up to $30 back. Discover more here - affiliate link -
ARKUSDT: What Every Trader Needs to Know Right Now - Ark◳◱ On the BINANCE:ARKUSDT chart, the Trendline Touch pattern suggests momentum building up for a significant move. Traders might observe resistance around 0.7765 | 0.9164 | 1.1786 and support near 0.5143 | 0.392 | 0.1298. Entering trades at 0.5201 could be strategic, aiming for the next resistance level.
◰◲ General Information :
▣ Name: Ark
▣ Rank: 531
▣ Exchanges: Binance, Gateio, Mexc, Hitbtc
▣ Category / Sector: Infrastructure - Interoperability
▣ Overview: None
◰◲ Technical Metrics :
▣ Current Price: 0.5201 ₮
▣ 24H Volume: 3,361,359.843 ₮
▣ 24H Change: 1.9%
▣ Weekly Change: -17.63%%
▣ Monthly Change: -9.08%%
▣ Quarterly Change: 5.33%%
◲◰ Pivot Points :
▣ Resistance Level: 0.7765 | 0.9164 | 1.1786
▣ Support Level: 0.5143 | 0.392 | 0.1298
◱◳ Indicator Recommendations :
▣ Oscillators: BUY
▣ Moving Averages: SELL
◰◲ Summary of Technical Indicators : NEUTRAL
◲◰ Sharpe Ratios :
▣ Last 30 Days: -0.71
▣ Last 90 Days: 0.42
▣ Last Year: -0.05
▣ Last 3 Years: 0.27
◲◰ Volatility Analysis :
▣ Last 30 Days: 0.99
▣ Last 90 Days: 1.31
▣ Last Year: 1.19
▣ Last 3 Years: 1.19
◳◰ Market Sentiment :
▣ News Sentiment: N/A
▣ Twitter Sentiment: N/A
▣ Reddit Sentiment: N/A
▣ In-depth BINANCE:ARKUSDT analysis available at TradingView TA Page
▣ Your thoughts matter! What do you think of this analysis? Share your insights in the comments below. Your like, follow, and support are greatly valued and help sustain high-quality content.
◲ Disclaimer : Disclaimer
The content provided is for informational purposes only and does not constitute financial, investment, or trading advice. Always conduct your own research and consult a qualified professional before making any financial decisions. Use of the information is solely at your own risk.
▣ Explore the Power of Charting with TradingView
Unlock a wide range of financial analysis tools, data, and features to elevate your trading experience. Take a tour and see the possibilities. If you decide to upgrade your plan, you can receive up to $30 back. Discover more here - affiliate link -
Unlocking USUALUSDT: The Data That Tells the Real Story - Usual◳◱ On the BINANCE:USUALUSDT chart, the Bband Breakout pattern suggests an upcoming trend shift. Traders might observe resistance around 0.9028 | 1.0877 | 1.4627 and support near 0.5278 | 0.3377. Entering trades at 0.8451 could be strategic, aiming for the next resistance level.
◰◲ General Information :
▣ Name: Usual
▣ Rank: None
▣ Exchanges: Binance, Gateio
▣ Category / Sector: N/A
▣ Overview: Usual project overview is currently unavailable. I'll try to update this in the upcoming analysis.
◰◲ Technical Metrics :
▣ Current Price: 0.8451 ₮
▣ 24H Volume: 68,696,083.923 ₮
▣ 24H Change: 20.179%
▣ Weekly Change: 38.41%%
▣ Monthly Change: N/A%
▣ Quarterly Change: N/A%
◲◰ Pivot Points :
▣ Resistance Level: 0.9028 | 1.0877 | 1.4627
▣ Support Level: 0.5278 | 0.3377
◱◳ Indicator Recommendations :
▣ Oscillators: NEUTRAL
▣ Moving Averages: STRONG_BUY
◰◲ Summary of Technical Indicators : STRONG_BUY
◲◰ Sharpe Ratios :
▣ Last 30 Days: 10.70
▣ Last 90 Days: 10.70
▣ Last Year: 10.70
▣ Last 3 Years: 10.70
◲◰ Volatility Analysis :
▣ Last 30 Days: 2.12
▣ Last 90 Days: 2.12
▣ Last Year: 2.12
▣ Last 3 Years: 2.12
◳◰ Market Sentiment :
▣ News Sentiment: N/A
▣ Twitter Sentiment: N/A
▣ Reddit Sentiment: N/A
▣ In-depth BINANCE:USUALUSDT analysis available at TradingView TA Page
▣ Your thoughts matter! What do you think of this analysis? Share your insights in the comments below. Your like, follow, and support are greatly valued and help sustain high-quality content.
◲ Disclaimer : Disclaimer
The content provided is for informational purposes only and does not constitute financial, investment, or trading advice. Always conduct your own research and consult a qualified professional before making any financial decisions. Use of the information is solely at your own risk.
▣ Explore the Power of Charting with TradingView
Unlock a wide range of financial analysis tools, data, and features to elevate your trading experience. Take a tour and see the possibilities. If you decide to upgrade your plan, you can receive up to $30 back. Discover more here - affiliate link -
The Future of STXUSDT: A Look at the Key Catalysts - Stacks◳◱ On the BINANCE:STXUSDT chart, the Bband Breakout pattern suggests a consolidation phase that could precede a trend continuation or reversal. Traders might observe resistance around 2.817 | 3.178 | 3.998 and support near 1.997 | 1.538 | 0.718. Entering trades at 2.49 could be strategic, aiming for the next resistance level.
◰◲ General Information :
▣ Name: Stacks
▣ Rank: 56
▣ Exchanges: Binance, Kucoin, Gateio, Mexc
▣ Category / Sector: Infrastructure - Smart Contract Platforms
▣ Overview: Stacks (formerly Blockstack) provides software for internet ownership, which includes infrastructure and developer tools to power a computing network and ecosystem for decentralized applications (dApps). Its focus is to replace the reliance on centralized cloud service providers and apps that harvest and monetize user information. The Stacks network allows users to directly own digital assets like usernames, domain names, computer programs, etc. On the Stacks blockchain, computing is done on the edges (i.e., client devices), and applications on the platform store data individually and use the blockchain only when necessary.
◰◲ Technical Metrics :
▣ Current Price: 2.49 ₮
▣ 24H Volume: 85,569,157.492 ₮
▣ 24H Change: 3.063%
▣ Weekly Change: 2.63%%
▣ Monthly Change: 25.12%%
▣ Quarterly Change: 68.55%%
◲◰ Pivot Points :
▣ Resistance Level: 2.817 | 3.178 | 3.998
▣ Support Level: 1.997 | 1.538 | 0.718
◱◳ Indicator Recommendations :
▣ Oscillators: NEUTRAL
▣ Moving Averages: STRONG_BUY
◰◲ Summary of Technical Indicators : BUY
◲◰ Sharpe Ratios :
▣ Last 30 Days: 3.91
▣ Last 90 Days: 2.21
▣ Last Year: 1.28
▣ Last 3 Years: 0.53
◲◰ Volatility Analysis :
▣ Last 30 Days: 1.01
▣ Last 90 Days: 1.00
▣ Last Year: 1.12
▣ Last 3 Years: 1.17
◳◰ Market Sentiment :
▣ News Sentiment: N/A
▣ Twitter Sentiment: N/A
▣ Reddit Sentiment: N/A
▣ In-depth BINANCE:STXUSDT analysis available at TradingView TA Page
▣ Your thoughts matter! What do you think of this analysis? Share your insights in the comments below. Your like, follow, and support are greatly valued and help sustain high-quality content.
◲ Disclaimer : Disclaimer
The content provided is for informational purposes only and does not constitute financial, investment, or trading advice. Always conduct your own research and consult a qualified professional before making any financial decisions. Use of the information is solely at your own risk.
▣ Explore the Power of Charting with TradingView
Unlock a wide range of financial analysis tools, data, and features to elevate your trading experience. Take a tour and see the possibilities. If you decide to upgrade your plan, you can receive up to $30 back. Discover more here - affiliate link -
Critical Levels for AVABTC: Don't Miss These Signals - Traval...◳◱ On the BINANCE:AVABTC chart, the Trend Reversal pattern suggests indications that the trend may be gaining or losing strength. Traders might observe resistance around 0.0000091 | 0.00000998 | 0.00001223 and support near 0.00000685 | 0.00000548 | 0.00000323. Entering trades at 0.00002291 could be strategic, aiming for the next resistance level.
◰◲ General Information :
▣ Name: Travala.com
▣ Rank: 508
▣ Exchanges: Binance, Kucoin, Hitbtc
▣ Category / Sector: Payments - Payment Platforms
▣ Overview: None
◰◲ Technical Metrics :
▣ Current Price: 0.00002291 ₿
▣ 24H Volume: 62.175 ₿
▣ 24H Change: -22.654%
▣ Weekly Change: 195.55%%
▣ Monthly Change: 406.27%%
▣ Quarterly Change: 338.79%%
◲◰ Pivot Points :
▣ Resistance Level: 0.0000091 | 0.00000998 | 0.00001223
▣ Support Level: 0.00000685 | 0.00000548 | 0.00000323
◱◳ Indicator Recommendations :
▣ Oscillators: SELL
▣ Moving Averages: STRONG_BUY
◰◲ Summary of Technical Indicators : BUY
◲◰ Sharpe Ratios :
▣ Last 30 Days: 4.31
▣ Last 90 Days: 2.39
▣ Last Year: 1.17
▣ Last 3 Years: 0.55
◲◰ Volatility Analysis :
▣ Last 30 Days: 8.75
▣ Last 90 Days: 5.22
▣ Last Year: 2.70
▣ Last 3 Years: 1.75
◳◰ Market Sentiment :
▣ News Sentiment: N/A
▣ Twitter Sentiment: N/A
▣ Reddit Sentiment: N/A
▣ In-depth BINANCE:AVABTC analysis available at TradingView TA Page
▣ Your thoughts matter! What do you think of this analysis? Share your insights in the comments below. Your like, follow, and support are greatly valued and help sustain high-quality content.
◲ Disclaimer : Disclaimer
The content provided is for informational purposes only and does not constitute financial, investment, or trading advice. Always conduct your own research and consult a qualified professional before making any financial decisions. Use of the information is solely at your own risk.
▣ Explore the Power of Charting with TradingView
Unlock a wide range of financial analysis tools, data, and features to elevate your trading experience. Take a tour and see the possibilities. If you decide to upgrade your plan, you can receive up to $30 back. Discover more here - affiliate link -
The One Thing Everyone's Missing About CRVUSDT - Curve◳◱ On the BINANCE:CRVUSDT chart, the Bband Breakout pattern suggests an upcoming trend shift. Traders might observe resistance around 1.4705 | 1.7378 | 2.4061 and support near 0.8022 | 0.4012. Entering trades at 1.2631 could be strategic, aiming for the next resistance level.
◰◲ General Information :
▣ Name: Curve
▣ Rank: 99
▣ Exchanges: Binance, Kucoin, Huobipro, Gateio, Mexc, Hitbtc
▣ Category / Sector: Financial - Decentralized Exchanges
▣ Overview: Curve Finance is a decentralized exchange optimized for low slippage swaps between stablecoins or similar assets that peg to the same value (e.g. wBTC/renBTC). The protocol employs a Automated Market Maker that was built specifically to give DeFi users low slippage and liquidity providers steady fee revenue.
◰◲ Technical Metrics :
▣ Current Price: 1.2631 ₮
▣ 24H Volume: 138,006,035.406 ₮
▣ 24H Change: 6.943%
▣ Weekly Change: 4.76%%
▣ Monthly Change: 327.13%%
▣ Quarterly Change: 351.68%%
◲◰ Pivot Points :
▣ Resistance Level: 1.4705 | 1.7378 | 2.4061
▣ Support Level: 0.8022 | 0.4012
◱◳ Indicator Recommendations :
▣ Oscillators: NEUTRAL
▣ Moving Averages: STRONG_BUY
◰◲ Summary of Technical Indicators : BUY
◲◰ Sharpe Ratios :
▣ Last 30 Days: 9.88
▣ Last 90 Days: 4.84
▣ Last Year: 1.00
▣ Last 3 Years: 0.20
◲◰ Volatility Analysis :
▣ Last 30 Days: 1.89
▣ Last 90 Days: 1.32
▣ Last Year: 1.11
▣ Last 3 Years: 1.12
◳◰ Market Sentiment :
▣ News Sentiment: N/A
▣ Twitter Sentiment: N/A
▣ Reddit Sentiment: N/A
▣ In-depth BINANCE:CRVUSDT analysis available at TradingView TA Page
▣ Your thoughts matter! What do you think of this analysis? Share your insights in the comments below. Your like, follow, and support are greatly valued and help sustain high-quality content.
◲ Disclaimer : Disclaimer
The content provided is for informational purposes only and does not constitute financial, investment, or trading advice. Always conduct your own research and consult a qualified professional before making any financial decisions. Use of the information is solely at your own risk.
▣ Explore the Power of Charting with TradingView
Unlock a wide range of financial analysis tools, data, and features to elevate your trading experience. Take a tour and see the possibilities. If you decide to upgrade your plan, you can receive up to $30 back. Discover more here - affiliate link -
The Future of LTOUSDT: A Look at the Key Catalysts - LTO Network◳◱ On the BINANCE:LTOUSDT chart, the Trendline Touch pattern suggests a consolidation phase that could precede a trend continuation or reversal. Traders might observe resistance around 0.213 | 0.2278 | 0.2663 and support near 0.1745 | 0.1508 | 0.1123. Entering trades at 0.2217 could be strategic, aiming for the next resistance level.
◰◲ General Information :
▣ Name: LTO Network
▣ Rank: 635
▣ Exchanges: Binance, Kucoin, Gateio, Hitbtc
▣ Category / Sector: Infrastructure - Enterprise and BaaS
▣ Overview: LTO Network is a hybrid blockchain designed for trustless B2B collaboration. The private layer is for data sharing and process automation (each process residing on its own miniature ad-hoc permissionless private chain). The public layer acts as a global security settlement layer — an immutable digital notary. This hybrid approach makes LTO Network GDPR and data privacy compliant, as well as scalable and ready for adoption.
◰◲ Technical Metrics :
▣ Current Price: 0.2217 ₮
▣ 24H Volume: 3,401,353.860 ₮
▣ 24H Change: 1.884%
▣ Weekly Change: 14.23%%
▣ Monthly Change: 87.18%%
▣ Quarterly Change: 117.57%%
◲◰ Pivot Points :
▣ Resistance Level: 0.213 | 0.2278 | 0.2663
▣ Support Level: 0.1745 | 0.1508 | 0.1123
◱◳ Indicator Recommendations :
▣ Oscillators: NEUTRAL
▣ Moving Averages: BUY
◰◲ Summary of Technical Indicators : BUY
◲◰ Sharpe Ratios :
▣ Last 30 Days: 6.69
▣ Last 90 Days: 3.77
▣ Last Year: 1.55
▣ Last 3 Years: 0.32
◲◰ Volatility Analysis :
▣ Last 30 Days: 1.25
▣ Last 90 Days: 0.92
▣ Last Year: 0.93
▣ Last 3 Years: 1.15
◳◰ Market Sentiment :
▣ News Sentiment: N/A
▣ Twitter Sentiment: N/A
▣ Reddit Sentiment: N/A
▣ In-depth BINANCE:LTOUSDT analysis available at TradingView TA Page
▣ Your thoughts matter! What do you think of this analysis? Share your insights in the comments below. Your like, follow, and support are greatly valued and help sustain high-quality content.
◲ Disclaimer : Disclaimer
The content provided is for informational purposes only and does not constitute financial, investment, or trading advice. Always conduct your own research and consult a qualified professional before making any financial decisions. Use of the information is solely at your own risk.
▣ Explore the Power of Charting with TradingView
Unlock a wide range of financial analysis tools, data, and features to elevate your trading experience. Take a tour and see the possibilities. If you decide to upgrade your plan, you can receive up to $30 back. Discover more here - affiliate link -
FISUSDT: This Key Metric Could Define the Future - Stafi◳◱ On the BINANCE:FISUSDT chart, the Bband Breakout Super-Trend pattern suggests an upcoming trend shift. Traders might observe resistance around 0.4346 | 0.4671 | 0.5427 and support near 0.359 | 0.3159 | 0.2403. Entering trades at 0.5039 could be strategic, aiming for the next resistance level.
◰◲ General Information :
▣ Name: Stafi
▣ Rank: 714
▣ Exchanges: Binance, Huobipro, Gateio, Mexc
▣ Category / Sector: Financial - Derivatives
▣ Overview: None
◰◲ Technical Metrics :
▣ Current Price: 0.5039 ₮
▣ 24H Volume: 1,992,676.241 ₮
▣ 24H Change: 5.463%
▣ Weekly Change: 24.00%%
▣ Monthly Change: 53.27%%
▣ Quarterly Change: 69.61%%
◲◰ Pivot Points :
▣ Resistance Level: 0.4346 | 0.4671 | 0.5427
▣ Support Level: 0.359 | 0.3159 | 0.2403
◱◳ Indicator Recommendations :
▣ Oscillators: BUY
▣ Moving Averages: STRONG_BUY
◰◲ Summary of Technical Indicators : STRONG_BUY
◲◰ Sharpe Ratios :
▣ Last 30 Days: 4.56
▣ Last 90 Days: 2.55
▣ Last Year: 0.73
▣ Last 3 Years: 0.25
◲◰ Volatility Analysis :
▣ Last 30 Days: 1.16
▣ Last 90 Days: 0.88
▣ Last Year: 1.15
▣ Last 3 Years: 1.20
◳◰ Market Sentiment :
▣ News Sentiment: N/A
▣ Twitter Sentiment: N/A
▣ Reddit Sentiment: N/A
▣ In-depth BINANCE:FISUSDT analysis available at TradingView TA Page
▣ Your thoughts matter! What do you think of this analysis? Share your insights in the comments below. Your like, follow, and support are greatly valued and help sustain high-quality content.
◲ Disclaimer : Disclaimer
The content provided is for informational purposes only and does not constitute financial, investment, or trading advice. Always conduct your own research and consult a qualified professional before making any financial decisions. Use of the information is solely at your own risk.
▣ Explore the Power of Charting with TradingView
Unlock a wide range of financial analysis tools, data, and features to elevate your trading experience. Take a tour and see the possibilities. If you decide to upgrade your plan, you can receive up to $30 back. Discover more here - affiliate link -