Technical Analysis !!!👨🏫Hello, my trader friends🙋🏻.
I want to tell you the story of Technical Analysis, its advantages & disadvantages.
We're even gonna learn about its branches.
Like any other science, Technical Analysis has come a long way, and it's still evolving. But why should we learn it and know it well?🤷🏻
When you're trading, you may be afraid or greedy. But how do professional traders control these two?🤔
Let me start with a simple example.
If someone turns off the lights & challenges you in a new room, you will feel scared or lack confidence because you don't know that place. But if the challenge happens in your bedroom or home🏡, you'll feel more powerful 💪🏻 and confident because this environment is familiar & you can act better.✅
Fear is caused by the unknown. When you don't know this market, you can't get good results (or at least permanent good results).
So follow this page to conquer all the peaks⛰️ of Technical Analysis together🙌🏻 and learn from A to Z of it.
Also, I'm a fellow traveler on this route🛤️, not your tour guide.
So, if you have any questions, ask me in the comments💬.
My trader fellas, let's take one step👣 at a time because taking long and hurried steps will only hit you harder. I'm with you in all these steps🪜 & get started with the first type of market analysis.
Technical Analysis is old. I mean, it's almost 300 years old📜, but it doesn't like to talk about its age, so we couldn't find the exact information about its birth date🗓️😑.
Maybe it’s from Japan⛩️🎌 and was born in the 18th century, or perhaps its date of birth is in the Middle Ages.
But there is some more information that I'm sure about. For example, in 1879, the Technical Analysis found a friend by the name of Chart📈, and they have not separated until today.
Let's skip this story and be serious☺️. Technical analyzers believe that everything is in the Chart.
In Technical Analysis, there is all the necessary information for trading, such as entry points, exit points, market volume, stock prices in the past and present, etc. (The Chart is a complete encyclopedia for Technical analyzers!!🤦🏻😶 )
There is another type of analysis that examines the available information about a stock (from the founder of a stock or company to the cost and income and even the company manager's records), called Fundamental. But the Technicalists say that even some of the Fundamental information is in the Chart! 😐
Overall, Technical and Fundamental are both complementary to each other and opposite to each other. But both are related to the Chart. (These three have a complicated relationship; I mean, there is a love triangle, so we should stay out of it !!🤫😂 )
Let's skip the joke. All these things are just like the gears⚙️ of a car, but it's not enough. You need to follow more rules in the market to pass the finish line🏁 with your trading car🏎️ . Don't worry cause I'm gonna tell you everything you need to know to win🏆 this trade racing with your strategy car.
Now that we have learned a little about the history of Technical Analysis, it is better to learn about its contents.
The price chart, our most important resource and tool in Technical Analysis, consist of the price-time, Charts, and Candles.
But these candles🕯️ existed 100 years before bar and dot charts.📊📉
In 1700, a Japanese man named Huma realized that the price of rice depended on the emotions of traders in addition to supply and demand.
Candles show these feelings with their colors.
For example, the green candles🟢 show trust and good feelings among people who invested in a stock.🤑
But red candles🔴 indicate doubts or hopelessness of people about a stock, and they sell it.😞
I don't know why I remembered Moody's octopus doll🐙 :)
But candles tell you the feelings of other traders just like these dolls. But only its color is not essential.
Can you guess the other important factors about candles? I will tell you the rest of them soon.😉.
Have you heard that history repeats itself?
By looking carefully🧐 at the old charts, some creative people found that the prices behaved similarly to their past.
They realized that the candles make interesting shapes next to each other, and they made these shapes repeatedly in different periods.🔁
They formed different geometric shapes and patterns & continued to make these shapes until today :)
Let's accept that the Chart is creative and artistic! 🎨🖌️😊
For example, they found a shape called a Head & Shoulders Pattern. This type of pattern will cause a downward trend⤵️ in the Chart.
I tried to find it & place it on someone's Head & Shoulders to remember it better. 😁
Many patterns can be found in any chart, and I have already taught the reversal patterns in my previous posts, But I want to go over all the patterns in detail again in the future, so let's dive into the other contents of Technical Analysis.👇
Using formulas, mathematical🧮 ratios, and advanced calculations, indicators were created that can generally show the market's present and past and give a relative opinion about the future (Please don't get the indicators wrong with magic 8 ball🎱 or Professor Dumbledore's wand✨. )
Let's be serious about it. Maybe you know that indicators depend on the two factors of time and place of price.
In terms of time🕦, they are divided into two categories: leading and lagging.
In terms of price movement💹, they are divided into three categories: trend indicators, oscillators, and volume indicators.
The indicator that I made the above meme for is a leading oscillator.
Now it’s time to go for the other various tools that are made by using numbers🔢 and people’s actions in the market.
A person named Nelson Elliott made a useful tool, although, after his death, many people worked on this tool and improved it until today it reached us, but we are going to discuss it better in the following posts like the rest of the contents of Technical Analysis.😉
But I have to say Elliot believed that the market is not disordered and always repeats a repetitive cycle, and Eliot called these repeated movements waves.
According to him, if you can perfectly identify the repeating patterns in the price, you can predict how the price will change (or not change) in the next phase.
Eliot published his experiences and theories in a book called the waves principle, which I recommend if you want to get good information in this field; it's better to start from the origin of this theory.
I think there is no better definition for the word "Wave" than sea waves🌊, and I tried to draw Elliot waves like sea waves reaching the shore. 🏖️
In the end, I want to say that whatever style of analysis you have or whatever type of Chart you use, in the future, this machine will not go the right way without following a series of principles.
Suppose you have the best car in the world, but you neither know how to drive nor the rules. It can be guessed that you will either crash with someone or break the car💥.
You should have risk management along with your trading system, and don't forget that no trading system is perfect.🙅🏻
It is better to try each method on demo accounts before making real trades.
Of course, you can count on me and ask any questions you may have.🙂💭
In the following posts, I’ll talk more about the things that have been said and introduce you to good trading systems that can be obtained from any method.
I'm by your side so that if you are a beginner, you can find your own way, and if you know the market, we can learn the basics of this market better & together🤝🏻.
Wish you happiness, health & success guys🙋🏻.
Technical_analysis

#COMP/BTC [Compound]: T.Line_Breakout_+_ConfirmationWe've detected a Trendline Breakout and Confirmation on the $COMP/$BTC chart. The price has broken above a key resistance level and has been confirmed by a strong bullish candle, indicating a potential bullish trend. We may consider buying at the current price zone and targetting higher level.

Tusdt long tradeFollow the diagram buy when the price comes at entry shown in diagram. Trade can take some days to complete .
Entry = 0.4464
Sl = 0.2375
Tp = 0.8952
Follow if you like my idea.

Bulls and Bears zone for 01-25-2023Lately, market seems to sell off during ETH session than tries to rally during RTH session.
Today might be the same. Any test of yesterday's Low could provide direction for the day.
Level to watch 3991 ---3989
Report to watch:
US:EIA Petroleum Status Report
10:30 AM ET

Bitcoin on the Edge: Trading in a Tight Range, Will it Break OutAt the time of writing, Bitcoin is still within its current range, bounded by the monthly resistance level of $23,301 and the daily support level of $22,393. We are below the Value area Low (VAL) of the current range and testing the daily support level.
For the bearish scenario: we have liquidity and stop losses along with the CME gap around the $20,000 level. It’s a significant psychological level and hard to break, but if we break through this level, we can expect a drop around $18,170-$18,540 which is a 0.66 Fibonacci level from overall lows to the current high. This level previously acted as a strong resistance.
For the bullish scenario: if the price manages to break above the $23,301 monthly level, then we can witness another $1,000 rise upwards around the $24,297 weekly level, or if the bullish momentum is strong enough, then we can expect the price to move straight to $25,211 for the swing failure pattern (SFP) or Failed auction (FA) of the last high before a significant sell-off.
Conclusion: As of now, we are in the mini range and will trade the range until it breaks. With apparent resistance and support levels, traders can identify entry and exit points to capitalize on the current market conditions.

Bitcoin-TA-2023, Bearish PossibilityHello everyone, hope you all are doing good.
Recently i made a short-term Bitcoin analysis about the Bullish scenario of Bitcoin .
Since in trading we have to think in two ways (both upside and downside).
So, this time am making the Bearish scenario of Bitcoin . As of now the way Bitcoin is moving somewhat similar to 2014 Bear market.
The action or movement in the RSI is little similar:
The Drops = 1+2+3+4
DoubleTop = A+B
BullishDivergence = 2+3
RSI pump from x to y roughly 40 to 70 level to create "B" of DoubleTop
Important Point: Divergences are something like "slow transformation of trend" ex: converting Bullish to Bearish or Bearish to Bullish .
Bullish action in price = lowerLow->again->lowerLow(slowly Drop percent reduces gradually)->next->DoubleBottom or small higerLow->next->higherLow->next->higherLow(slowly percent increases gradually).
In 2014 after BullishDivergences formed "2+3" the result of next move after Divergences formed, the price+RSI has to normalize, so it made DoubleBottom in Price and higherLows in RSI .
Currently Jan2023 Bitcoin moved a massive pump right after Bullish Divergences formed "2+3", so the conclusion here is the Price+RSI has to normalize.
In RSI pullback has to happen means HigherLow has to be created. So, what will be the price action I can't say exactly but it can be doubleBottom or small LowerLow/small higherLow.
Not financial Advice, but IMO based on the above analysis Bitcoin may move up little and finally Bottom out to in a range of 17k to 14k.
Note:
The above Analysis is only Bearish scenario of current Bitcoin action. (Only If Head and Shoulders Pattern fails.)
Bitcoin-TA-2023 Short Term Analysis
Thank you, stay samrt n safe.


BTC Surprises and Market Analysis: Navigating the Current RangeAs we approached the weekend, I was expecting Bitcoin to get the Swing Failure Pattern (SFP) of $21,647 and continue to the range, I was expecting liquidity to leave the market, but I was wrong as BTC had different plans and did a great job of surprising me. Initially, BTC did precisely what I was expecting. I took the short trade and stopped out (Refer to my last post). I patiently waited for some reaction from $21,827.5 to play out as it was a significant weekly level along with a 0.66 Fibonacci level. The bullish momentum was so strong and rapid that it managed to break through the weekly level, leaving several single prints behind us. My next resistance level was a daily level of $22,393. Price broke through this level without difficulty and stopped at the monthly level of $23,301.
As of now, MS is bullish, and if we want any move toward the downside, we need MS to change in 30min to 1-hour charts first before we take any new swing short trades. We're still in the 6-month range; before getting excited and sending BTC to the moon, we must reclaim the $25,211 level. We currently have the Monthly $23,301 level acting as a current resistance and a Weekly $24,297.5 level, along with a 0.886 Fibonacci level right above us. We also have an SFP at the $25,211 level.
Currently, we are right above the VAH of the entire range.
For the downside, I would like BTC to get accepted below the VAH of the range, Claiming a daily naked point of control level at $22,612. I would like to see at least two 30 minutes candle closes before getting into any short trades. This move up was rapid, so once we get acceptance below VAH of the entire range, we can expect the price to have a quick fall to the $20,673- $20,957 level, as we have several new daily levels, which can act as a great support.
For Upside, I will expect the price to reclaim the monthly level before getting into any long trades. All my trades will be scalps with a tight stop loss.

Range Bound: Analyzing Key Levels in the Bitcoin MarketYesterday, the Bitcoin market experienced significant volatility; however, Today's activity was relatively subdued as the price of bitcoin fluctuated between $20,646.5 and $21,179.5. This trend persisted throughout the Asia and London trading sessions; BTC struggled to claim the Point of Control of the current range and spent most of the time between $20,650- $20,964. After the NY Open, we saw BTC start grinding upwards, and before the NY close, the price finally reached the level at which I had intended to enter a short trade, allowing me to enter at $21,144.5.
Currently, the market remains within the developing range of $21,481 to $20,400, with key levels including the Value Area High at $21,237, the Point of Control at $20,908.5, and the Value Area Low at $20,677. (These numbers can vary slightly based on price action)
In terms of future market activity, there are several potential scenarios to consider.
Scenario no.1: Point of Control may act as a form of support, allowing the price to continue upward to reach the 0.66 Fibonacci level and the Value Area High, then get accepted into the range and begin to move towards the Value Area Low of the range.
My trading strategy would be to enter a short trade, as soon as it appears that the price is being accepted in the Value area High of the range, my TP1 would be the Point of Control, and I would allow the trade to run as I anticipate that price will break through Value area Low and grab the liquidity from $20,000 level.
Scenario no.2: Price continues ranging and takes the liquidity below $20,000, fills the CME gap, gets accepted back in the range, and then continues the bull trend. It is worth noting that entering a long trade in this scenario may be challenging, as it can be a continuation of a downtrend on a long-term time frame. To minimize risk, I will be monitoring the price action closely. I will wait for the price to get acceptance within the Value Area Low of the range and at the level of $20,246 before entering a conservative long position.
Based on my analysis, there are several key levels to consider before jumping into any trade.
On the upward trend, key levels to consider include the 0.618 fib level and an untapped weekly level at $21,827.5. f the price manages to break through this resistance, the following significant levels to watch are the daily level at $22,393, the monthly level at $23,301, and the weekly level at $24,297.
On the downward trend, a consolidation area around $18,375-$18,850 may serve as support, as it previously acted as resistance before the breakout. f the price breaks through this zone, it is advisable to look for support at levels between $17,450 - $17,750, as there are several daily Naked Point of Control levels, untapped daily levels, and a 0.66 fib level from the low to the current high.
I have set alerts for all these important levels and will approach potential trades with patience, carefully observing market reactions before making any decisions. If the levels do not hold, I will remain patient and look for potential opportunities at the following levels.

Bulls and bears zone for 01-19-2023Two days in a row S&P 500 tried but could not Close above 4000 level.
Did market sentiment change, should find out within next few days.
Level to watch 3916 --- 3914
Reports to watch:
US:EIA Natural Gas Report
10:30 AM ET
US:EIA Petroleum Status Report
11:00 AM ET

Long for irctc levelsBuy Whenever Take bounce from this line long term targets above 820
entry 630 (safe entry above close 680)

BTC Analysis and Key Levels to WatchBYBIT:BTCUSD.P
As traders, we must always start our analysis with higher-term timeframe ranges. Recently, we saw the price break to the upside, and currently, it is testing the value area low of the previous range. The horizontal fib 0.618 from the high to the current low acts as a resistance.
If we zoom in on the lower-term time frame, we can see that we are forming a range that started on Friday and continued over the weekend. A fixed range tool gives us significant levels ranging between 20700- 21250, which is almost a 4% range. This should be our main trading idea.
Yesterday, we saw a push to the downside, which touched the value area low of the range, a swing failure pattern of the previous low, and followed with a nice buyback. The price started to claim the point of control and daily VWAP, and after some consolidation near VWAP, the price started pushing toward the top of the range, where we got another swing failure. After getting accepted back from the SFP level price continues ranging.
However, sooner or later, we all know this range will break to either upside or downside. As a trader, we need levels, both to the upside to back up the bullish scenario and to the downside for the bearish scenario. At this point in time, I expect more upside price action. On the upside, we have the NSPOC (Naked Session Point of Control) level at 21725, the weekly level, the fib level 0.618, and the previous range VAH (Volume area high) level around 21827.5.
But if the price breaks to the downside, we have a little consolidation around the 18375-18850 area; we do have VAL of the previous range along with the last support area. So we can expect a reaction here. But if the momentum is strong, then we can expect lower. We have daily naked points of control at $17,725 and $17450, along with 0.618 fib level around $17,550. I will expect some reaction here.
In conclusion, it's crucial to constantly keep an eye on critical levels such as Current range volume areas and horizontal fib levels, as they can be important in determining the market's direction. Always have a plan and be prepared for bullish and bearish scenarios. Happy trading!

LONG CADCHFTrading is reactive and not predictive.
My view on cadchf is currently bullishing.
Please follow your strategy,This is just my idea,and I will be glad to see your Ideas in this post.
Please don not forget the like button and share with your friend,thanks and trade safe.

SHORT EURAUD BASED ON TECHNICAL VIEW started from december 20th the price broke the lower high,and started forming higher low and lower lows that indicates the bears are in control(based on 4HR Timeframe).
Currently the price is also below 50ema and 200ema that act as dynamic support.
At Around 1.56000 there is multiple Wick rejections it seems as the strong flipzone RESISTANCE.
If to go short levels to watch has TP are TP1 1.55000,TP2 1.54500 and TP3 1.54000
Dont forget to put stop loss for your positions,
Please follow your strategy,This isjust my idea,and I will be glad to see your Ideas in this post.
please don not forget the like button and share with your friend,thanks and trade safe.

Bitcoin-TA-2023 Short Term AnalysisHello everyone, hope you all are doing good,
Not Financial Advice though.
It was a massive pump to 21300 something as i said in my yearly and other Bitcoin Analysis that Bitcoin will definitely test 30k zone somewhere in Q2/Q3-2023.,
So What next??? lets check the possibilities what will happen.
In chart i explained the 2 possibilities mostly can play out.
Possibility1: Reverse Head n Shoulders Pattern
pullBack = 18800k roughly
target = 29k roughly.
(Orange color)
Possibility2: If this move is failed move,
than target = 14700 roughly
(Red color)
I mostly expecting Bitcoin to move in upside direction with in this year 2023.
Thank you, stay safe and stay smart.

GBPUSD (Cable) H4 Reversal likely here if this HappenGBPUSD, the cable is finding resistance at a price range of 1.19428 to 1.19140, as highlighted in our previously shared idea.
We anticipate that the GBPUSD pair will reverse at the critical support level. See the chart image for clarity.
The market is expecting some volatility later today due to the ISM Manufacturing PMI, JOLTS Job Openings, and FOMC Meeting Minutes reports. The details of these reports will determine to a very large extent if the support levels at 1.19428 and 1.19140 will hold or not.
Let's keep our fingers crossed. Please like this idea to help reach others and also follow me for support.
Many thanks for your time, and I hope to report back soon.

Took a long position on GBPAUDSaw the 1.75200 Support zone and have taken a long position. Waiting to see if price will get to the 1.82050 Resistance area. Downside would be if price were to break that support and push lower.
Let me know your thoughts and analysis!
Thank you!

Bulls and Bears zone for 01-11-2023It seems of late market sells off than rallies without any conviction.
Is today going to be different or same. Any test of ETH session High could provide direction.
Level to watch 3953 --- 3951
Report to watch:
US:EIA Petroleum Status Report
10:30 AM ET

Cardano - ADA Bullish ideaCardano enters a verticalization proving how strong and stable it is by losing only a 7% meanwhile BTC is down more than 10%
ADA is creating higher highs and higher lows - BULLISH signal
MACD just created a death cross on the EMA not looking very good - BEARISH signal
RSI looking fine, just above the 50 NEUTRAL signal
I think that cardano is going lo retest the supports (red line on chart) at that point is going to be ready for a new ATH
I am buying ADA in a price range from 1.40$ - 1.50$

$OP - Ranging inside the Symmetrical TriangleHello my Fellow TraderZ,
#Optimism $OP is looking on the 4 HTF.
Price has been ranging inside the Symmetrical Triangle for 2 months and I'm soon expecting a breakout.
I'm kind a bias towards #Bulls only if wee breakout of the Upper TL. But still if you wish to trade then $0.96-1.15 would be a good trading range for quick gains.
Buy zone (yellow circle) is around EMA 50 & 200 and perhaps wee would see bullish cross.
Happy Trading. CHEERS!!!

Going Long On USD CAD Found support zone at 1.34841 as price had bounced off this area previously. I have taken a long position to see if price can get to 1.36723!
If price breaks below the support zone than we can assess that price is probably heading to the down side! Each circle shows where price had previously hit!
Only the future can tell!
Let me know your thoughts!

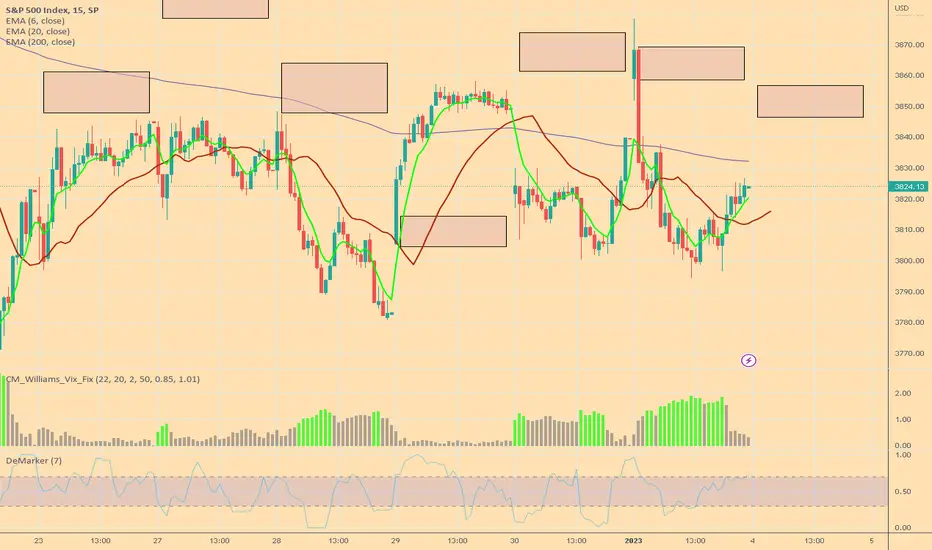
Bulls and Bears zone for 01-04-2023Even-though, ETH session market is trying to rally, but price action suggests otherwise.
Any test of ETH session High could provide direction for the day.
Level to watch 3867 ---3865
Reports to watch:
US:ISM Manufacturing Index
10:00 AM ET
US:JOLTS
10:00 AM ET
US: FOMC Minutes
2:00 PM ET
Does it manage to fail to launch?Solana hit a strong wall, if she can't defeat it, she might be destroyed🥺
