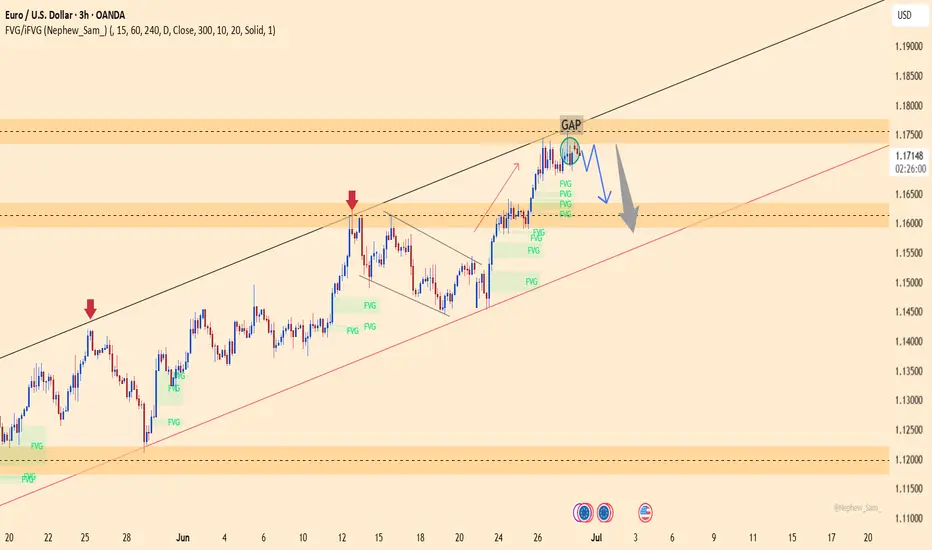
EURUSD – Bearish Pressure IntensifiesEURUSD is currently facing rejection at the GAP resistance area near 1.17350, combined with a lower high structure forming within the ascending channel. Price action shows clear signs of weakness after filling the GAP, and the aligned FVG zones below suggest a potential for deeper downside.
If the price remains capped below 1.17350, there is a high probability of a pullback toward the 1.16300 support area — which aligns with the long-term ascending trendline. A break below this level could extend the bearish move toward the deeper region near 1.14500.
Supporting Fundamentals:
Strong US Core PCE → reinforces expectations that the Fed will keep rates higher for longer.
Weak EU manufacturing PMI → puts pressure on the euro.
FOMC minutes and NFP — if hawkish — could strengthen the USD and weigh further on EURUSD.
Technical Analysis
XAUUSD 15min – Bearish Setup | Short Trade Plan Below 3328Price action on Gold (XAUUSD) is showing signs of exhaustion near the 3,328 resistance zone, where we anticipate potential bearish rejection. A short opportunity may unfold once confirmation occurs below the key structural level of 3316.
Sell Trade Setup:
🔹 Primary Entry (Sell Entry 1):
📍 Zone: Around 3,328.29
📌 Reaction expected near major supply & resistance zone.
🔹 Confirmation Entry (Sell Entry 2):
📍 Below 3,316
📌 Break below structure may trigger bearish momentum.
Targets:
🎯 TP 1: 3,296.97 (Initial reaction zone)
🎯 TP 2: 3,276.64 (Mid support/EMA cross zone)
🎯 TP 3: 3,259.88 (Key structural support)
🎯 Extended TP:
3,243.94 (Re-entry confirmation level)
3,225.53 (Prior base structure)
3,202.45 (Final target if strong momentum follows)
3,159.31 (Ultimate low if sellers dominate trend)
Re-Entry Plan:
🔄 If price retraces after TP 3, watch for rejection at 3,243.94 to re-enter short toward the next levels.
Confluence Factors:
✔ 45° TPC angle supports bearish path
✔ Structure break expected below 3316
✔ EMA resistance and trendline rejection from upper zone
✔ Volatility cluster observed near 3,328 – ideal for trap setup
Bias:
Bearish below 3,316 – Expecting a downward continuation if structure confirms breakdown.
Author:
📅 1 July 2025
📊 Chart: XAUUSD – 15min
🧠 Shared by: @THEPATELCRYPTO

[INTRADAY] #BANKNIFTY PE & CE Levels(01/07/2025)Bank Nifty is expected to open slightly gap up near the 57,450 level, which lies close to an important resistance zone. If the index manages to sustain above this level, a further upside movement may be seen toward 57,750, 57,850, and 57,950. Strength above 57,500 could indicate bullish momentum continuation and may attract fresh buying interest.
On the flip side, if Bank Nifty fails to hold above the 57,450–57,400 zone and shows signs of reversal, a decline toward 57,250, 57,150, and 57,050 is possible. A breakdown below 56,950 will likely trigger further downside levels toward 56,750, 56,650, and 56,550. It is advised to observe price action around the 57,450–57,500 level for directional clarity in today’s session.

XAUUSD – Technical pullback before a breakout?On the 4H chart, gold is consolidating just below the descending trendline after a correction from $3,389 to the support zone at $3,252. The current price structure suggests continued range-bound movement between $3,252 and $3,318 before a potential breakout. If price breaks above the trendline, the next target could be the resistance zone at $3,389.
From a news perspective, the easing of Iran–Israel tensions has slightly reduced safe-haven demand, putting short-term pressure on gold. However, the US dollar remains at a 3-year low, and concerns over the US government’s $3.3–3.9 trillion tax reform package are fueling fears of a widening deficit—both of which support a bullish outlook for gold.
In summary, watch how price reacts to the trendline. A confirmed breakout could send gold surging toward the $3,389 zone.

Nightly $SPY / $SPX Scenarios for July 1, 2025 🔮 Nightly AMEX:SPY / SP:SPX Scenarios for July 1, 2025 🔮
🌍 Market-Moving News 🌍
📊 Core Inflation Edges Higher
May’s core inflation rose unexpectedly to 2.7% year-over-year, up from 2.6%, casting uncertainty over the Fed’s timeline for rate cuts. While headline CPI sits at 2.3%, the resilience in underlying prices complicates policymakers’ projections for later this year
💵 Weak Dollar, Rising Rate-Cut Bets
Markets are reacting to “summertime data”—like the core CPI uptick—with renewed optimism. Traders now see up to 75 bps in Fed rate cuts later this year, while the dollar remains near 3½-year lows on concerns about Powell’s independence and trade developments
🇨🇦 U.S.–Canada Trade Talks Resume
Trade talks between the U.S. and Canada restarted today, following Ottawa’s suspension of its digital-services tax. Progress toward a broader agreement could reduce tariff risk and offer further relief to risk assets
📊 Key Data Releases & Events 📊
📅 Tuesday, July 1:
All Day – U.S.–Canada Trade Talks
Markets will watch for updates on tariff resolution and broader trade deals. Any breakthrough could notably boost equities and improve trade sentiment.
10:00 AM ET – ISM Manufacturing PMI (June)
A below-50 reading again would reinforce the narrative of industrial weakness. A rebound could support equities and temper recession concerns
10:00 AM ET – JOLTS Job Openings (May)
Still at elevated levels (~7.39 million in April), this metric assesses labor-market resilience. A decline could shift rate-cut expectations.
⚠️ Disclaimer:
This is for educational and informational purposes only. It does not constitute financial advice. Consult a licensed financial advisor before investing.
📌 #trading #stockmarket #economy #news #trendtao #charting #technicalanalysis

Gold Bounces Off Trendline as Bulls Defend Structure Ahead of $3Gold (XAU/USD) has rebounded sharply from its rising trendline support and 50-day SMA (around $3,221), suggesting that the broader bullish trend remains intact despite recent consolidation below the $3,430 resistance.
The uptrend from the December 2024 lows continues to hold, anchored by a sequence of higher lows and a clear ascending trendline. The recent dip toward the trendline was met with firm buying, resulting in a strong bullish candle on the daily chart. Price action now sets up a potential retest of the $3,430 horizontal resistance — a key level that has capped multiple rallies over the past few months.
Momentum indicators paint a mixed but improving picture. The RSI has bounced from just below 40 to 46.64, avoiding oversold territory and hinting at a potential momentum recovery. Meanwhile, the MACD remains in negative territory but is beginning to flatten, signaling a possible shift in short-term momentum.
A confirmed breakout above $3,430 would mark a resumption of the broader bullish leg and expose gold to new highs. However, a breakdown below trendline support would invalidate the current structure and shift focus toward the 200-day SMA near $2,924.
For now, the trendline bounce gives bulls the upper hand, keeping the upside scenario in play.
-MW

AUD/USD Approaches Key Resistance with Bullish Momentum IntactAUD/USD has extended its steady climb and is now challenging the 61.8% Fibonacci retracement level (0.6558) from the July–October 2023 decline. The pair is trading within a rising channel structure and has cleared both the 50-day (0.6457) and 200-day (0.6422) SMAs, confirming a medium-term bullish shift.
Price action remains constructive, with higher lows and rising support from the channel base suggesting consistent demand. A sustained break above the 0.6558 level could open the door toward the 78.6% Fib retracement at 0.6730, a level that also aligns with prior resistance from September 2023.
Momentum indicators support the advance. The RSI is at 61.77 and rising, but still comfortably below overbought levels, implying room for further upside. The MACD is marginally positive and could accelerate higher if price confirms a breakout above the 61.8% Fib barrier.
Traders will be watching whether the pair can hold above the confluence of the SMAs and the lower trendline of the channel. A failure here could expose downside toward 0.6420–0.6450. Otherwise, the bullish structure remains intact, with scope for a continuation higher into July.
-MW

EUR/USD Breakout Eyes 1.18 as Bullish Momentum BuildsEUR/USD has punched through the 78.6% Fibonacci retracement level (1.1744) of the July 2023–October 2023 decline, signaling strong bullish continuation. The breakout above the recent swing high near 1.1576 confirms the uptrend is gaining traction, supported by rising moving averages.
The 50-day SMA has crossed well above the 200-day SMA, maintaining a strong golden cross structure, reinforcing the bullish bias. Momentum indicators support the advance, with the RSI entering overbought territory at 73.79, and the MACD maintaining a positive spread above the signal line — a classic sign of trend strength rather than imminent reversal.
However, the overbought RSI suggests the pair could face some short-term consolidation or a shallow pullback before targeting the psychological 1.18 handle. Bulls would likely view any dip toward the breakout level (1.1576) as a potential buying opportunity.
As long as EUR/USD holds above that support, the path of least resistance remains to the upside, potentially paving the way for a full retracement toward the 1.19–1.20 zone seen last year.
-MW

EUR/AUD Falling Channel Reversal SetupThe EUR/AUD pair is currently trading inside a well-respected falling channel structure on the 15-minute timeframe. Price action has been bouncing between a descending resistance trendline and a sloping support zone, confirming the integrity of the pattern. The pair recently rebounded from the lower boundary of the channel, indicating potential short-term bullish momentum ahead.
This setup highlights a typical channel reversal bounce, offering a high-probability trading opportunity if the pair maintains upward pressure.
📈 Bullish Scenario – Intraday Channel Rebound
The price has touched the support line near 1.7885 and is now climbing higher.
Based on previous cycles, price tends to move from support to resistance within this channel.
A bounce from this level may lead to a move toward the upper channel resistance zone around 1.7960–1.7970.
The blue arrows illustrate the expected zig-zag movement within the channel.
📉 Bearish Scenario – If Support Fails
If the price breaks below 1.7880, it would indicate a channel breakdown, invalidating the bullish setup.
Such a move could lead to fresh downside targets near 1.7850 or lower, continuing the micro downtrend.
🎯 Intraday Trade Plan
Buy Setup (Reversal Play):
Entry: 1.7895–1.7905 (after candle confirmation on support)
SL: Below 1.7875
TP: 1.7950–1.7970 (channel top)
Sell Setup (on rejection or breakdown):
Entry: Near 1.7960 resistance or breakdown below 1.7880
SL: Above 1.7980
TP: 1.7850 and below
🧭 Technical Outlook Summary
Pattern: Falling Channel
Bias: Short-term bullish (reversal from support)
Key Zones: 1.7885 support | 1.7960 resistance
Watch for breakout beyond channel for directional confirmation
=================================================================
Disclosure: I am part of Trade Nation's Influencer program and receive a monthly fee for using their TradingView charts in my analysis.
=================================================================

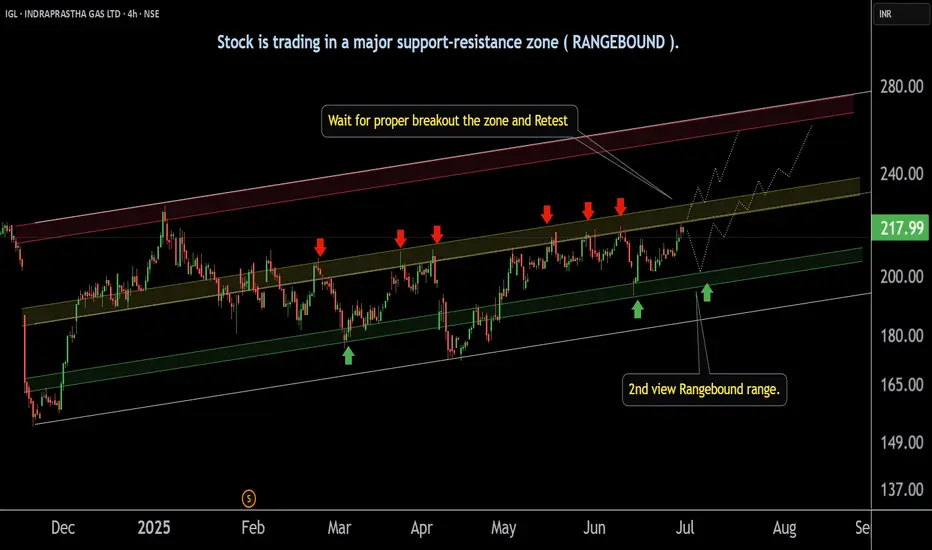
INDRAPRASTHA GAS ' s Support zone | Breakout level |This is the 4 hour chart of INDRAPRASTHA GAS .
IGL is moving in a well defined parallel channel with support range near at 195-200 level.
Igl having good law of polarity at 230 range if Igl give breakout this level and sustain above this level next resistance is near 260 and 280 .
Thank you !!
Apple Consolidates Above $200 with Upside PotentialAAPL is trading sideways, consolidating above $200.0.
Resistance stands at $203.0, and if breached, Apple could rally toward $206.0.

NZDJPY Potential UpsidesHey Traders, in today's trading session we are monitoring NZDJPY for a buying opportunity around 87.250 zone, NZDJPY is trading in an uptrend and currently is in a correction phase in which it is approaching the trend at 87.250 support and resistance area.
Trade safe, Joe.

NZDCAD Potential UpsidesHey Traders, in today's trading session we are monitoring NZDCAD for a buying opportunity around 0.82700 zone, NZDCAD is trading in an uptrend and currently is in a correction phase in which it is approaching the trend at 0.82700 support and resistance area.
Trade safe, Joe.

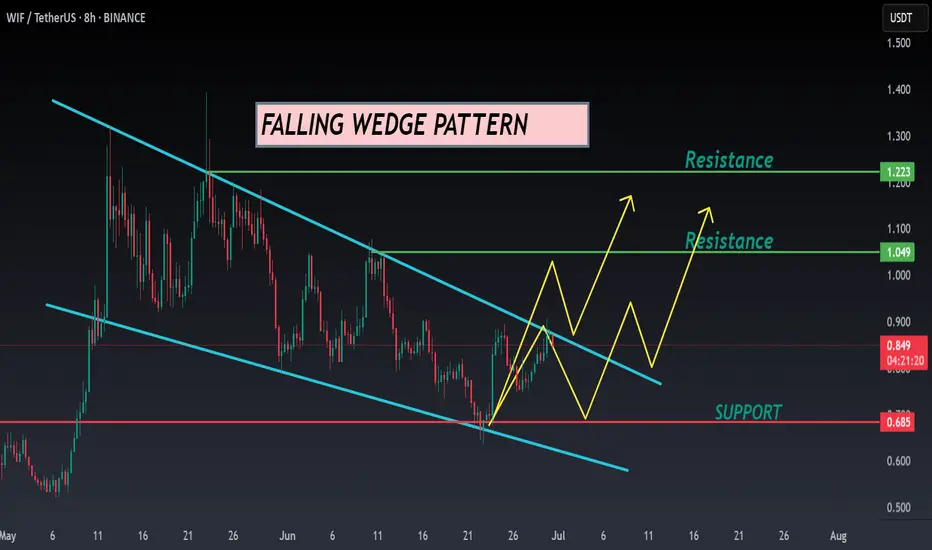
WIF ANALYSIS🔮 #WIF Analysis - Update 🚀🚀
💲 We can see that there is a formation of Falling Wedge Wedge Pattern in #WIF and we can see a bullish movement after a good breakout. Before that we would see a little retest and and then a bullish movement.
💸Current Price -- $0.848
📈Target Price -- $1.049
⁉️ What to do?
- We have marked crucial levels in the chart . We can trade according to the chart and make some profits. 🚀💸
#WIF #Cryptocurrency #Breakout #DYOR
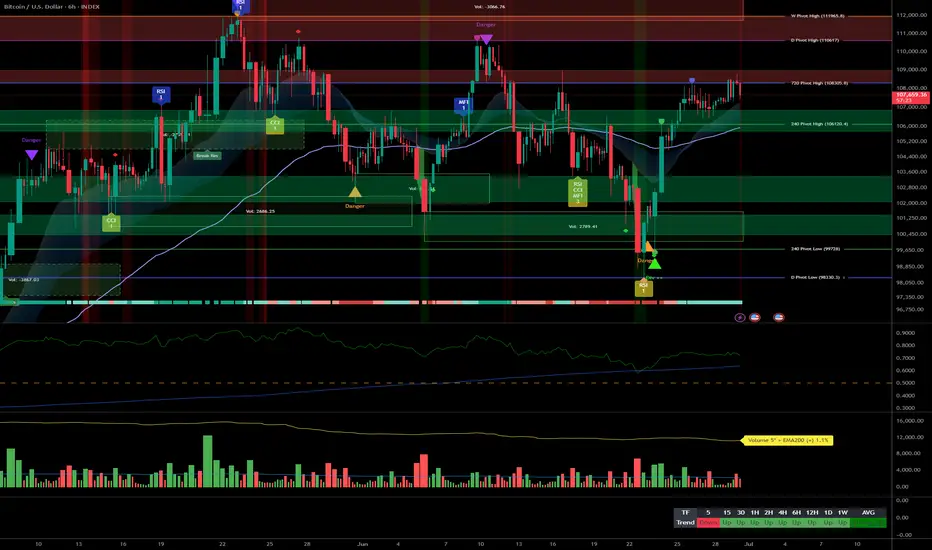
Bitcoin High consolidation, swing opportunities ahead__________________________________________________________________________________
Technical Overview – Summary Points
__________________________________________________________________________________
Momentum : Strongly bullish across all timeframes from 1D to 1H (MTFTI “Strong Up”/“Up”); short-term 15min showing weakness (“Down”).
Key Supports / Resistances :
Major supports: 106k (pivot), 99k–98k (accumulation zone).
Major resistances: 108239–110630, all-time-high zone 111949.
Volumes : Normal on all timeframes except 15min (extreme).
Multi-timeframe behaviour : Healthy consolidation below 108.2k, no signs of panic or buy/sell climax (ISPD DIV neutral). Only 15min shows short-term trap/high volatility risk.
__________________________________________________________________________________
Strategic Summary
__________________________________________________________________________________
Global bias : Dominant bullish structure (1D–4H), high consolidation with risk appetite (Risk On / Risk Off Indicator “strong buy”). Short-term: caution, micro selling pressure on 15min.
Opportunities : Swing entry on pullbacks 106k–104k (invalid if below 103k), confirmed breakout >108.2k = acceleration higher (R:R ~2.5).
Risk zones : Dip below 106k → 104k/99k; extreme 15min volume = fakeout risk; macro triggers (CPI, PMI) may boost volatility.
Macro triggers : Fed decisions, Germany/US CPI, Chicago PMI – all monitored and anticipated, no looming shock seen.
Action plan : Favour swing with tight stops, wait for clear breakout to increase size, limit scalp/intra trading.
__________________________________________________________________________________
Multi-Timeframe Analysis
__________________________________________________________________________________
1D to 4H:
Bias: strongly bullish, no major bearish signals or divergence.
Supports: 106k, 99-98k.
Volumes: under control.
Risk On / Risk Off Indicator: “strong buy”.
Summary: pure bullish structure, opportunities on pullbacks or breakout >108.2k.
2H/1H/30min:
Consolidation below 108.2k resistance, no notable behavioral excess (ISPD DIV neutral), healthy volumes. Price range 107.5k–108.2k.
Swing supports: 106.3k/106k; resistances: 107.5k/108.2k.
15min:
Temporary negative signal: extreme volume, MTFTI “Down”, Risk On / Risk Off Indicator neutralized.
Risk of rapid spike/wick (liquidity), potential fakeout or squeeze before normalization.
__________________________________________________________________________________
Cross-Timeframe Summary & Recommended Action
__________________________________________________________________________________
Higher timeframes perfectly aligned for upside, no reversal signals apart from 15min.
Target the 106k–104k area for swing positioning. Only strong breakout >108.2k is the true catalyst for upward extension.
Short-term: high volumes create trap risk on lower units – be selective.
Risk management: stop-loss recommended below 103k for all bullish strategies.
Healthy market digestion, new macro catalyst required for immediate bullish extension.
__________________________________________________________________________________
Fundamental & Macro Summary
__________________________________________________________________________________
Fed “higher for longer,” US growth soft, strong dollar but no systemic stress.
Bitcoin showing resilience (holds highs despite exogenous volatility).
Risk On / Risk Off Indicator: strong tech leadership, no liquidity or regulatory shocks.
On-chain analysis: no climax or capitulation, digestive momentum.
Macro news: moderately favorable for crypto, neutral for traditional assets.
__________________________________________________________________________________
Opportunities / Risks & R/R Recommendation
__________________________________________________________________________________
Opportunities : Buy pullbacks 106k–104k, validate breakout >108.2k with volume/momentum signals.
Risks : Drop <106k, increased 15min volatility, potential fake breakout on adverse macro data.
Action advice : Favour swing trades over scalping, tight stops below major supports, wait for clear signals.
Final bias : structurally bullish, high consolidation, patience required short-term.
GBP/AUD Falling Wedge Pattern – Reversal or Breakdown?The GBP/AUD pair is currently trading inside a well-defined falling channel on the 15-minute timeframe. The price has been making lower highs and lower lows, respecting both the descending resistance and support trendlines. This setup suggests a short-term bearish structure, but the most recent bounce from the lower boundary raises the possibility of a bullish reversal from support.
🔁 Key Technical Levels
Resistance Zone: Around 2.0995–2.1005 (top of the channel)
Support Zone: Around 2.0930–2.0940 (bottom of the channel)
🔼 Bullish Reversal Scenario
The pair recently bounced strongly from the support zone, indicating buying interest near the channel bottom. If the price breaks above the descending resistance line with a strong bullish candle and follow-through, it would suggest a breakout from the falling channel. That could open upside potential toward 2.1020–2.1050, especially if volume supports the move.
🔽 Bearish Continuation Scenario
If the resistance holds and price starts to fall again, the pair could continue the downward structure, retesting the 2.0940–2.0930 support. A breakdown below that level would confirm a bearish continuation with possible targets near 2.0900 or lower.
🎯 Trade Plan Outline
Buy Setup:
Entry: On confirmed breakout above resistance (~2.1005)
SL: Below 2.0980
TP: 2.1030 / 2.1050
Sell Setup:
Entry: On rejection at resistance or confirmed breakdown below 2.0930
SL: Above 2.1000
TP: 2.0910 / 2.0885
=================================================================
Disclosure: I am part of Trade Nation's Influencer program and receive a monthly fee for using their TradingView charts in my analysis.
=================================================================

NATURAL GAS (NATGASUSD): Bullish Outlook Explained
Natural Gas is trading in a mid-term bullish trend on a daily.
The price updates higher highs and higher lows after each
test of a rising support line.
Its last test made the market form a strong rejection first
and a bullish engulfing candle then.
The market may continue growing and reach at least 3.7 resistance soon.
❤️Please, support my work with like, thank you!❤️

MarketBreakdown | EURUSD, GBPUSD, USDJPY, USDCHF
Here are the updates & outlook for multiple instruments in my watch list.
1️⃣ #EURUSD weekly time frame 🇪🇺🇺🇸
The pair is unstoppable.
The market violated a significant weekly resistance cluster last week.
It opens more growth potential after a pullback.
2️⃣ #GBPUSD weekly time frame 🇬🇧🇺🇸
In comparison to EURUSD, GBPUSD is now approaching a major
resistance area. I think that we can expect a retracement from that.
3️⃣ #USDJPY daily time frame 🇺🇸🇯🇵
The market continues a correctional movement lower.
The closest strong support that I see is based on a rising trend line.
I think that buying interest may spark again after its text.
4️⃣ #USDCHF daily time frame 🇺🇸🇨🇭
The price updated a historic low on Friday.
The next strong support that I see is based on a falling trend line.
We can expect a pullback from that.
Do you agree with my market breakdown?
❤️Please, support my work with like, thank you!❤️
I am part of Trade Nation's Influencer program and receive a monthly fee for using their TradingView charts in my analysis.

S&P500 INDEX (US500): New ATH & More Growth
S&P500 index updated the all-time high on Friday.
The market successfully broke and closed above an underlined resistance.
More growth is coming and the index is going to reach 6280 level soon.
❤️Please, support my work with like, thank you!❤️

30/06 WILL WE SEE A RECOVERY ON THE LAST DAY OF THE MONTH? ↗️GOLD PLAN – 30/06: WILL WE SEE A RECOVERY ON THE LAST DAY OF THE MONTH? ☄️
✅ Macro Context – Focus on USD Debt and Political Pressure
Today marks the final trading day of June, and the U.S. faces a $6 trillion debt maturity from Covid-era borrowings, which may impact USD liquidity and market sentiment.
During the Asian session, gold experienced a sharp drop to the 32xx area before bouncing back and is now hovering near last week's close.
While the medium-term structure remains bearish, short-term signals suggest a potential reversal and recovery.
✅Political Catalyst:
→ Trump is pressuring the Federal Reserve to cut interest rates to 1%-2%, stating he won’t appoint anyone unwilling to ease policy.
→ This raises expectations of future rate cuts, which could support gold prices in the near term.
✅ Technical Outlook – Multi-timeframe Structure
On the higher timeframes, gold continues to correct lower.
However, short-term candles are showing recovery momentum, with buyers absorbing around the 327x zone.
Today’s strategy: prioritize short-term BUY setups aligned with the recovery wave.
✔️Key Resistance & Support Levels
🔺Resistance: 3283 – 3291 – 3301 – 3322
🔻Support: 3277 – 3271 – 3259 – 3247
🔖Trade Scenarios
✅Buy Scalping
🔺Entry: 3272 – 3274
🔹SL: 3268
✔️TP: 3282 – 3288 – 3298
✅Buy Zone
🔺Entry: 3249 – 3251
🔹SL: 3244
✔️TP: 3265 – 3282 – 3295 – 3310
💠Sell Scalping
🔺Entry: 3298 – 3300
🔹SL: 3304
✔️TP: 3292 – 3282 – 3270
💠Sell Zone
🔺Entry: 3327 – 3329
🔹SL: 3333
✔️TP: 3322 – 3310 – 3298 – 3282
⚡️ Final Note
As this is the month-end session, expect possible volatility driven by USD flows and institutional rebalancing.

Weekly $SPY / $SPX Scenarios for June 30 – July 3, 2025🔮 Weekly AMEX:SPY / SP:SPX Scenarios for June 30 – July 3, 2025 🔮
🌍 Market-Moving News 🌍
📈 US Stocks Rally to Record Highs
Following a volatile first half, U.S. equities surged into record territory in late June on a combination of easing Middle East tensions, cooling inflation data, and the 90-day tariff pause
💵 Dollar Weakens on Fed and Trade Uncertainty
The U.S. dollar fell to a 3½-year low, pressured by persistent speculations over President Trump replacing Fed Chair Powell and extending rate-cut expectations, as well as progress in U.S.-Canada trade talks
🇨🇦 U.S.–Canada Trade Talks Lift Sentiment
Canada temporarily repealed its digital services tax to facilitate talks seeking a broader trade agreement by July 21, boosting U.S. equity futures
🛢️ Oil Prices Stabilize
After spiking on geopolitical fears, oil traders settled between $65–78/bbl amid supply relief following ceasefire developments and easing Middle East risks
⚠️ July Risks Loom
The coming week will spotlight:
July 4 deadline for Trump’s tax bill
Expiry of the tariff pause on July 9
U.S. Nonfarm Payrolls on July 3
Each poses potential for increased volatility if outcomes disappoint
📊 Key Data Releases & Events 📊
📅 Monday, June 30
9:45 AM ET – Chicago PMI (June): Gauge of Midwestern factory activity
📅 Tuesday, July 1
U.S. markets open, watch trade developments
📅 Wednesday, July 2
Global PMI readings released
📅 Thursday, July 3 (Early close ahead of Independence Day)
8:30 AM ET – Nonfarm Payrolls (June)
8:30 AM ET – Unemployment Rate (June)
8:30 AM ET – Average Hourly Earnings (June)
These labor metrics will be critical for Fed rate outlooking
⚠️ Disclaimer:
This information is for educational and informational purposes only and should not be construed as financial advice. Always consult a licensed financial advisor before making investment decisions.
📌 #trading #stockmarket #economy #jobs #Fed #oil #trade #technicalanalysis

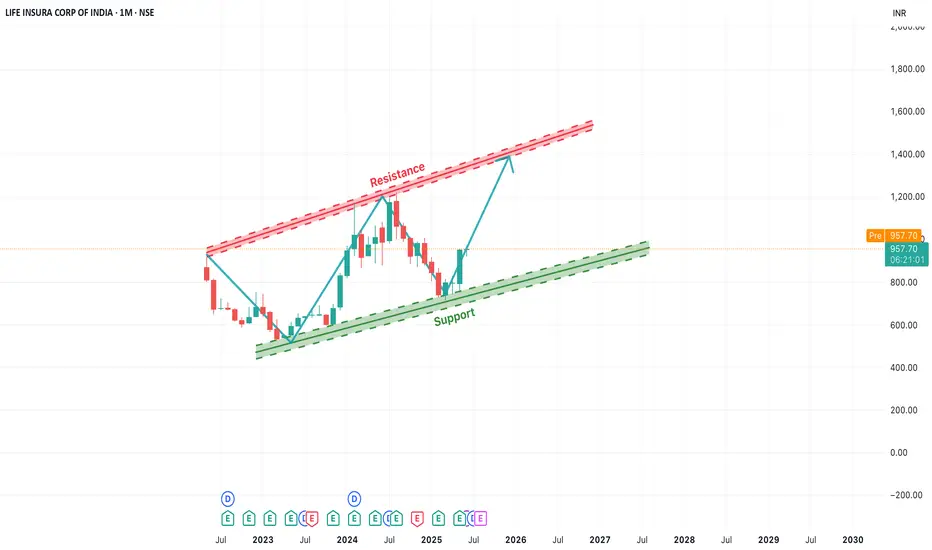
[Long-Term]LICI Rising Channel Pattern Indicates Bullish OutlookIn this monthly chart of LICI, we observe a clear ascending channel pattern forming over the past two years. The price has consistently respected both the support and resistance trendlines, creating a strong bullish structure.
Currently, the stock is bouncing off the lower support trendline, indicating a potential upward move towards the upper resistance zone. This offers a positive long-term outlook, especially if the momentum sustains. The key levels to watch are:
Support Zone: Around ₹850–₹900
Resistance Zone: ₹1250–₹1300
Traders and investors can monitor for a gradual rise toward the resistance level. A breakout beyond this channel may open up new highs, while a breakdown below the support trendline would invalidate the pattern.
USD/JPY Consolidation Triangle – Breakout WatchThe USD/JPY pair is currently trading inside a well-formed symmetrical triangle pattern on the daily chart. This structure typically forms when the market is in a phase of consolidation, with neither buyers nor sellers able to break the range. Price is compressing between a horizontal resistance zone (~146.50) and a rising support line (~143.50), indicating that a breakout in either direction may be imminent.
This triangle has formed after a sharp downtrend, followed by a broad base formation. Such setups often precede a decisive move, especially if accompanied by volume.
🔼 Upside Breakout Scenario
If price breaks and closes above the resistance zone (above 146.50–147.00) with bullish confirmation, we can expect momentum to shift in favor of buyers. A confirmed breakout would open the path toward 150.00+, possibly even retesting the highs of 2024 near 152.00. This would be seen as a bullish reversal after a prolonged downtrend.
🔽 Downside Breakdown Scenario
Alternatively, if price fails to hold the rising trendline and breaks below the 143.00–142.50 support zone, it may confirm a bearish breakdown. This would suggest a continuation of the earlier downtrend with fresh bearish momentum targeting 140.00 and lower levels.
🧭 Trade Strategy Consideration
Bullish Plan: Buy breakout above 147.00 with SL below 145.50 and TP near 150.50–152.00
Bearish Plan: Sell breakdown below 142.50 with SL above 144.00 and TP near 140.00–138.00
Neutral Bias: Wait for breakout confirmation; no trade inside the triangle
This is a tight volatility setup where breakout traders should stay alert. The longer the consolidation, the stronger the breakout move tends to be.
=================================================================
Disclosure: I am part of Trade Nation's Influencer program and receive a monthly fee for using their TradingView charts in my analysis.
=================================================================
