[INTRADAY] #BANKNIFTY PE & CE Levels(30/06/2025)Bank Nifty is expected to open on a flat note near the 57,400 zone, with price action currently hovering around a key resistance level of 57,450. If Bank Nifty sustains and breaks above this resistance zone of 57,450–57,500, a bullish breakout is likely. Traders can consider buying CE options in the 57,550–57,600 range with potential targets at 57,750, 57,850, and 57,950+. This move would signal continued upward momentum in the index.
However, if the price faces rejection from this resistance and slips below 57,450, a short-term reversal is possible. In that case, traders may look for PE opportunities in the 57,400–57,450 zone with targets at 57,250, 57,150, and 57,050. The lower support level remains around 57,050, which should act as a key zone for reversal or bounce-back scenarios.
Technical Analysis

XAUUSD 4H Analysis – Possible Break Below Key StructureStructure Overview:
After printing a multi-month high around 3,473, price has formed a clear rounded top followed by lower highs, showing weakening bullish momentum. Gold is now retesting a key structure zone near 3,270–3,275, which has acted as previous support several times.
📉 Key Technical Observations:
Trend: Short-term bearish within a broader consolidation
Support Zone: 3,270–3,250 (watch closely for a break)
Resistance Levels:
Minor: 3,340
Major: 3,390–3,400
📊 Scenario Outlook
🔻 Bearish Bias (Preferred Scenario)
If price closes below 3,270, expect:
Initial target: 3,210–3,220 zone (clean imbalance + previous resistance)
Secondary target: 3,130–3,150 (March structure break zone)
This would confirm a transition into a mid-term bearish leg unless a fakeout occurs.
🔺 Bullish Recovery (Alternative Scenario)
If price reclaims 3,305 with strength:
A move back toward 3,340–3,360 is possible
Needs volume + momentum confirmation, ideally with a bullish engulfing candle
⚠️ What to Watch
Daily candle close relative to 3,270
Reaction at 3,250–3,260 demand zone
Gold often sweeps key lows before reversing — watch for liquidity grab wicks
📌 Conclusion
Gold is sitting at a critical level — a confirmed close below 3,270 could open the doors for a deeper retracement toward March’s breakout levels. Until then, this remains a watch and react environment. Avoid chasing.

+266% in ONE DAY from $1.30 to $4.75 $RCT🔥 +266% in ONE DAY from $1.30 to $4.76 🚀
Spotted the setup early, but my official safety criteria checklist wasn't all green due to price action until later when it was too late NASDAQ:RCT
Sometimes discipline keeps you out early on even when the move goes wild

Bitcoin Offensive plan for S/R, risk-on scenario confirmed__________________________________________________________________________________
Technical Overview – Summary Points
__________________________________________________________________________________
Momentum : Strong across all timeframes, driven by the Risk On / Risk Off Indicator (“Strong Buy” bias from 1D to 1H).
Key Supports : 98–100k remains the crucial zone to defend. Interim supports at 103.6k and 106k.
Major Resistances : 107–110k critical cluster, intermediate resistance at 108.2k.
Volume : Normal to moderately increasing volumes on all timeframes, short-term spike at 15min (caution warranted).
Multi-TF behavior : No signs of euphoria or capitulation except for 15min (behavioral overheating & high volume detected).
__________________________________________________________________________________
Strategic Summary
__________________________________________________________________________________
Structural bias : Strong bullish, confirmed by technical and sector data.
Opportunities : Pullback entries at 107–107.5k, trend-following plans on validated breakouts >108.2k/109.9k.
Risk zone : Major break under 106k then 103.6k = invalidation, watch for seller excess (ISPD)/extreme volume on 15min.
Macro catalyst : No major event expected; wait & see climate, caution around Middle East geopolitical headlines.
Action plan : Buy support, monitor breakout/volume, stop-loss below 106k then 99k.
__________________________________________________________________________________
Multi-Timeframe Analysis
__________________________________________________________________________________
1D – 12H – 6H : Durable bullish structure, price capped below 107–110k, momentum confirmed by Risk On / Risk Off Indicator (“Strong Buy”), no volume climax, healthy volume. 98–100k supports remain crucial.
4H – 2H – 1H – 30min : Aligned uptrend, no sell signals. Pullbacks absorbed at 103.6–107.5k pivots. 108.2k–109.9k breakout is pivotal, volumes healthy outside 15min.
15min : Emerging behavioral excess (ISPD = Sell), very high volume → risk of short-term overheat, avoid chasing without validation.
Summary : Bullish multi-timeframe confluence, but caution on ultra-short-term excess and geopolitical news flow.
__________________________________________________________________________________
Synthesis & Strategic Plan
__________________________________________________________________________________
Directional bias : Structurally bullish on all higher TFs, supported by Risk On / Risk Off Indicator, MTFTI, no major alert signals.
Action scenarios :
Buy pullback at 107–107.5k, SL below 106k (Swings) or below 107k (Scalps).
Confirmed breakout (vol./no behavioral excess) above 108.2–109.9k, targets >110k.
Risk/invalidation : Any break under 106k then 103.6k then 99k = bullish bias neutralized.
Risk management : Take partial profits on 109–110k extensions; avoid persistence if ISPD turns red & volumes spike on lower TFs.
Fundamental & on-chain factors : No macro catalyst, healthy consolidation, $99k–$100k on-chain supports decisive, breakout requires new inflows.
Decision summary:
Bias = Bullish, buy supports and validate breakouts with volume, watch for 15min excess and Middle East headlines. Strict SL below 106k/103.6k, risk-off below 99k. Partial profit taking on 109–110k extension. No immediate macro catalyst.

USDJPY Potential UpsidesHey Traders, in tomorrow's trading we are monitoring USDJPY for a buying opportunity around 144.400 zone, USDJPY is trading in an uptrend and currently is in a correction phase in which it is approaching the trend at 144.400 support and resistance area.
Trade safe, Joe.

EURUSD: Support & Resistance Analysis for Next Week 🇪🇺🇺🇸
Here is my latest structure analysis
and important supports & resistances for EURUSD for next week.
Consider these structures for pullback/breakout trading.
❤️Please, support my work with like, thank you!❤️
I am part of Trade Nation's Influencer program and receive a monthly fee for using their TradingView charts in my analysis.

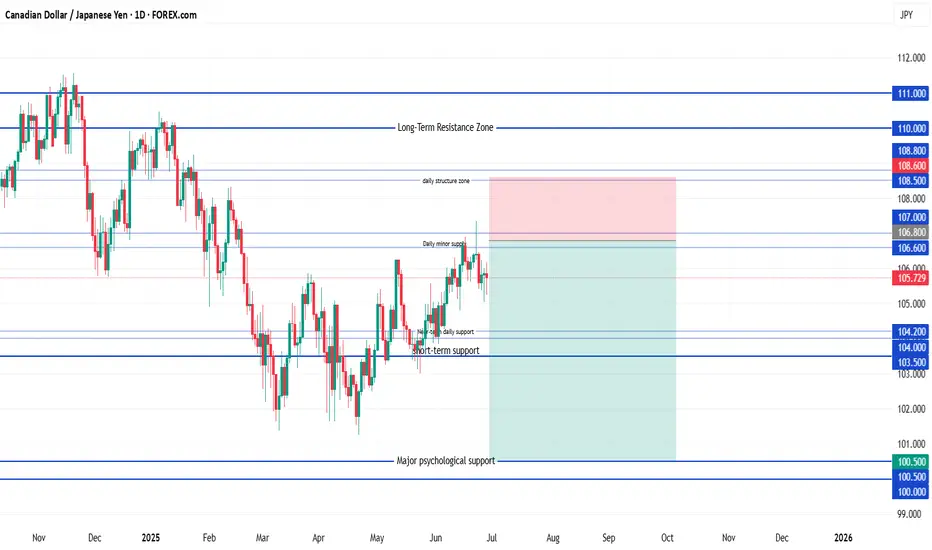
CAD/JPY ShortSell Limit Entry: 106.80
(Just under the resistance trap zone: 106.60–107.00)
Stop Loss: 108.60
Target 1: 104.20
(First minor support zone)
Target 2: 103.00
(Deeper support + recent structure base)
Target 3 (Optional hold): 100.50
(Long-term structural support zone)
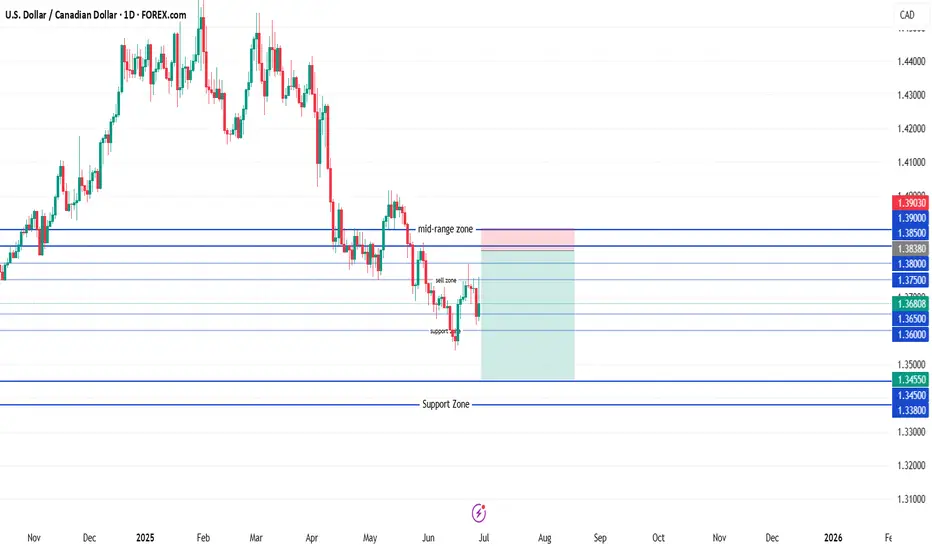
USD/CAD ShortSell-limit order: 1.3838
Stop-loss: 1.3903
Target 1: 1.3705
Target 2: 1.3605
Target 3 (optional runner): 1.3455
Place the limit at 1.3838 and keep the stop above 1.3900; scale out at the listed targets as price moves in your favor.
Brent Oil – Bearish Break or Bounce from Long-Term Support?Brent Oil is hovering just above critical support near 66.00, with a clear bearish structure visible across timeframes:
🔎 15m & 1h:
Price action is consolidating near the ascending support trendline drawn from early June lows. Short-term price structure shows lower highs and lower lows, suggesting continued downside pressure.
📉 4h & 1D:
The recent sell-off from above 78.00 has pushed Brent back into the lower region of the broad descending channel. Daily and 4h charts show price testing confluence between the horizontal support at ~66.00 and a long-term rising trendline. A confirmed close below this level could accelerate bearish momentum towards 64.00 or even 62.00.
⚠️ Key Levels:
• Support: 66.00, 64.00, 62.00
• Resistance: 67.00, 69.00
• Bias: Bearish – price remains in a clear downtrend unless buyers reclaim above 67.50 with strong volume.
📌 Outlook:
As long as Brent holds below 67.00 and the descending trendline caps rallies, my bias is bearish. A breakdown of 66.00 on higher timeframes would open the door for a move towards lower channel support levels. However, if buyers defend and push back above 67.50, we could see a short-term relief rally.

USDJPY Potential DownsidesHey Traders, in today's trading session we are monitoring USDJPY for a selling opportunity around 146.700 zone, USDJPY is trading in a downtrend and currently is in a correction phase in which it is approaching the trend at 146.700 support and resistance area.
Trade safe, Joe.

S&P500 Potential UpsidesHey Traders, in today's trading session we are monitoring US500 for a buying opportunity around 6,075 zone, S&P500 is trading in an uptrend and currently is in a correction phase in which it is approaching the trend at 6,075 support and resistance area.
Trade safe, Joe.

NASDAQ Potential UpsidesHey Traders, in today's trading session we are monitoring NAS100 for a buying opportunity around 22,380 zone, NASDAQ is trading in an uptrend and currently is in a correction phase in which it is approaching the trend at 22,380 support and resistance area.
Trade safe, Joe.

Has Bitcoin Topped? Trump’s SBR Impact | Deep Dive Analysis🚨 Has COINBASE:BTCUSD topped? Even with Trump's Bitcoin Strategic Reserve? 🚨
In this deep dive, we analyze COINBASE:BTCUSD major factors that could point to a major reversal or breakout and to uncover whether a market top is forming.
We’ll cover:
Powerful Indicators
Bitcoin / BTC Trends
Price Action
EMA / SMA Trends
Volume Delta
Trend reversal / breakout
Bullish / Bearish / Confirmation from Indicators
order flow analysis
Timeframes (1W, 1D, 1m, 6M etc.)
Bullish and Bearish Sentiment
Strength Candles
👉 Like, comment below, and follow for more pro-level crypto insights.
MartyBoots here , I have been trading for 17 years and sharing my thoughts on COINBASE:BTCUSD .
Whether you're a short-term trader or long-term investor, this post provides the technical insight and edge to help you make better informed decisions.
📉 Stay ahead of the market. Watch the full breakdown and view charts to decide for yourself: Has Bitcoin really topped?
Watch video for more details and below I will show some powerful charts with descriptions.
Warning in near term - LARGE ORDERS
Consolidation in price with large orders above
The Red lines = LARGE ORDERS
Large orders can act as an magnet to price
Large orders can also be support and resistance
Price Above the white 100 moving average
Price strong above it
Price weak below it
Strength Candles
Still Bullish
Multiple timeframes still green
Sentiment Tool Still Bullish
Still Bullish
Multiple timeframes and settings still green
3 Drive Structure
Equal Measured moves
Implies Top Is Not In
Target = $126k
Bullish Engulfing Candle
Implies higher prices to come
👉 Like, comment below, and follow for more pro-level crypto insights.
#Bitcoin #Trump #BTC #CryptoTrading #TechnicalAnalysis #CryptoMarket #BitcoinTop #TradingView #StrategicBitcoinReserve

ATGL: RSI improved significantly, good R:R Stock near a multi-tested support and witnessed a sharp move last week
the momentum indicator RSI indicates strength.
risk reward seems healthy for bulls with enough room for stock to inch higher

DANGSUGAR LONG IDEARecently, the price of DANGSUGAR stock has broken out of a bearish trendline with a strong bullish weekly candle. This shows a strong intention to continue the buying momentum. To take advantage of the long opportunity, you can buy at the current market price while you can also wait for price to drop to N42.95. The stop can be at N37.70 while the target are N47.85 and N63.50 (final target). If this zone should fail, then the next long opportunity will be at N33.50 with a stop at N30.35 based on market structure.
Confluences for the long idea:
1. Trendline and resistance breakout with a strong bullish weekly candle.
2. Strong volume momentum on the volume indicator.
3. Market structure is bullish.
Disclaimer: This is not a financial advice. The outcome maybe different from the projection. Don't take the signal if you're not willing to accept the risk.

FIDELITYBK: HOLD OR SELL?FIDELITYBK is running up towards its target after mitigating a valid demand zone within the discount level at a price of N17.25. If you have this stock in your portfolio, it's a good idea to hold the stock as it has a potential to go as high as N24.95. Although, the weekly swing high is the actual target, which is at a price of N21.55. Afterwhich, a drop in price is anticipated in order to create another long opportunity. Nevertheless, with the market structure being bullish, it's a good idea to ride on the higher prices that can be created in a bullish market.

GBPJPY Potential UpsidesHey Traders, in the coming week we are monitoring GBPJPY for a buying opportunity around 198.100 zone, GBPJPY is trading in an uptrend and currently is in a correction phase in which it is approaching the trend at 198.100 support and resistance area.
Trade safe, Joe.

EURGBP: Bullish Move Ahead! 🇪🇺🇬🇧
EURGBP violated a consolidation range on Friday.
It is an important sign of strength of the buyers and I expect a bullish continuation
next week.
Goal - 0.856
❤️Please, support my work with like, thank you!❤️
I am part of Trade Nation's Influencer program and receive a monthly fee for using their TradingView charts in my analysis.

XAUUSD D1 Forecast: Gold at Pivotal 325x Support What's Next for the Yellow Metal?
Today, we're zooming out to examine the broader picture for Gold (XAUUSD) on the Daily (D1) timeframe. Our latest analysis indicates that Gold has encountered a very strong, critical support level around the 325x region. This is a pivotal point that could significantly influence Gold's medium to long-term direction!
🌍 Macroeconomic Landscape: The Underlying Forces Influencing Gold
While we've observed a degree of USD weakness stemming from speculations around the Federal Reserve (such as the rumours regarding Jerome Powell's replacement) and expectations of interest rate cuts, these factors haven't fully countered Gold's recent decline on the daily chart. Furthermore, the sustained ceasefire between Israel and Iran continues to temper Gold's appeal as a safe-haven asset.
Nevertheless, the current price action at the robust 325x support level presents a significant technical signal. The impact of forthcoming US macroeconomic data (particularly the PCE Price Index on Friday) and speeches from FOMC members will be crucial in confirming or negating our projected movements for Gold. Should positive news for Gold align with this support holding, it could act as a potent catalyst.
📊 XAUUSD D1 Technical Analysis: Projecting Gold's Next Move
Given that Gold has reached strong support at 325x, we can anticipate the following scenarios:
Bounce from 325x (Potential Upside Phase):
If the 325x area (which reinforces the 3264.400 support from image_e9d325.png) holds firm, we expect a strong reaction and an upward move for Gold.
The initial target for this bounce would be the 332x region, aligning with resistance levels 3313.737 - 3330.483 from our previous analysis. On a broader timeframe (as illustrated in image_83845c.png), this corresponds to the resistance zone around 3326.022. This 332x area might represent a continuation pattern, suggesting it could be a corrective rally before the resumption of the larger trend.
Resumption of Downtrend (After Reaching 332x):
Once Gold reaches and tests the 332x zone (3313.737 - 3330.483 / 3326.022) and exhibits bearish confirmation signals (e.g., a strong bearish engulfing candle, a pin bar, or a clear top formation), we anticipate a resumption of the downward movement.
The next major target for this decline would be the 317x area, which correlates well with the strong support at 3173.052 on the larger timeframe (as depicted in image_83845c.png).
🎯 XAUUSD D1 Trading Plan: Your Long-Term Strategy Ahead!
Considering the current D1 analysis, here's our actionable plan:
1. BUY PHASE (Bounce from Support):
Entry: Observe price reaction in the 325x - 326x zone (specifically 3264.400). Only consider buying if there are clear bullish confirmations (e.g., a confirmed bullish pattern on the daily or 4-hour candle, a strong bounce from the zone with significant volume).
SL (Stop Loss): Position just below the 325x support zone (e.g., 3245-3240, depending on confirmation).
TP (Take Profit): 3280 - 3284 - 3290 - 3295 - 3300 - 3305 - 3310 - 3313.737 - 3320 - 3326.022 (key 332x zone). This will be our primary target for the potential bounce.
2. SELL PHASE (Downtrend Resumption):
Entry: Once the price reaches and tests the 332x zone (3313.737 - 3330.483 / 3326.022) and shows bearish confirmation signals (e.g., a strong bearish engulfing, pin bar, or clear top formation).
SL (Stop Loss): Position slightly above the 332x zone (e.g., 3335-3340).
TP (Take Profit): 3326 - 3320 - 3316 - 3310 - 3305 - 3300 - 3295 - 3290 - 3280 - 3200 - 3173.052 (final 317x target).

Jio Financials Inverse Head & ShoulderThere is a developing pattern on the charts of Jio Financials.
The levels are marked clearly.
This is to spread awareness and pass my technical analysis learnings.
Conduct your own research before taking any financial decision.

HNST: When honesty turns into a breakout formationOn the weekly chart, The Honest Company (HNST) is shaping a textbook broadening formation. Four waves are already in place, and the fifth is unfolding. The recent bounce came exactly after a retest of the long-term trendline at point (4), pushing the price above the critical $4.97 resistance (0.236 Fibo) — a clear signal that buyers are reclaiming control.
Volume is steadily rising, and the golden cross (MA50 crossing above MA200) further confirms a mid-term trend shift. The volume profile above current prices is nearly empty — indicating minimal resistance. Immediate targets are $6.33 and $6.94 (0.5 and 0.618 Fibo), while the full breakout projection lands at $8.91, $10.31, and even $12.09 (based on 1.0, 1.272, and 1.618 expansions).
Fundamentals (as of June 28, 2025):
— Market Cap: ~$460M
— Revenue (TTM): ~$344M
— YoY Revenue Growth: +7.6%
— EPS: –0.18 (loss narrowing)
— Cash on hand: ~$24M
— Debt: under $10M
— P/S ratio: 1.34
Despite being unprofitable, HNST is showing strong signs of operational improvement — rising gross margins, controlled costs, and increasing leverage. Growth in both online and retail sales adds further support. With institutional buying picking up, the market may be slowly re-rating this small-cap FMCG player.
Trade Plan:
— Entry: by market
— Targets: $6.33 → $8.91 → up to $12.09
When even an "honest" stock starts drawing broadening patterns and volume’s rising — it’s not a hint, it’s a launch sequence. And the bears? Might want to take a seat in the back.

XAU/USD (Gold) Breakout or Breakdown Setup – Key Decision ZoneThe Gold Spot (XAU/USD) price action is currently at a crucial inflection point after consolidating in a rising wedge pattern between ascending support and horizontal resistance. This type of structure typically indicates a strong directional breakout is likely, and the current daily candle shows a close below the ascending support, signaling a potential bearish breakdown confirmation.
🔽 Bearish Breakdown Scenario (Confirmed Below 3250)
If price sustains below the 3250 support breakdown level, it confirms a bearish breakdown from the wedge. The height of the wedge (distance between the base of the move and the resistance) is used to project the downside target, giving us key levels to monitor:
Breakdown Confirmation: Below 3250.00
Target 1: 3111.67
Target 2: 2990.31
Projected Downside Target: 2861.24
This move suggests that gold could enter a deeper correction if buyers fail to reclaim the ascending structure quickly.
🔼 Bullish Breakout Scenario (Above 3500)
On the flip side, if bulls manage to push price back above the 3500 level, it would invalidate the current bearish momentum and confirm a bullish breakout. The projected upside targets are based on the same measured move logic:
Breakout Confirmation: Above 3500.00
Target 1: 3621.90
Target 2: 3741.84
Projected Upside Target: 3855.78
A close above 3500 with volume would set the tone for a fresh rally toward new highs.
🧭 Strategy Outlook
Short Bias (active): Entry below 3250; SL above 3300; TP at 3110 / 2990 / 2860
Long Bias (if reversal): Entry above 3500; SL below 3460; TP at 3620 / 3740 / 3850
Always wait for a strong daily candle close beyond the breakout/breakdown levels before initiating any trades
=================================================================
Disclosure: I am part of Trade Nation's Influencer program and receive a monthly fee for using their TradingView charts in my analysis.
=================================================================

Strong Stock!FFL
Closed at 15.22 (27-06-2025)
Sustaining 13.81 on Monthly basis
would be a healthy sign.
Also Monthly Closing above 16.12
would be a very positive sign.
On the flip side, 12 - 14 may act
as a Good Support zone.
Upside targets can be 19 - 20
& then 22 - 23 initially.
