SOl on Resistance level. If this area is broken and retested I will buy otherwise will wait to buy the low around 126$
Technical Analysis

AUDUSD Potential UpsidesHey Traders, in today's trading session we are monitoring AUDUSD for a buying opportunity around 0.63800 zone, AUDUSD is trading in an uptrend and currently is in a correction phase in which it is approaching the trend at 0.63800 support and resistance area.
Trade safe, Joe.

EURUSD – Signs of Weakness, Risk of Trendline BreakEURUSD is showing signs of weakness after a strong rejection at the 1.16300 resistance zone — a level that previously acted as a distribution area. Despite a brief rebound driven by mixed PMI data, the Euro failed to maintain its momentum and is now turning lower.
If price breaks below the support zone around 1.15400 — which aligns with both the trendline and an old FVG — a deeper decline toward the 1.15000 level could be triggered. Continued failure to surpass the 1.16300 resistance would further strengthen the corrective pressure.
On the fundamental side, expectations for the ECB to hold rates steady and weaker-than-expected Eurozone data are dampening the Euro’s outlook. Meanwhile, the US Dollar remains firm on safe-haven demand, with upcoming US GDP and Core PCE data likely to drive short-term direction.

Nightly $SPY / $SPX Scenarios for June 26, 2025🔮 Nightly AMEX:SPY / SP:SPX Scenarios for June 26, 2025 🔮
🌍 Market-Moving News 🌍
💱 Dollar Mounts Decline on Fed Credibility Concerns
The U.S. dollar dropped to a 3½-year low against the euro after reports that President Trump is considering replacing Fed Chair Powell as early as September or October. The move fueled market concern about the Fed’s independence and prompted traders to raise the likelihood of a July rate cut to 25%, with nearly 64 bps of rate cuts priced in by year-end
📉 Markets Stay Cautious Ahead of Powell’s Testimony
Traders remain on edge as Fed Chair Powell’s Capitol Hill testimony continues. He reiterated caution, noting inflation risks tied to tariffs despite growing calls for easing, keeping interest-rate expectations in limbo .
📈 S&P 500 Nears All-Time Highs in Second-Biggest Bi‑Monthly Rally
The S&P 500 has notched its second-largest May–June rally on record (6.2% in May, further gains in June), bolstered by cooling inflation, easing Middle East tensions, and strong AI earnings momentum led by Nvidia. Bull-case scenarios could push the index to fresh highs
📊 Key Data Releases 📊
📅 Thursday, June 26:
(No major U.S. economic release—markets are focused on Powell’s remaining testimony and global risk dynamics.)
⚠️ Disclaimer:
This information is for educational and informational purposes only and should not be construed as financial advice. Always consult a licensed financial advisor before making investment decisions.
📌 #trading #stockmarket #economy #Fed #inflation #geopolitics #technicalanalysis

#NIFTY Intraday Support and Resistance Levels - 26/06/2025Nifty is set to open slightly gap up today near the 25,250 mark, signaling a continuation of the ongoing consolidation phase. The market has been hovering around this zone for the past couple of sessions, making it a key inflection point. A sustained move above 25,300 can trigger bullish momentum, leading to targets of 25,350, 25,400, and 25,450+. This level also coincides with previous intraday highs, making it a potential breakout zone for aggressive buyers.
On the flip side, if Nifty faces rejection from this resistance zone and slips below the 25,250–25,200 levels, a downside move could emerge. In that case, short positions can be considered with immediate support levels at 25,150, 25,100, and 25,050. The opening hour will be crucial—traders should monitor for either a breakout above 25,300 or a breakdown below 25,200 to determine intraday direction. Volatility may increase due to expiry, so a wait-and-watch approach with tight stop-losses is advisable.

EURUSD Breakout and Potential RetraceHey Traders, in today's trading session we are monitoring EURUSD for a buying opportunity around 1.15700 zone, EURUSD was trading in a downtrend and successfully managed to break it out. Currently is in a correction phase in which it is approaching the retrace area at 1.15700 support and resistance area.
Trade safe, Joe.

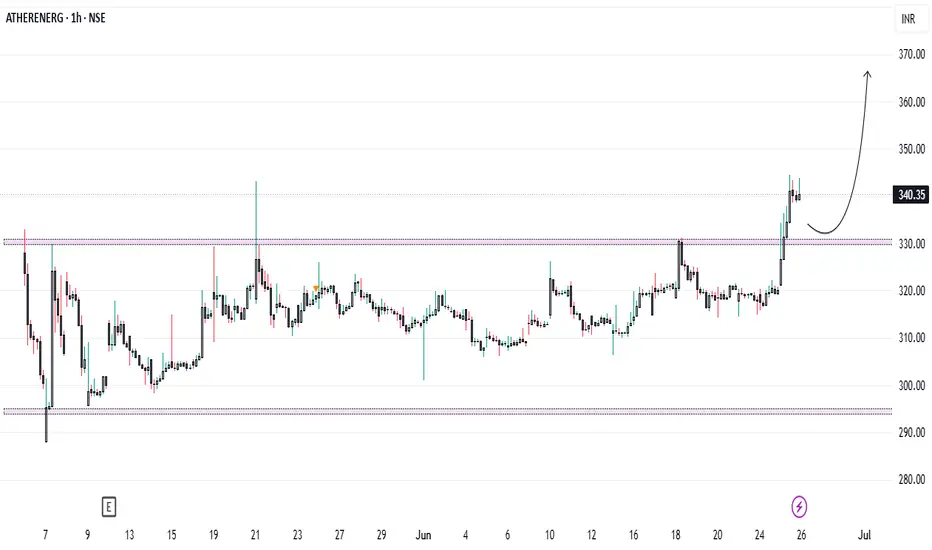
Ather’s Affordable EV Announcement Triggers Market Rally...Technical Analysis:
Ather Energy has successfully broken above the key resistance level of ₹330 and is currently trading around ₹340. This breakout is supported by a noticeable surge in volume, confirming bullish momentum. The ₹330 level, which previously acted as a strong resistance, may now serve as a potential support in the event of a retest. Traders and investors can look for buying opportunities on dips near ₹330, while those already holding the stock are advised to continue holding for further upside.
Fundamental Analysis:
From a fundamental standpoint, Ather’s maiden quarterly results have been encouraging. The company reported a one-third increase in revenue, while its EBITDA loss narrowed to ₹172 crore, down from ₹239 crore in the same quarter last year. This marks a significant step towards operational efficiency and profitability.
Adding to the positive sentiment, Ather recently announced that it will unveil its new EL EV platform and upcoming concept models in August 2025. The highlight of this announcement is that the new scooter will be Ather’s most affordable offering, signaling a strategic push to expand market penetration and compete in the mass segment of the EV market.
Conclusion:
The breakout at ₹330, supported by improving financial performance and strong product pipeline news, suggests a bullish outlook for Ather Energy in the near term. Investors should monitor the ₹330 level for price retest and accumulation opportunities. Holding is recommended for existing investors, while fresh entries can be considered on technical confirmation around support zones.
Note: Due to ongoing global uncertainties, market conditions may remain volatile. Investors are advised to exercise caution and manage risk accordingly.
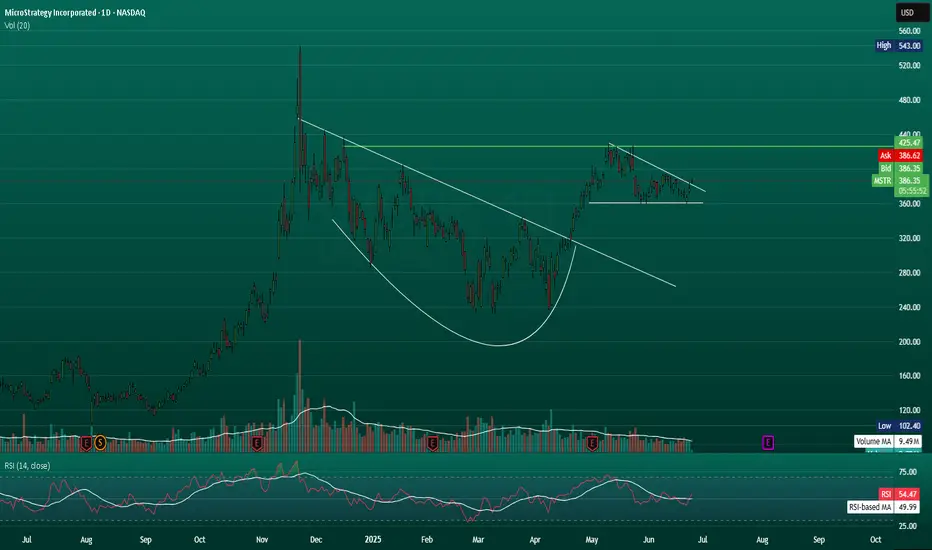
MSTRMSTR after looking above and failing in the attempt to test the highs it has been consolidating for a period of time and is show some signs of strength. If BTC can get a nice push above all time highs I believe you will see ATHs on MSTR.
PLTR 1D — When the tea is brewed and the handle’s in placePalantir’s daily chart is shaping up a textbook cup with handle pattern — one of the most reliable continuation setups in technical analysis. The cup base was formed over several months and transitioned into a consolidation phase, building a rectangle structure where smart money likely accumulated positions before a breakout.
Now here’s the key: price has not only broken out — it’s settled above all major moving averages, including EMA 20/50/100/200 and MA 50/200. The breakout candle was supported by surging volume, signaling strong participation from institutional buyers. When all the averages start bending upwards, it's usually not by accident.
The breakout above the $121 resistance zone unlocked a pathway toward a target at $187 , derived by projecting the height of the cup upward from the breakout level. This kind of structure, once confirmed, often fuels aggressive continuation — and this one’s got the setup locked in.
From a fundamental perspective, Palantir is holding solid ground: strong earnings reports, expanding government and commercial contracts, and aggressive development in AI services. Institutional interest is rising steadily, and that momentum is visibly reflected in price action.
To sum it up: price has launched cleanly out of the consolidation zone, pierced all critical MAs and EMAs, and continues to gain momentum. While the market sips its tea, this cup is boiling hot. Just don’t forget your stop loss — this is a trading desk, not a tea party.
If you enjoy posts like this, drop a like, share it around, and let’s hear your thoughts below. It keeps ideas moving and the content flowing — free, sharp, and relevant.

SUI Is Ready To Run!Good Morning Trading Fam,
I'm putting out a quick trade setup here on SUI, a coin I am honestly a long-term hodl'er of. I believe this coin has an exciting future ahead of it with tremendous potential to change the blockchain landscape for the better.
But this post is for those of you interested in trading it.
We have a perfect setup here. Descending bullish triangle, which we are nearing the end of. Strong long-time support underneath us. And my proprietary indicator has given us a buy signal at the point of confluence of both of the above. I have set three targets for you. Obviously, the higher the target, the higher the risk. Trade accordingly and let me know in the comments how you did. It makes me happy to know my followers are successful in their trades.
Best,
Stew

Ready for a new day, please bring another doubler like $EYENReady for a new day, please bring another doubler like NASDAQ:EYEN $5 to $10 or NYSE:SRFM yesterday which were the only 2 trades made and 2 nice wins🙏🏻

EURJPY: Bullish Trend Continues 🇪🇺🇯🇵
EURJPY shows a strength after a test of a significant demand zone.
Bullish breakout of a resistance line of a flag pattern provides
a strong trend-following signal.
Goal - 169.64
❤️Please, support my work with like, thank you!❤️
I am part of Trade Nation's Influencer program and receive a monthly fee for using their TradingView charts in my analysis.

USDCAD: Oil Price Weakness Weighs on CAD – Can USD Capitalize?USDCAD: Oil Price Weakness Weighs on CAD – Can USD Capitalize?
Hello TradingView community!
Today, let's analyze the USDCAD pair, which is showing interesting dynamics as the CAD faces pressure from falling oil prices.
🌍 Macro Drivers: CAD Struggles Amidst Lower Oil, USD Upside Limited
The USDCAD pair is caught in a tug-of-war between the Canadian Dollar (CAD) and the US Dollar (USD):
CAD pressured by oil: The Canadian Dollar has seen its gains trimmed, primarily weighed down by lower crude oil prices. Canada, being a major oil exporter, sees its currency directly impacted by these fluctuations.
Oil prices lower: A recent truce between Israel and Iran is keeping crude oil prices significantly lower (16% below Monday's highs), directly affecting CAD's strength.
USD's limited upside: Despite CAD's weakness, the US Dollar's upside attempts are being constrained by recent soft US economic data and persistent hopes for Federal Reserve (Fed) monetary policy easing.
In summary, USDCAD is seeing a slight upward tick due to a weaker CAD from oil price drops, but the USD's rally is somewhat capped by Fed easing expectations.
📊 Technical Analysis & USDCAD Trading Plan
Based on the USDCAD chart (H4/M30) provided:
Overall Trend: USDCAD is trading within an ascending channel, but shows signs of weakness near the channel's upper boundary. Price appears to be forming a lower high after a previous upward move.
Key Price Levels:
Potential SELL Zone (Resistance): Clearly identified around 1.36989. This is a strong resistance level, coinciding with recent local highs. Selling pressure is likely to emerge here.
Key Support (Potential BUY Zone): Around 1.36734 and further down at 1.36431. The 1.36431 level is particularly significant, aligning with a major Fibonacci level (1.382) and acting as a robust demand area from prior price action.
Moving Averages (EMAs): Price is trading near the EMAs (black, orange, red), indicating a consolidation phase and potential for a significant move.
Projected Price Action: The chart suggests that USDCAD could pull back from the current resistance zone (1.36989) towards the support levels below, particularly 1.36431, before potentially finding buying interest to resume an upward trend.
🎯 USDCAD Trading Plan:
SELL ZONE: 1.36989
SL: 1.37050
TP: 1.36900 - 1.36850 - 1.36800 - 1.36750 - 1.36700 - 1.36600 - 1.36500 - 1.36431
BUY ZONE: 1.36431
SL: 1.36300
TP: 1.36500 - 1.36550 - 1.36600 - 1.36650 - 1.36700 - 1.36750 - 1.36800 - 1.36900
⚠️ Key Factors to Monitor:
Crude Oil Prices: Any significant movements in crude oil will directly impact the CAD.
US Economic Data: Upcoming reports on inflation and employment from the US could heavily influence Fed policy expectations and USD strength.
Bank of Canada (BoC) Policy: Statements or decisions from the BoC will also be a critical factor affecting the CAD.
Trade smart and stay vigilant! Wishing everyone a successful USDCAD trading day!

Downtrend Slowing – Recovery Opportunity After Correction?USD/JPY: Downtrend Slowing – Recovery Opportunity After Correction?
Hello TradingView community!
Today, let's focus on analyzing the USD/JPY pair, which is showing interesting developments after its recent correction.
🌍 Macro Overview: USD/JPY Under Current Pressures
The market is observing shifts in the dynamics of the USD/JPY pair:
UOB Group's 24-Hour View: The USD experienced a sharp decline from 148.02 on Monday to 144.49, despite being "oversold". This indicates a slowing in the downtrend, though caution remains.
Retest Expected: According to UOB Group, there's a likelihood of USD/JPY retesting the 144.50 level before a more sustained recovery can be expected.
Downside Limited: A drop below 144.50 cannot be ruled out, but based on current momentum, any further weakness is unlikely to reach 144.00.
Resistance Levels: On the upside, resistance levels are noted at 145.20 and 145.55.
Overall, USD/JPY is in a phase of seeking equilibrium after a significant decline.
📊 Technical Analysis & USD/JPY Trading Plan
Based on the USD/JPY chart (H4/M30) you provided:
Overall Trend: The pair has undergone a relatively deep corrective decline after reaching a local peak, but appears to be seeking a strong support zone.
Key Price Levels:
Crucial Resistance (SELL Zone): Clearly at 144.894 - 145.178. This is an confluence area of Fibonacci levels and local highs where selling pressure could emerge strongly.
Important Support (Potential BUY Zone): Around 143.800 - 143.500. This represents a potential bottoming area where demand might be strong enough to push the price higher.
Projected Price Action: After the sharp decline, USD/JPY might retest the 144.50 area. If it holds above key support levels, an upward move towards resistance zones is plausible, as indicated by the arrows on the chart.
🎯 USD/JPY Trading Plan:
BUY ZONE: 143.800 - 143.500
SL: 143.400
TP: 144.000 - 144.200 - 144.500 - 144.800 - 145.000 - 145.200 - 145.500
SELL ZONE: 144.894 - 145.178
SL: 145.300
TP: 144.700 - 144.500 - 144.200 - 144.000 - 143.800 - 143.500
⚠️ Key Factors to Monitor:
US and Japanese Economic Data: Upcoming reports on inflation and employment from both nations could significantly impact Fed and BoJ policy expectations.
BoJ Policy Decisions: Any shifts in the Bank of Japan's stance will create strong volatility for the JPY.
Global Risk Sentiment: Changes in overall market sentiment can also affect JPY crosses.
Trade smart and stay informed! Wishing everyone a successful USD/JPY trading day!

Can it Reach New Highs as USD Weakens?EUR/USD: Euro's Resilience Holds Strong – Can it Reach New Highs as USD Weakens?
🌍 Macro Landscape: EUR/USD Rides Risk-On Sentiment and Fed Cut Hopes
The Euro (EUR) is showing significant strength, maintaining its position near a three-year high against the US Dollar (USD). This resilience is largely fueled by a moderately positive risk appetite in the market.
Simultaneously, the US Dollar is facing considerable downward pressure. This weakness stems from recent weaker-than-expected economic data from the United States and increasing market expectations for the Federal Reserve (Fed) to implement interest rate cuts. If US economic indicators continue to soften, it could solidify the case for earlier Fed rate cuts, further undermining the USD and potentially boosting EUR/USD.
🏦 Central Bank Policy: Diverging Paths for ECB and Fed
Federal Reserve (Fed): The market is increasingly pricing in the likelihood of Fed interest rate cuts. Weaker US data strengthens this narrative, as the Fed might be compelled to ease monetary policy to support economic growth. This dovish outlook for the Fed is a key driver of USD weakness.
European Central Bank (ECB): While the provided information focuses on the EUR's strength due to broader market sentiment and USD weakness, the ECB's more measured approach to monetary policy compared to the Fed's potential easing can create a favorable interest rate differential for the Euro, attracting capital flows.
This divergence in central bank policy expectations—with the Fed leaning towards cuts and the ECB maintaining a more cautious stance—creates a tailwind for the EUR/USD pair.
🌐 Capital Flows: Money Favors Euro Amidst USD Softness
Global capital flow models suggest that funds are increasingly moving towards assets perceived as offering better relative value or stability. As US yields become less attractive due to anticipated Fed rate cuts, capital may flow out of USD-denominated assets.
This outflow from the USD naturally benefits currencies like the Euro, especially given its current positive momentum driven by a moderate risk-on environment. The re-pricing of Fed policy risk directly influences these capital movements, contributing to the upward trajectory of EUR/USD.
📊 Technical Structure (H4 Chart Analysis): EUR/USD Eyes Key Resistance Levels
Based on the provided EUR/USD H4 chart:
Uptrend intact: The pair continues to exhibit a positive trend, characterized by higher lows and higher highs within an ascending channel.
Key Resistance Levels:
Initial Resistance: 1.16330. This level aligns with recent highs and the top of the minor channel. A break above this suggests further bullish momentum.
Major Resistance Zone: 1.17031. This is indicated as a significant resistance area, potentially a long-term target or a reversal point. A break here would confirm strong bullish conviction.
Key Support Levels:
Immediate Support: 1.15470. This level has acted as a support point, aligning with the EMA 200 and a Fibonacci retracement level, indicating a potential bounce area.
Strong Support Zone: 1.15249. This zone represents a robust demand area, aligning with previous price action and serving as a crucial level for bulls to defend.
Moving Averages (EMA 13-34-89-200): The price is trading above the short-term and long-term EMAs, suggesting strong bullish momentum. The EMAs are fanning out and showing a bullish alignment, reinforcing the uptrend.
Projected Price Action: The chart suggests that the price might retrace towards the 1.15470 or 1.15249 support zones before resuming its upward trajectory towards the 1.16330 and potentially 1.17031 resistance levels.
🎯 Trade Strategy Recommendations:
Scenario 1 – BUY the Dip:
Entry: Look for bullish confirmation around 1.15470 - 1.15249.
Stop-Loss: Below 1.15100 (or a level below the 1.15249 support for risk management).
Take-Profit:
TP1: 1.15600
TP2: 1.15800
TP3: 1.16000
TP4: 1.16200
TP5: 1.16330 (Targeting the immediate resistance)
TP6: 1.16500
TP7: 1.16800
TP8: 1.17031 (Targeting the major resistance)
Scenario 2 – SELL the Rally (Counter-trend/Reversal):
Entry: Look for bearish confirmation around 1.16330 - 1.16400 or higher near 1.17031.
Stop-Loss: Above 1.16500 (or above 1.17100 if selling at higher resistance).
Take-Profit:
TP1: 1.16200
TP2: 1.16000
TP3: 1.15800
TP4: 1.15600
TP5: 1.15470 (Targeting the immediate support)
TP6: 1.15249 (Targeting the strong support zone)
⚠️ Key Events to Watch:
Upcoming US Economic Data: Any further weak data could solidify Fed rate cut expectations and weigh on the USD.
ECB Official Statements: Comments from ECB members on inflation or monetary policy could impact EUR's strength.
Global Risk Sentiment: A continued moderate risk-on environment will generally support the EUR against the USD.
Trade smart and stay informed! Wishing everyone a successful trading day!
Powell's Softer Tone Hints at Gold's LiftoffXAUUSD: Powell's Softer Tone Hints at Gold's Liftoff – Ready for a July Rally?
Hey everyone!
Let's dive into XAUUSD today! We've got some sweet news from Fed Chair Jerome Powell that could be a game-changer for Gold.
🌍 Macro Edge: Gold Breathes Easier as Rate Pressures May Ease!
Gold's recent climb is largely thanks to Powell's "soft-spoken" remarks. He's openly admitted that tariff-driven inflation is lower than expected, even subtly hinting at earlier rate cuts – perhaps as soon as July!
Despite his "no need to rush" stance, the market's getting a clear message: if inflation keeps cooling down, the Fed will have room to loosen policy sooner. This is music to Gold's ears! Lower rates mean a reduced opportunity cost for holding Gold (which doesn't yield), making it far more attractive to investors.
🌐 Capital Flows: Gold vs. USD – Who's the Next Safe-Haven King?
Market liquidity always dances to the tune of interest rates and risks. Gold and the USD typically share the safe-haven crown during volatile times.
However, if Powell's "dovish tilt" holds, and the Fed cuts rates soon, prepare for a significant capital shift:
USD might cool off: Lower US yields reduce the USD's appeal.
Gold takes the spotlight: With lower holding costs and persistent global geopolitical uncertainties, Gold could see a surge in demand.
The market's re-pricing of Fed policy is already bolstering Gold, signaling a potential upside move on the horizon!
📊 Technical Insight (H4/M30 Chart): Gold Breaking Free, Targeting Higher Peaks!
Looking at our XAUUSD chart (H4/M30, based on your image):
Channel Breakout: Gold has clearly broken out of its prior descending channel! This is a positive sign, indicating weakening selling pressure and a potential trend reversal. Price is consolidating, possibly forming a new accumulation pattern or a minor ascending channel.
Key Levels to Watch:
Potential SELL Zone (Resistance): Around 3352.383 - 3371.205. This is a major historical resistance cluster where Gold has previously met strong selling pressure. Watch for rejection here.
Higher Resistance: 3391.750 - 3395.000. A decisive break above this level would signal a more robust long-term bullish trend.
Current BUY Zone (Support): Around 3302.939 - 3311.214. This is a critical demand zone where strong buying interest is likely to emerge, aligning with recent lows.
Next Key Support: 3286.257. This is the next line of defense if the current BUY zone breaks.
🎯 Trade Plan & Key Zones:
BUY ZONE: 3286 - 3284
SL: 3280
TP: 3290 - 3294 - 3298 - 3302 - 3306 - 3310 - 3315 - 3320
BUY SCALP: 3302 - 3300
SL: 3295
TP: 3306 - 3310 - 3314 - 3318 - 3322 - 3326 - 3330
SELL ZONE: 3353 - 3355
SL: 3360
TP: 3350 - 3346 - 3340 - 3335 - 3330 - 3320
SELL ZONE: 3372 - 3374
SL: 3378
TP: 3370 - 3366 - 3362 - 3358 - 3354 - 3350
⚠️ What Else to Watch For:
More Fed Official Speeches: Any new comments on inflation or policy will keep the market buzzing.
Geopolitical Developments: Ongoing global tensions can always boost Gold's safe-haven appeal.
Let's trade smart and stay sharp! Wishing everyone a successful trading day!

GBPUSD – Bullish Structure Holds, Waiting for a Clean RetestGBPUSD recently bounced strongly from the ascending trendline and hit resistance at 1.36300. The price is now slightly correcting, with a high probability of retesting the 1.35000 support zone – an area of FVG and technical confluence.
The bullish structure remains intact as long as price holds above this level. Positive UK Services PMI data further supports the medium-term uptrend.
Are you waiting for the pullback to jump in?

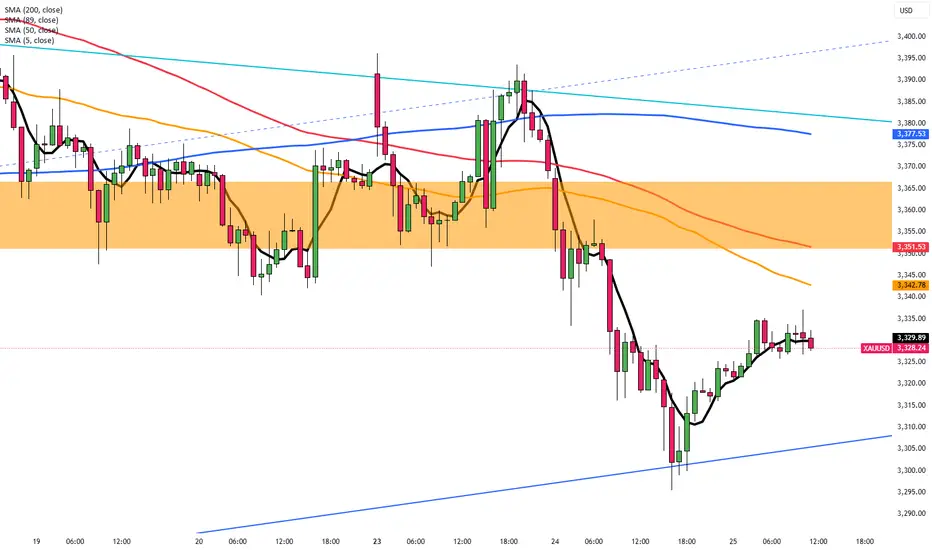
XAUUSD – Short-Term Decline, Long-Term Bullish AccumulationAfter a sharp drop of over 1,250 pips yesterday, gold reacted at the key demand zone around 3,300, where initial buying pressure has emerged. The chart still shows a valid short-term downtrend, but this area also aligns with the lower boundary of a long-term channel—previously a launch point for significant upward moves.
Currently, XAUUSD is consolidating below multiple unfilled Fair Value Gaps, awaiting a confirmed breakout toward the 3,361.500 region to potentially reverse the trend.
In terms of news, tensions in the Middle East escalated as the U.S. launched airstrikes on Iran’s nuclear facilities, triggering strong volatility in gold. Upcoming key U.S. economic data—including quarterly GDP and the Fed’s preferred inflation gauge, Core PCE—will play a crucial role in determining whether gold has the momentum to break out or remains in consolidation.
For now, the short-term bias remains bearish, but buyers are quietly accumulating strength for a potential long-term rally.

Nasdaq 100 Near Breakout – Eyes on 22,200 ResistanceThe Nasdaq 100 is approaching a critical technical level at 22,200. This resistance marks the upper boundary of recent consolidation and aligns with prior rejection zones. A clean break above this threshold could trigger a sharp upside move, possibly propelling the index into uncharted territory.
Geopolitical tensions have eased, and the dollar’s renewed weakness is supporting risk appetite, particularly in the tech-heavy Nasdaq. Strong earnings from key sectors are reinforcing bullish sentiment, with investors increasingly pricing in a favorable macro backdrop.
Technically, momentum is building. Price action has formed a series of higher lows, and buying pressure is intensifying near resistance. A breakout above 22,200 could ignite a strong rally, driven by stop orders and fresh bullish entries.
That said, traders should remain cautious. While the breakout setup is promising, a retracement toward support zones—such as 21,500 or the 20-day moving average—remains possible, especially if upcoming inflation or macro data disappoints.
For now, the 22,200 level remains the key to watch. A daily close above this level would shift the bias clearly higher, confirming breakout strength and potentially accelerating gains toward 22,800 or beyond.

SMCI: When a chart says it’s time to reconnect with the AI hypeOn the daily chart, Super Micro Computer Inc. (SMCI) is showing a clean bullish setup. Price broke out of a descending trendline (green dashed), confirmed it with a retest, and is now consolidating above the breakout zone. The golden cross — where the MA50 crossed above the MA200 — confirms a long-term trend reversal.
Volume profile indicates strong accumulation near $41–43. The 0.5 Fibonacci level at $41.84 acted as support. Above the current range, there’s low volume resistance up to $63.57 (0.786), followed by $66.44 and a final extension target at $79.82 (1.272).
Fundamentals: SMCI is a leading server hardware manufacturer. Demand for their systems has soared with the explosion of AI infrastructure. The company maintains solid financials, with rising quarterly revenue and growing presence in the cloud sector. Institutional investors have been actively increasing their positions since late 2023 — a sign of strong long-term conviction.
Tactical plan:
— Entry: market $42–43
— Target 1: $55.91
— Target 2: $63.57
When technicals scream textbook breakout and fundamentals bring AI momentum to the table — it might just be one of the best late entries in the AI wave this summer.

Silver Outperforms Gold, Eyes $36Silver climbed back toward $36, bouncing from over two-week lows on falling Treasury yields and a softer dollar. While the Israel-Iran ceasefire remains shaky, Fed Chair Powell said “many paths are possible,” hinting at a flexible rate stance depending on job market data.
Strong industrial demand and tight supply continue to support silver, which is up nearly 9% in June, far outpacing gold’s modest gains.
Resistance is seen at 37.50, while support holds at 35.40.

Gold Rebounds on Ceasefire FragilityGold edged back up to around $3,330, recovering from a two-week low. While the Israel-Iran ceasefire brought temporary calm, a US intelligence report showed that Iran’s nuclear progress was only briefly disrupted, raising concerns about renewed tensions.
Fed Chair Powell adopted a cautious stance, saying rates would likely stay unchanged for now, though a July cut remains possible. Diverging views among Fed members on inflation and job data may limit gold’s upside in the near term.
Resistance is seen at $3,355, while support holds at $3,285.
EUR/USD Nears 1.1620 Before Powell’s TestimonyEUR/USD edged up to 1.1615 in early European trading on Wednesday, supported by improved risk sentiment after Israel and Iran signaled an end to their air conflict. The truce, backed by pressure from President Trump, increased appetite for risk assets, favoring the euro over the dollar.
All eyes are now on Fed Chair Jerome Powell, who reiterated on Tuesday that monetary policy will remain data-driven. However, comments from Kansas City Fed President Schmid hinted at caution due to tariff-driven inflation. While markets expect a rate cut in September, July odds have edged slightly higher.
Resistance is at 1.1630, while support is at 1.1530.
