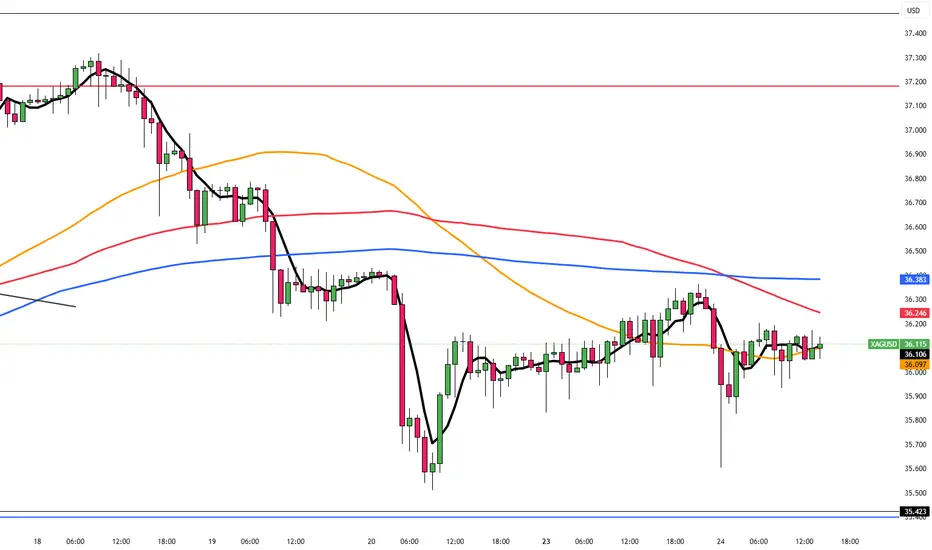
Silver Steady at $36 as Rate Cut Bets RiseSilver steadied around $36.10 during the Asian session, paring earlier losses after the geopolitical jolt. While the ceasefire cooled nerves, markets remain alert after Iran’s limited strike on a US base. Fed commentary also weighed in: Bowman and Waller leaned dovish, though Powell’s tone remains cautious ahead of his testimony.
The first resistance is seen at 37.50, while the support starts at 35.40.
Technical Analysis
Gold Falls to Two-Week Lows Gold fell to around $3,350 per ounce on Tuesday, its lowest level in two weeks, as the ceasefire reduced geopolitical stress. The truce announcement, set to begin with Iran immediately and Israel 12 hours later, cooled safe-haven demand. The metal’s recent run paused despite lingering tensions in the region.
Resistance is seen at $3,355, while support holds at $3,285.

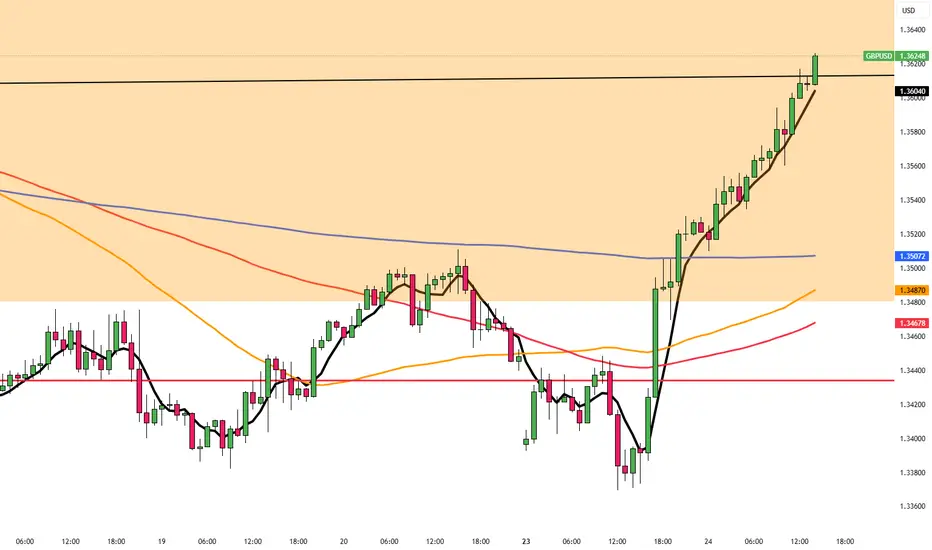
British Pound Slips to One-Month LowGBP/USD briefly climbed to 1.3560 in early European trading, supported by dollar softness and anticipation of upcoming speeches from BoE Governor Bailey and Fed Chair Powell. However, the pair remains under pressure, as market doubts linger around the ceasefire’s durability, especially after new missile activity by Israel’s IDF.
Fed rate cut expectations continue to build: odds for July are now at 23%, and 78% for September, fueled by dovish remarks from Governor Bowman.
Resistance is seen at 1.3600, while support holds at 1.3500.
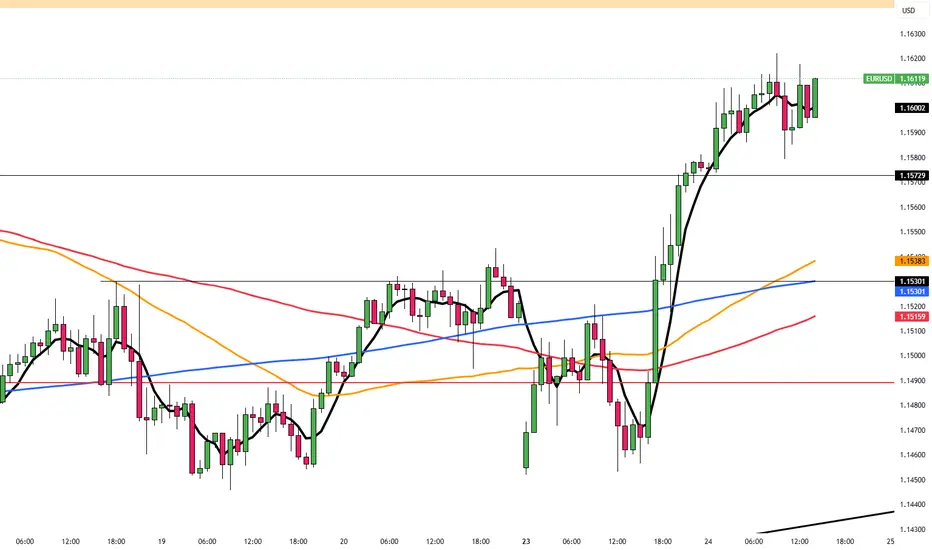
EUR/USD Hits Weekly High as Ceasefire Weakens DollarEUR/USD climbed to a fresh weekly high near 1.1610 during late Asian trading on Tuesday, boosted by a sharp sell-off in the US Dollar following the announcement of a ceasefire between Israel and Iran by President Donald Trump. The truce improved market risk appetite and dampened demand for traditional safe havens like the US Dollar. As a result, the US Dollar Index (DXY) dropped steeply from Monday’s two-week high of 99.42 to around 98.10.
The dollar also came under pressure from shifting expectations around Fed policy. On Monday, Fed Governor Michelle Bowman signaled support for a potential rate cut as early as the July meeting, citing rising concerns over the labor market. “We should put more weight on downside risks to the job market,” she stated, adding that it's time to consider adjusting the policy rate.
Her dovish tone nudged up expectations for a July rate cut, with CME FedWatch data showing the probability rising from 14.5% on Friday to 22.7%.
In the Eurozone, ECB officials expressed concerns over the region’s economic outlook, particularly considering new US tariff policies. President Christine Lagarde, in remarks to the European Parliament, warned that inflation staying near the 2% target is uncertain and noted that survey data points to “some weaker prospects for economic activity in the near term.” She added that risks to growth remain “tilted to the downside.”
Resistance is located at 1.1630, while support is seen at 1.1530.
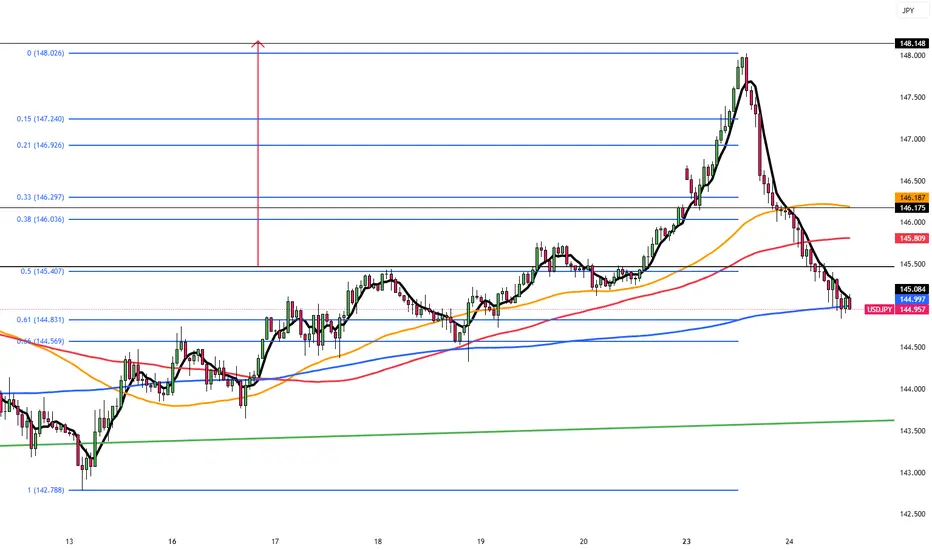
Yen Rebounds as Ceasefire Calms MarketsThe Japanese yen recovered to around 145.5 per dollar on Tuesday, gaining strength after the ceasefire announcement. Although Iran launched missiles at a US base in Qatar, causing no casualties, the gesture was largely seen as symbolic. Tehran’s decision not to target the Strait of Hormuz further eased fears of major disruptions.
The key resistance is at $146.20 while the major support is at $144.85.
Oil Price: Breakout or Fakeout? Watch This Zone Closely Technical Overview:
The current price action is testing the upper boundary of a descending wedge, a bullish reversal pattern. The recent strong green candle indicates a potential breakout attempt, yet price is hovering near a critical resistance level at $74.20 (Fib 0.5).
Key levels from the Fibonacci retracement are:
🔼 Resistance at $74.20 (0.5), then $78.16 (0.618)
🧲 Local support at $69.78 (0.382)
🛡️ Strong demand zone near $63.81 (0.236) if rejection occurs
Structure + Patterns:
Price has been compressing inside a falling wedge, which statistically resolves to the upside.
The breakout candle broke above the 20 EMA and touched the upper wedge resistance — signaling a decision point.
Volume is rising on bullish candles — initial confirmation of buyer interest, but not yet decisive.
Scenarios to Watch
Bullish Case:
Break and close above $74.20 on higher volume → likely move toward $78–$86 resistance zone.
Confirmation of wedge breakout could trigger trend reversal, aligning with bullish fib levels.
Momentum could accelerate if macro factors support demand (see geopolitics below).
Bearish Case:
Failure to close above $74.20 = fakeout risk → price may reject down to $69.78 or even retest $63.81.
Bearish rejection wick on the daily/4H would be an early signal.
Macro & Geopolitical Factors to Monitor:
Middle East Tensions: Any escalation (especially around Iran or shipping lanes) could spike oil due to supply fears.
US Strategic Reserves & Elections: Moves to refill reserves or control inflation could support demand.
China Demand Recovery: Data showing improved industrial output or stimulus from PBoC may strengthen global oil outlook.
Final Thoughts:
Price is at a pivot zone — breaking this wedge with strength could shift the short-to-midterm trend. Until then, this remains a "show me" breakout . Watch how the next 1–2 weekly candles close around the $74–$75 area to confirm direction.

500% in a day banger from $0.32 to $1.95 $IBO500% in a day banger 🚀Please bring another stock like this today $0.32 to $1.95 AMEX:IBO
In and out at safest levels, no holding and hoping, then we move on to the next stock and keep repeating until too much money is made 🤑

XAUUSD: Key Reversal Zone or Deeper Correction Ahead?XAUUSD: Key Reversal Zone or Deeper Correction Ahead?
Gold enters the new trading week balancing on a technical and macroeconomic knife’s edge. After a steep decline, prices are testing critical liquidity zones — just as geopolitical tensions and US economic uncertainty intensify.
🌍 Macro & Fundamental Outlook
📰 Middle East Tensions Rising Again: Israel has signaled potential strikes on Tehran after Iran allegedly violated a ceasefire agreement. Such developments usually support gold as a safe-haven asset.
📊 US Economic Signals Are Mixed: Last week’s PMI and housing data point toward an economic slowdown. If this week’s Core PCE data softens, expectations for a Fed rate cut in September will grow — likely weakening the USD and lifting gold.
🏦 Global Demand for Gold Still Strong: Central banks, particularly from China and India, are continuing their gold accumulation, reinforcing long-term bullish fundamentals.
📉 Technical Analysis (H1–H4)
Gold is still trading within a downward channel but is now approaching a strong demand zone around 3276, a level that has triggered rebounds in the past.
EMA 34 – 89 – 200 indicate bearish momentum, but RSI is showing bullish divergence — hinting at a possible reversal or short-term bounce.
Price action around key support and resistance levels will be crucial this week.
✅ XAUUSD Trade Setup
BUY ZONE: 3278 - 3276 | SL: 3270 | TP: 3282 - 3286 - 3290 - 3294 - 3298 - 3302 - 3305 - 3310
SELL ZONE: 3367 - 3369 | SL: 3375 | TP: 3364 - 3360 - 3356 - 3352 - 3348 - 3344 - 3340 - 3330 - 3320
📌 The Buy Zone lies within a historical liquidity pocket — ideal for a potential rebound if geopolitical risks rise or USD weakens.
📌 The Sell Zone is near a key Fair Value Gap (FVG) and local resistance — strong confluence for short opportunities on a bounce.
🧭 Final Thoughts
XAUUSD is facing a pivotal moment. With both geopolitical events and major US economic data on the horizon, traders should prepare for volatility. Patience, technical discipline, and proper SL/TP management will be key to navigating this environment successfully.

Gold: Breakout and Potential retraceHey Traders, in today's trading session we are monitoring XAUUSD for a selling opportunity around 3,340 zone, Gold was trading in an uptrend and successfully managed to break it out. Currently is in a correction phase in which it is approaching the retrace area at 3,340 support and resistance area.
Trade safe, Joe.

Pound-Yen Finds Support with Eyes on 198.1FenzoFx—GBP/JPY is forming bullish long-wick candlesticks near 196.8, just above key support at 196.5.
The market remains bullish above this zone, with potential to retest 198.1. A sustained move higher could extend the rally.
The bullish outlook is invalidated if GBP/JPY closes below 196.5.

CADCHF: Confirmed Bearish Trap?! 🇨🇦🇨🇭
There is a high chance that CADCHF will bounce from the underlined
blue support.
As a confirmation, I see a cup & handle pattern on an hourly time frame
that compose a bearish trap.
Goal - 0.5926
❤️Please, support my work with like, thank you!❤️
I am part of Trade Nation's Influencer program and receive a monthly fee for using their TradingView charts in my analysis.

CAD/JPY Holds Trendline Support with Bullish Bias IntactFenzoFx—CAD/JPY dipped from 107.34, finding support at a bullish FVG while staying above the ascending trendline.
The Stochastic Oscillator signals oversold, suggesting a potential reversal. The outlook remains bullish above 105.61, targeting a retest of 107.35. A break below 105.61 would invalidate the bullish scenario.

HIMS 1D — This pattern didn’t cook for nothingOn the daily chart of Hims & Hers Health, we’re looking at a textbook cup with handle formation — not just a pattern, but a structure backed by time, volume, and classic price behavior. The base of the cup formed steadily from February to May 2025, and as soon as the curve was complete, price transitioned into a tight consolidation — the "handle" that often masks real accumulation.
Right now, price is testing the resistance area. And it’s not just floating up there — it’s coming in hot: price has already broken through EMA 20/50/100/200 and SMA 50/200. That’s a full stack flip. This isn’t sideways noise — it’s a structural shift in control.
Volume is starting to build as price rises, confirming that demand is real and institutional positioning likely active. We’re watching a breakout zone above the handle — and when that breaks, the structure unlocks with a clear target: $107.25, roughly a 2x move from current levels.
This setup isn’t noise. It’s a long-cooked formation that’s now about to boil over. If the handle holds and price breaks through — the rest is just follow-through.

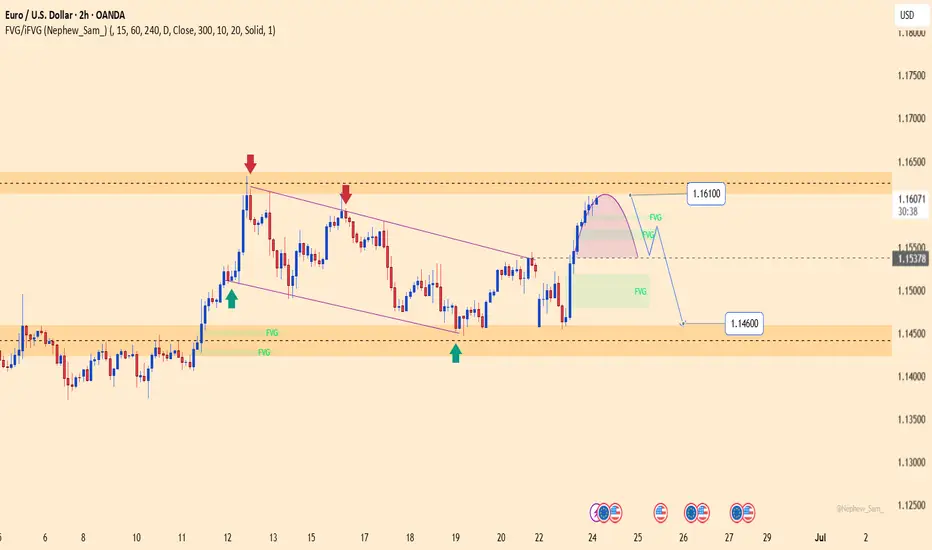
EURUSD – Rejected at 1.16100, bearish pressure re-emergingEURUSD has just completed a technical rebound toward the 1.16100 resistance zone, which has previously rejected price multiple times. The current structure suggests a mild reversal, with a potential pullback toward 1.15378. A break below this support could extend the decline toward 1.14600.
Recent upside momentum came mainly from temporary USD weakness, but the greenback remains supported by expectations that the Fed will keep interest rates elevated, while Eurozone PMI data continues to disappoint.
In summary, 1.16100 remains a key resistance level. If price shows clear rejection here, EURUSD may be poised for a deeper correction in the short term.
#NIFTY Intraday Support and Resistance Levels - 24/06/2025Today, Nifty is expected to open with a gap-up near the 25,250 level. This level is crucial, as a sustained move above it can trigger a strong upside rally. If Nifty manages to hold above 25,250, we may see targets of 25,350, 25,400, and even 25,450+ in the coming sessions. On the downside, if the index slips below 24,950, it could lead to a corrective move toward 24,850, 24,800, and potentially 24,750 zones.
Traders should closely watch the 25,050–25,100 range for intraday strength, and the 24,950 mark as immediate support. Any breakout or breakdown from these levels will offer direction for the day. Maintain strict stop-loss and consider trailing profits as levels get tested.

XAUUSD – Holding Support, Potential Rebound in SightOn the H4 chart, gold recently dropped over 1,250 pips, but is now showing signs of stabilizing around the key support zone at 3,303 USD. Although price temporarily broke below the ascending trendline, current price action suggests a possible false breakout. If support holds, a rebound toward the 3,418 USD resistance – aligning with the previous trendline and an unfilled FVG – becomes likely.
Yesterday’s decline was largely triggered by news that the U.S. carried out airstrikes on Iranian nuclear sites, boosting the USD and pressuring gold. However, the broader market remains sensitive, with traders awaiting crucial U.S. data – including Q1 GDP and Core PCE, the Fed’s preferred inflation gauge.
If these upcoming releases signal economic slowdown or easing inflation, gold may regain upside momentum. As long as 3,303 USD holds, the technical structure favors a short-term bullish scenario.

[INTRADAY] #BANKNIFTY PE & CE Levels(24/06/2025)Today, a gap-up opening is expected in Bank Nifty near the 56,500 level. This zone lies close to a crucial resistance level, so price action after opening will be key. If Bank Nifty sustains above the 56,550–56,600 zone, it could trigger a strong upside rally toward 56,750, 56,850, and potentially 56,950+ levels. On the other hand, if it fails to hold above 56,000 and starts slipping below the 55,950–55,900 zone, a downside move is likely, which could push the index toward 55,750, 55,650, and 55,550 levels.

Nightly $SPY / $SPX Scenarios for June 24, 2025🔮 Nightly AMEX:SPY / SP:SPX Scenarios for June 24, 2025 🔮
🌍 Market-Moving News 🌍
🇺🇸 Markets Eye Powell Testimony & Consumer Confidence
Today brings a double dose of market-moving data: the June Consumer Confidence Index and Fed Chair Jerome Powell’s testimony before Congress. These will be key indicators of household sentiment and potential shifts in Fed rate guidance
🛢️ Oil Volatility Persists on Middle East Strain
Oil prices briefly spiked after U.S. strikes on Iran’s nuclear facilities, prompting fears of supply disruptions. However, prices have since dipped as ceasefire hopes emerge. Investors remain cautious on energy headwinds
💱 Dollar Retraces on Safe-Haven Rotation
The dollar softened after peaking as geopolitical tensions eased slightly. Still, it remains sensitive to Powell’s tone and confidence data, which could reintroduce volatility
📊 Key Data Releases & Events 📊
📅 Tuesday, June 24:
10:00 AM ET – Conference Board Consumer Confidence (June)
Monitors household optimism; a rebound could support consumer spending and equities.
10:00 AM ET – Fed Chair Powell Testimony Begins
Powell appears before the House Financial Services Committee. Market focus: inflation outlook, tariffs, and potential timing for rate cuts.
⚠️ Disclaimer:
This information is for educational and informational purposes only and should not be construed as financial advice. Always consult a licensed financial advisor before making investment decisions.
📌 #trading #stockmarket #economy #Fed #trade #energy #technicalanalysis

EURUSD Potential UpsidesHey Traders, in the coming week we are monitoring EURUSD for a buying opportunity around 1.14500 zone, EURUSD is trading in an uptrend and currently is in a correction phase in which it is approaching the trend at 1.14500 support and resistance area.
Trade safe, Joe.

Gold: Breakout and Potential Retrace!!Hey Traders, in today's trading session we are monitoring XAUUSD for a selling opportunity around 3,390 zone, Gold was trading in an uptrend and successfully managed to break it out. Currently is in a correction phase in which it is approaching the retrace area at 3,390 support and resistance zone.
Trade safe, Joe.

$NVDA 6/27 exp week; $150 calls. Quick ChartHello. Market is moving up off the “news” of “ceasefire” from Trump. Take what is given I suppose. NASDAQ:NVDA could see a beautiful upside towards the psych level of $150 in just one session (Tuesday, 6/24) which is just a “small” move of 3%. Could break out of its rising wedge. This name has been lackluster as of late (kinda sorta). $150 calls will be entered at open (6/24) and my first target will be $148.98. There are multiple rejections at these levels. Good luck!
WSL

Brent Crude still in controlled yr 2025 range ~ 75 - 71 - 63 USThe Brent crude oil price today underwent a technical correction in the D1 / Day time frame as seen from a technical analysis standpoint. It has not yet broken out to indicate Panic in markets of while being within controlled thresholds .
2025 opening price level : USD 75 ;
MAY face support at USD 71 which is JUNE resistance ; can range around this price line
Next drop below June 2025 opening price : USD 63
Experience in markets also say that in order to go Up , markets need a timely Correction (preliminary down move )too !!
Time to Wait and Watch !

Bitcoin Tests Key Support-Healthy Correction Within Bull MarketHealthy Pullback, Strong Structure:
Bitcoin’s recent dip is a constructive correction within a broader bull trend, as it tests the critical $100,000–$105,000 support zone—a former resistance area from early 2025.
Institutional Demand Holds the Line:
Maintaining levels above the psychologically important $100,000 mark highlights continued institutional accumulation and reinforces the underlying strength of the trend.
Momentum Reset, Base Building:
This pullback has helped reset overbought conditions from the prior rally, laying the foundation for the next potential leg higher.
Key Levels to Watch:
Support: $100,000–$105,000
Breakout Trigger: A close above $108,000 would confirm uptrend continuation
Outlook: Bullish bias remains valid as long as support holds
Investor Opportunity:
With structure intact and downside contained, this consolidation presents a favorable risk-reward setup for long-term investors looking to position ahead of a potential breakout.
#Bitcoin #BTC #CryptoMarket #TechnicalAnalysis #SupportAndResistance #BullMarket #RiskReward #InstitutionalBuying #MarketOutlook #PriceAction
