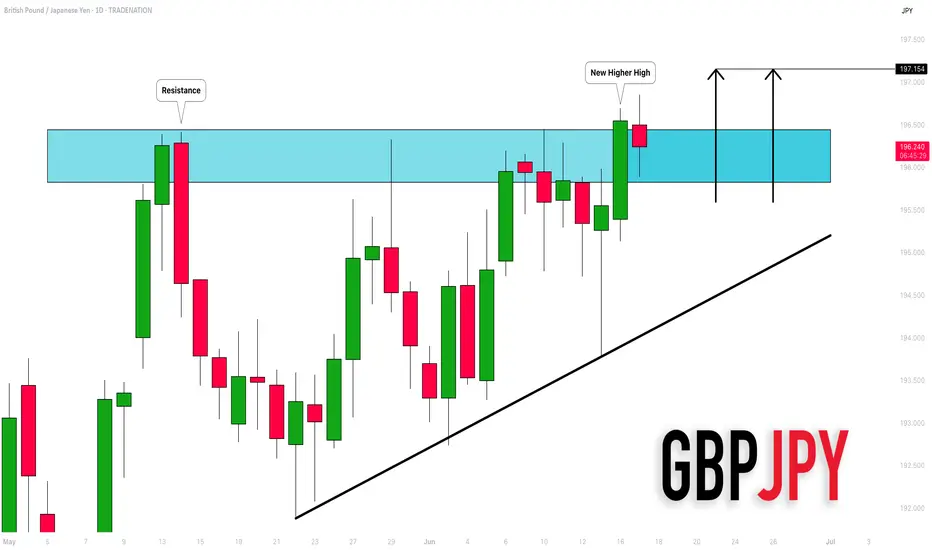
GBPJPY: Important New High 🇬🇧🇯🇵
GBPJPY set a new higher high higher close on a daily,
violating a key horizontal resistance cluster.
I think that it opens a potential for more growth.
Next strong resistance is 195.15
❤️Please, support my work with like, thank you!❤️
I am part of Trade Nation's Influencer program and receive a monthly fee for using their TradingView charts in my analysis.
Technical Analysis
"Downside DAX" is what we will call it in July?Looking at the technical picture purely, we can see that weakness is starting to kick in. Will July be a negative month for DAX? Let's have a look.
XETR:DAX
Let us know what you think in the comments below.
Thank you.
77.3% of retail investor accounts lose money when trading CFDs with this provider. You should consider whether you understand how CFDs work and whether you can afford to take the high risk of losing your money. Past performance is not necessarily indicative of future results. The value of investments may fall as well as rise and the investor may not get back the amount initially invested. This content is not intended for nor applicable to residents of the UK. Cryptocurrency CFDs and spread bets are restricted in the UK for all retail clients.

Gold holds above key zoneAfter breaking the major resistance at 3,392 USD — a level that had been rejected multiple times in the past — XAUUSD is undergoing a slight pullback to retest the newly established support. The bullish reaction in this area suggests that buyers are still in control of the trend.
In the current context, U.S. retail sales have fallen more than expected, reinforcing expectations that the Fed may cut interest rates soon. This puts pressure on the dollar and benefits gold.
The primary scenario is a bounce from the current support toward the next resistance area near 3,481 USD. The 3,392 USD level has now become a key support to sustain the ongoing bullish structure.

EURUSD: Awaiting Confirmation to Continue the UptrendThe EUR/USD pair closed yesterday at 1.1550, moving within the 1.1526–1.1558 range. The euro continues its bullish trend, driven by U.S. inflation data coming in lower than expected, which increases expectations of an upcoming rate cut by the Fed. In addition, geopolitical tensions in the Middle East—particularly between Israel and Iran—have slightly weakened the U.S. dollar, providing additional support to the euro.
From a technical perspective, the price is currently correcting toward the 1.1480 area, where the ascending trendline converges with the exponential moving average. This is a key support zone. If it holds and a clear bullish signal emerges, EURUSD could rebound and move toward the 1.1610 resistance level.
Main scenario: look for buying opportunities around 1.1480 if a bullish confirmation appears, targeting 1.1610.
Alternative scenario: if the 1.1480 level is broken, the short-term uptrend could be at risk.

Gold Soars – Heading Towards 3,500 USD/ounce?Gold prices closed yesterday at 3,457.7 USD/ounce, up 0.12% from the previous day, fluctuating between 3,453.7 USD and 3,458.1 USD/ounce, marking the highest level in the past two months.
XAU/USD is currently maintaining an uptrend within a well-defined price channel, with strong support at the 3,390–3,400 range. After a short correction, the price could continue to rise if it holds above the EMA34, with the next target towards the 3,445–3,460 range and further up to 3,500 USD/ounce.
This upward momentum is supported by geopolitical tensions in the Middle East, particularly between Israel and Iran, driving demand for gold as a safe-haven asset. U.S. CPI data lower than expected has also increased expectations of a Fed rate cut, alongside central banks increasing gold reserves, all contributing to the continued rise in gold prices.

AUDCAD: Pullback From Resistance Confirmed 🇦🇺🇨🇦
AUDCAD is going to retrace from a key intraday horizontal resistance.
A local bearish CHoCH and an imbalance on an hourly time frame
provide a strong bearish confirmation.
Goal - 0.88445
❤️Please, support my work with like, thank you!❤️
I am part of Trade Nation's Influencer program and receive a monthly fee for using their TradingView charts in my analysis.

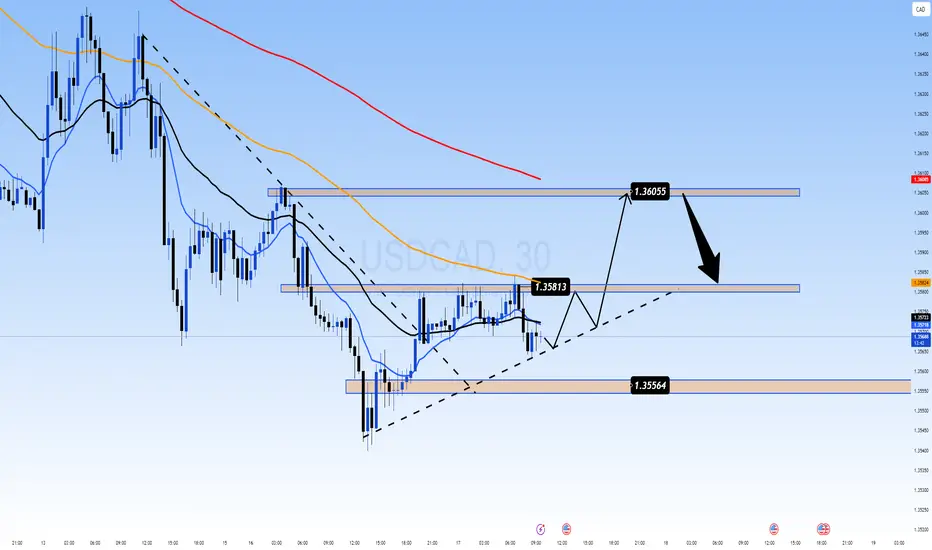
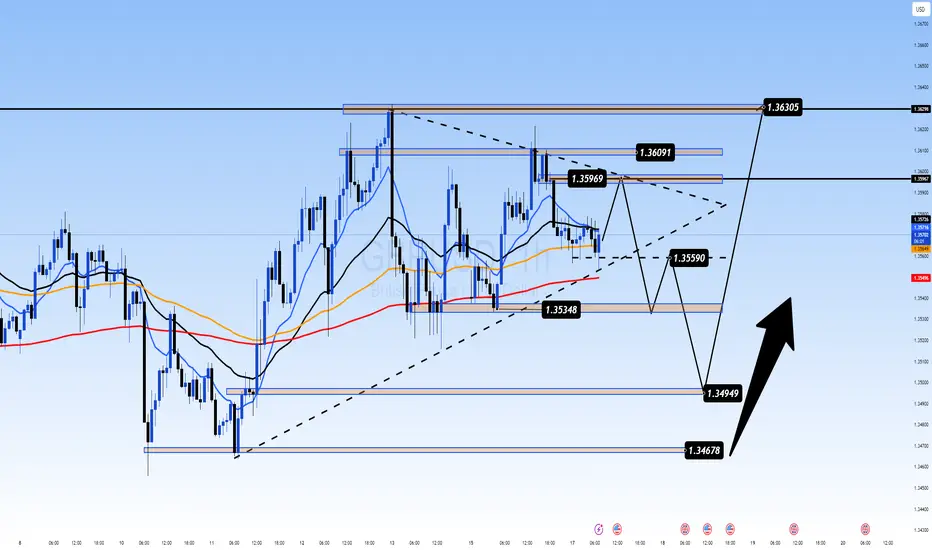
Oil Rises, Canadian Yields Surge: Can USD/CAD Rebound?USDCAD 17/06 – Oil Rises, Canadian Yields Surge: Can USD/CAD Rebound?
After a significant drop to the 1.355x area, USD/CAD is showing early signs of recovery. However, the pair remains influenced by strong macro headwinds—particularly oil prices and Canadian monetary policy signals.
🌐 Macro & Sentiment Overview
WTI crude oil is rising due to ongoing tensions between Israel and Iran, which increase the risk of global supply disruptions. This supports the Canadian Dollar (CAD) as a commodity-linked currency.
Canada’s 10-year bond yields have reached their highest levels in 5 months (~3.4%), reinforcing expectations that the BoC may remain hawkish in the near term.
USD weakens slightly as traders await more clarity from the Federal Reserve about the next rate cut timeline, potentially in Q3.
📊 Technical Analysis (M30 Chart)
Price is printing higher lows above the key trendline.
EMAs 13–34–89 are tightening → sign of sideways pressure before breakout.
Short-term bullish channel still intact.
Key resistance zones: 1.3581 and 1.3605.
🎯 Trade Setup Scenarios
📈 Long Scenario
Entry: 1.3556 – 1.3560 (trendline bounce)
Stop Loss: 1.3535
Take Profits: 1.3581 → 1.3605
✅ Wait for M30/H1 confirmation like bullish engulfing or price-action breakout.
📉 Short Scenario
Entry: 1.3605 (if price rejects resistance)
Stop Loss: 1.3630
Take Profits: 1.3581 → 1.3556
⚠️ Trigger only on bearish rejection with strong candle and volume at resistance.
📌 Strategic Outlook
USD/CAD is caught in a tug-of-war: stronger Canadian fundamentals (oil + yields) vs. cautious USD movement post-FOMC. If oil prices and Canadian yields continue to climb, CAD may remain in favor. However, short-term technical rebounds toward 1.3600 remain valid if price structure holds.
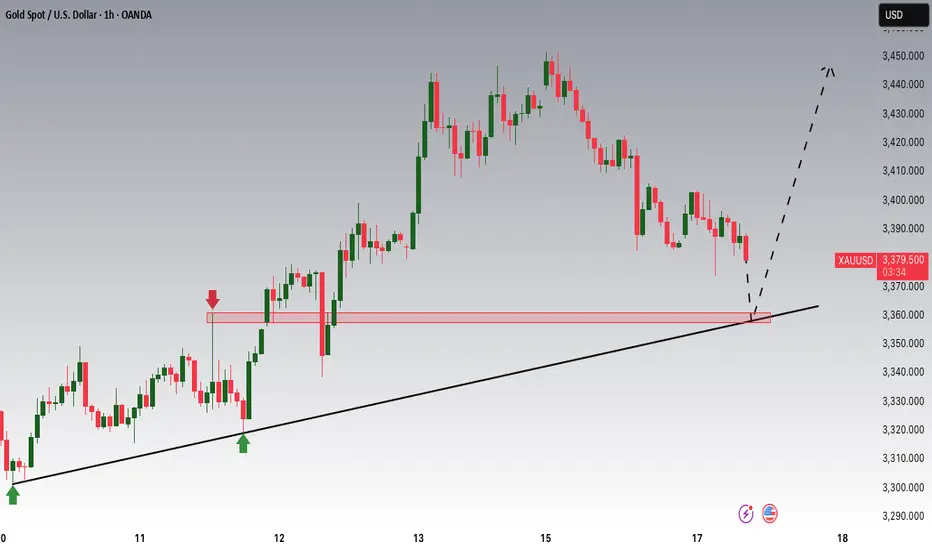
Gold is Nearing an Important Support!!Hey Traders, in today's trading session we are monitoring XAUUSD for a buying opportunity around 3,360 zone, Gold is trading in an uptrend and currently is in a correction phase in which it is approaching the trend at 3,360 support and resistance area.
Trade safe, Joe.
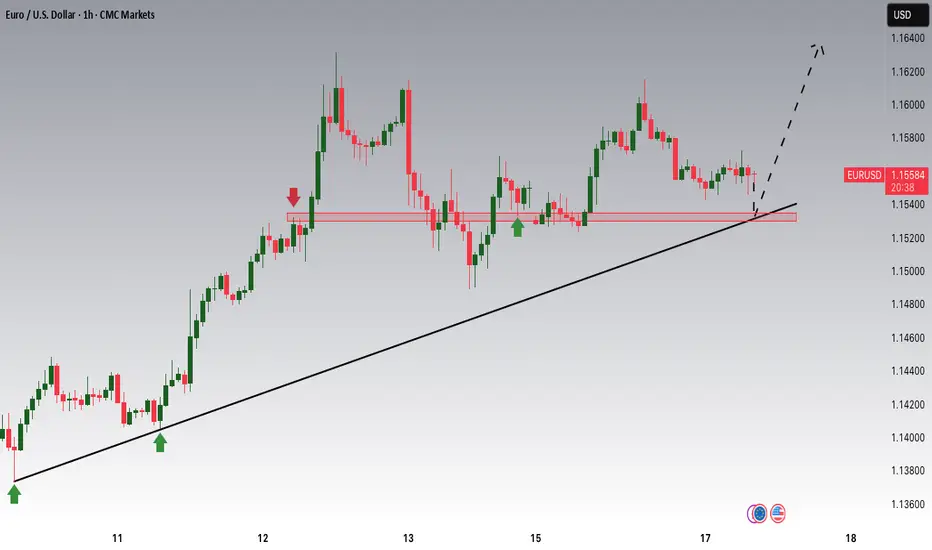
EURUSD Potential UpsidesHey Traders, in today's trading session we are monitoring EURUSD for a buying opportunity around 1.15300 zone, EURUSD is trading in an uptrend and currently is in a correction phase in which it is approaching the trend at 1.15300 support and resistance area.
Trade safe, Joe.
Bitcoin Pushed Crypto Market Into A Higher Degree CorrectionGood morning Crypto traders! Cryptos are coming lower and we can now see a five-wave drop on Bitcoin, which indicates for a deeper, higher degree correction, so Crypto TOTAL market cap chart may stay in consolidation within an ABC correction, which can retest 3.0T – 2.8T support zone before bulls return.
Bitcoin has impulsive characteristics on 4h time frame, and we can clearly see five waves up that can send the price even higher after a pullback. Now that it’s back to all-time highs, we can see it making a higher degree ABC correction, which can take some time, and it can retrace the price back to 97k-93k support zone before a bullish continuation.
However, we may now see a temporary corrective recovery in wave B, where some ALTcoins could still be doing well, if we consider that ALTcoin dominance may start kicking in. Yesterday we shared a chart of the ratio of TOTAL3(ALTcoins) market cap against Bitcoin with ticker TOTAL3ESBTC, which shows that ALTcoins may start outperforming BTC soon. It can be finishing final subwave C of (Y) of a correction in blue wave B which may cause a new strong rally into wave C that can bring the ALTseason similar as in the beginning of 2021.

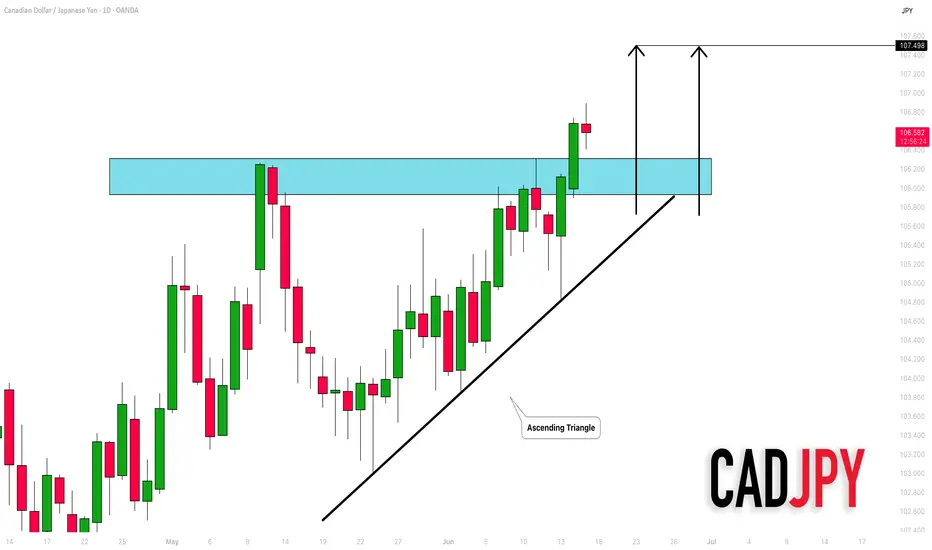
CADJPY: Important Breakout 🇨🇦🇯🇵
CADJPY successfully violated a resistance of an ascending triangle
pattern on a daily time frame.
The broken structure turns into a strong support now.
The pair may continue rising after a pullback.
Next goal - 107.5
❤️Please, support my work with like, thank you!❤️
Squeeze in Progress: Will BOJ Trigger the Next Breakout?USDJPY 17/06 – Squeeze in Progress: Will BOJ Trigger the Next Breakout?
The USDJPY pair is currently consolidating just below the key 144.650 resistance, stuck within a tightening triangle structure. As markets await more clarity from both the Bank of Japan (BOJ) and the Fed, price action is showing signs of indecision — but pressure is building.
🌐 Macro & Sentiment Overview
BOJ maintains a neutral stance: Despite growing speculation of a hawkish shift, the BOJ held rates steady, providing no strong forward guidance. Markets remain cautious.
US Dollar remains resilient amid stable bond yields and expectations that the Fed may delay rate cuts, adding short-term support to USDJPY.
Geopolitical risk is on the rise: Ongoing Middle East tensions are fueling safe-haven demand for JPY, capping bullish momentum.
🔍 Technical Setup (M30 Chart)
Price is trapped inside a symmetrical triangle, tightening between 144.652 resistance and 143.126 support.
EMA 13/34/89 are aligned bullishly, but EMA 200 (red) is acting as a dynamic ceiling near 144.300.
Key support zones:
144.071: Minor structural level and trendline test.
143.126: Major liquidity zone and untested demand.
🎯 Trade Scenarios
📉 Scenario 1 – Sell on Rejection at 144.652
Entry: 144.650–144.700
Stop Loss: 145.250
Take Profit: 144.071 → 143.600 → 143.126
Ideal if BOJ shifts tone or USD weakens post-Fed comments.
📈 Scenario 2 – Buy on Bullish Reaction at 143.126
Entry: 143.100–143.150
Stop Loss: 142.700
Take Profit: 143.600 → 144.071 → 144.650 → 145.200
Valid only with clear bullish confirmation on M15–M30 structure.
🧠 Final Thoughts
USDJPY is coiling tightly ahead of a potential breakout. Macro uncertainty from central banks, geopolitical instability, and upcoming CPI data make this week highly volatile. Instead of chasing, let price come to your zones and react accordingly.
🔔 Focus on structure, confirm with price action, and avoid emotional trades. Patience and discipline are key in this compression phase.

The Calm Before the Storm: All Eyes on UK CPI & Central BanksGBPUSD 17/06 – The Calm Before the Storm: All Eyes on UK CPI & Central Banks
The GBPUSD pair is coiling in a tight range near the mid-1.3500s as traders brace for two high-impact events: UK CPI data on Wednesday and interest rate decisions from both the Fed and BoE this week. Price remains supported above the 200 EMA and is compressing within a symmetrical triangle – typically a precursor to a major breakout.
📊 Macro & Fundamental Outlook
🔹 Federal Reserve (FOMC): Expected to hold rates steady, but growing anticipation of a dovish tilt toward September is weighing slightly on the USD.
🔹 Bank of England (BoE): Markets are pricing in deeper rate cuts following recent UK GDP weakness, pressuring the GBP in the short term.
🔹 Geopolitical Risks: Rising Middle East tensions are fuelling demand for USD as a safe haven, reinforcing its strength ahead of data events.
📝 Bottom Line: The CPI release could be the first trigger to shift GBPUSD’s current consolidation. A hot inflation print might push GBP higher; a miss could fuel further downside.
🔧 Technical Analysis (H1 Chart)
Price is ranging between 1.3535 (support) and 1.3609 (resistance)
EMAs 13/34 crossing below EMA 89 → signal of potential bearish continuation
Uptrend line from 1.3467 is still intact and acting as dynamic support
Break below 1.3559 may lead to a move toward 1.3495 and 1.3467
A confirmed breakout above 1.3609 opens the door to 1.3630+
🎯 Trade Scenarios
Scenario 1 – Buy from Trendline Support
Buy Zone: 1.3495 – 1.3467
Stop Loss: 1.3440
Targets: 1.3535 → 1.3559 → 1.3596 → 1.3630
🟢 Best setup if price prints a bullish engulfing or hammer candle on key support + UK CPI surprise.
Scenario 2 – Sell on Resistance Rejection
Sell Zone: 1.3609 – 1.3630
Stop Loss: 1.3660
Targets: 1.3590 → 1.3559 → 1.3535 → 1.3495
🔴 Only valid with strong rejection signals + softer UK data or hawkish Fed tone.
💡 Market Sentiment
Retail traders are trapped in a waiting zone – expecting a breakout
Institutions may push price into one direction pre-data to collect liquidity
Risk appetite is fragile, and traders are cautious ahead of back-to-back central bank announcements
📌 Final Thoughts
GBPUSD is preparing for volatility. Instead of chasing moves, let the market come to your key zones and react with discipline. The 1.3467–1.3495 support area could be crucial for the next directional move.
Stay patient. Wait for confirmation. Respect your risk.
EURUSD – Healthy pullback within a strong uptrendEURUSD is undergoing a temporary correction after a strong bullish move, but the pair remains above key technical support levels such as the EMA34 and the ascending trendline. The 1.15070 zone now acts as a potential buy area—where demand may return if confirmation signals appear.
Market sentiment is leaning toward the expectation that the Fed may cut interest rates soon due to weaker-than-expected U.S. retail sales data, which has weighed on the USD and indirectly supported the euro. Meanwhile, the ECB continues to maintain a stable policy stance, further reinforcing the current bullish trend.
If the price holds above the green support zone, the next target could be around 1.15940. If this support breaks, traders should watch price behavior at the trendline before making the next trading decision.

Gold’s Game of Traps: Is the Dip a Setup for a Bigger Move? Gold’s Game of Traps: Is the Dip a Setup for a Bigger Move?
After an aggressive rally fueled by geopolitical FOMO headlines, gold (XAUUSD) saw a sudden pullback — but what looked like weakness might actually be a setup for smart accumulation. The market narrative is shifting, and price action is sending important signals...
🌍 Global Drivers Behind the Volatility
Middle East conflict between Israel and Iran continues to escalate, prompting global safe haven flows. Evacuation warnings and nuclear deal pressure add more uncertainty to the mix.
Despite bullish news, gold failed to hold its highs — a potential bull trap as institutional players took advantage of retail FOMO to offload.
Big capital may now be rotating from gold into other sectors like energy (oil) and discounted equity assets.
📉 Price Action & Technical Outlook (M30–H1)
After topping around 3442–3440, price snapped back into the mid-range — a sign of liquidity hunting rather than a full reversal.
The EMAs (13/34/89/200) on the M15–M30 timeframes are showing early signs of bearish crossover, hinting at further short-term weakness.
Below current price sits a clean Fair Value Gap (FVG) that could act as a magnet — aligning with a high-probability buy zone.
🎯 Trading Playbook
✅ BUY Setup – "Smart Money Entry Zone"
Buy Zone: 3342 – 3344
Stop Loss: 3338
Take Profit Targets:
→ 3348 → 3352 → 3356 → 3360
→ 3364 → 3368 → 3372 → 3380+
💡 Look for price to tap into the FVG and form a base with bullish confirmation (engulfing candle, divergence, or rising volume) before entering.
❌ SELL Setup – "Fade the Overhead Resistance"
Sell Zone: 3440 – 3442
Stop Loss: 3446
Take Profit Targets:
→ 3436 → 3432 → 3428 → 3424
→ 3420 → 3415 → 3410
⚠️ Only short on a strong rejection or bearish engulfing candle near the resistance — do not short blindly.
🧠 Market Psychology Insight
The initial Asian-session rally was likely a news-driven liquidity event.
Institutions appear to be rotating capital, using emotional retail entries as exit liquidity.
Current market conditions suggest a shakeout before a longer-term bullish move.
📌 Final Note
Don’t chase price. Let it come to your zones. This market is being driven by geopolitical narrative and smart money behavior, not just technicals alone.
✅ Stay patient.
📊 Trade with logic.
🧘♂️ Let others FOMO — you focus on levels and confirmation.
👉 Follow for real-time London session updates and reaction-based entries.

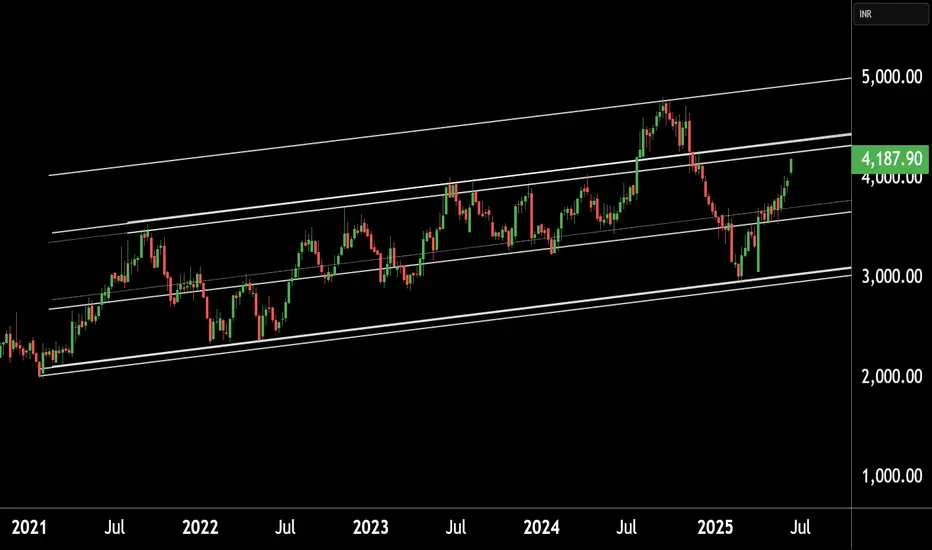
PI INDUSTRIES LTD at Key Resistance !!This is the Weekly chart of PI INDUSTRIES LTD.
PIIND having good law of polarity at 4300-4400 range.
If this level is sustain , then we may see lower prices in PIIND.
Thank You !!
[INTRADAY] #BANKNIFTY PE & CE Levels(17/06/2025)Today, Bank Nifty is expected to open flat near the 55,970 zone. The market has shown a steady recovery over the past few sessions, and now it stands near a crucial resistance level. If Bank Nifty manages to sustain above the 56,000–56,050 level after the opening, we may see bullish momentum picking up. This could lead to a move toward the higher levels of 56,250, 56,350, and even 56,450+ in the intraday session. A breakout above 56,050 with volume confirmation can act as a trigger for continued upside.
On the flip side, if Bank Nifty struggles to hold above 55,950 and slips below this level, it may face intraday selling pressure. A breakdown can drag the index back down toward 55,750 initially, followed by 55,650 and 55,550 if weakness persists. These levels will act as immediate support zones where short covering or fresh buying may be seen.
Overall, the index remains in a narrow range with critical levels on both ends. A directional move can emerge if either side breaks with strength. Traders should remain cautious and avoid aggressive positions near the opening. Trade with a strict stop loss and consider trailing profits once levels are achieved, as the market may remain choppy around key zones.

Nightly $SPY / $SPX Scenarios for June 17, 2025🔮 Nightly AMEX:SPY / SP:SPX Scenarios for June 17, 2025 🔮
🌍 Market-Moving News 🌍
📈 U.S. Retail Spending Holds Firm
May’s retail sales were flat month-over-month, defying expectations of a slowdown. Core retail sales (ex-autos) edged up +0.2%, signaling resilience in consumer purchases—an encouraging sign for economic momentum
🤖 Tesla’s Robotaxi Buzz Accelerates
Tesla stock surged after a weekend robotaxi video surfaced ahead of its planned Austin launch. A viral clip showed a Model Y “robotaxi” navigating traffic autonomously, sparking fresh investor enthusiasm despite safety debates
📊 BoJ Holds Rates; Dollar Edges Higher
Japan’s central bank left policy unchanged at 0.5%, maintaining its dovish bias. This lifted the dollar slightly versus the yen, drawing focus to global interest-rate divergence
📊 Key Data Releases 📊
📅 Tuesday, June 17:
8:30 AM ET – Retail Sales (May)
Consumer purchases are tracked, excluding autos. Monitor if activity stays steady despite inflation and rate pressures.
9:15 AM ET – Industrial Production & Capacity Utilization (May)
Provides insight into factory activity and plant usage—a gauge of economic health amid global slowdown concerns.
10:00 AM ET – Business Inventories (April)
Shows stock levels held by wholesalers and manufacturers. Higher inventories with weaker sales may signal slowing demand.
⚠️ Disclaimer:
This information is for educational and informational purposes only and should not be construed as financial advice. Always consult a licensed financial advisor before making investment decisions.
📌 #trading #stockmarket #economy #news #trendtao #charting #technicalanalysis

AUDJPY Potential UpsidesHey Traders, in today's trading session we are monitoring AUDJPY for a buying opportunity around 93.600 zone, AUDJPY is trading in an uptrend and currently is in a correction phase in which it is approaching the trend at 93.600 support and resistance area.
Trade safe, Joe.

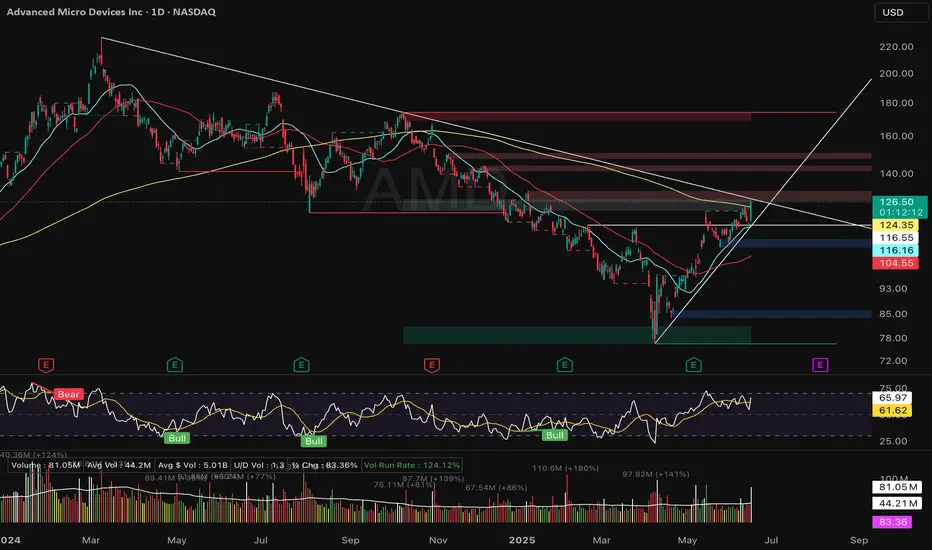
AMD – Breakout Watch (Daily Chart)NASDAQ:AMD surged +9.12% on June 16 with volume 1.8× above average, reclaiming the 200-day SMA for the first time in 7 months.
This marks a clear character change, but not yet a setup. Price stalled into multi-quarter trendline resistance around 128–130.
No pivot, no contraction — just strength into supply. Still needs to consolidate below trendline resistance for a valid trade.
Key Levels:
• Resistance: 130 / 145
• Support: 124.35 (breakout zone), 116.55 (MA stack)
• Watch for: Tight coil, volume dry-up, pivot pattern formation
Not chasing — watching for structure. Patience is a position.
📉 Weekly chart also reclaimed 30-week MA for the first time since Nov ’24.
#AMD #technicalanalysis #breakoutwatch #tradingview
HUGE $1.45 to $10.84 in hours +647% run with Double Buy! $SRMMentioned it in chat early premarket, then warned again as it started setting up. Buy Alert twice with $5.86 average price and waiting for the new highs blowout.
Huge win into the strong push 💸✈️ NASDAQ:SRM

Bitcoin Consolidates Near Highs — Bullish Wedge Signals StrengthHolding Strong Amid Uncertainty:
Despite rising geopolitical tensions, Bitcoin remains resilient, trading near recent highs. This stability reflects strong institutional confidence and sustained accumulation by long-term holders.
Bullish Technical Setup:
The ongoing consolidation between $100,000 and $110,000 is forming a wedge pattern—a classic bullish continuation structure. This suggests the market is coiling for its next major move.
Key Levels to Watch:
Immediate Resistance: $112,500
Support Zone: Holding above $100,000 keeps the bullish case intact
Measured Move Target: $130,000–$135,000
Outlook:
This tight consolidation signals a healthy pause in a strong uptrend, positioning Bitcoin for a potential breakout and continuation higher. All signs point to the bulls remaining firmly in control.
#Bitcoin #BTC #TechnicalAnalysis #BullishWedge #CryptoMarket #InstitutionalBuying #PriceAction #Geopolitics #SupportAndResistance #BullRun

XAUUSD 16 June – Liquidity Trap or Smart Money Rotation? XAUUSD 16 June – Liquidity Trap or Smart Money Rotation?
Gold surprised many traders with a sharp spike during the Asian session, only to reverse aggressively hours later. While headlines screamed “war” and panic, the price behavior told a different story—one of strategic distribution and smart money rotation...
🌍 Macro & Fundamental Context
Geopolitical triggers: Rising tensions in the Middle East (Israel-Iran) and political assassinations triggered emotional buying across safe-haven assets like gold and oil.
Institutional rotation: Major funds appear to be offloading gold positions to rebalance into equities (in correction) and oil (strong upside potential).
Market narrative: News-induced FOMO drives retail into overbought zones, allowing larger players to exit at premium prices.
📈 Technical Overview (M30 Structure)
Price Action: Gold tapped into major resistance at 3456–3458, showing an aggressive rejection shortly after.
EMA Behavior: EMAs (13/34/89/200) are flattening across M15 and M30—early signs of a possible bearish crossover.
Volume Drop: Declining volume after the spike suggests buyer exhaustion, reinforcing the idea of a bull trap.
Fair Value Gap (FVG): A visible liquidity void remains below the 3390 area. Price often returns to fill these zones.
🎯 Trading Plan for Today
✅ Scenario A: Buy from Demand Zone (Liquidity Fill)
Entry: 3383 – 3385
Stop Loss: 3377
Targets: 3386 → 3390 → 3394 → 3398 → 3402 → 3406 → 3410+
📌 Best executed during London or NY session if price shows absorption or reversal confirmation.
❌ Scenario B: Sell from Resistance Only on Clear Rejection
Entry: 3456 – 3458
Stop Loss: 3462
Targets: 3452 → 3448 → 3444 → 3440 → 3435 → 3430
⚠️ Only enter shorts if clear bearish engulfing or pin-bar setup forms near resistance zone.
🧠 Market Psychology
Retail FOMO is being exploited by larger players to exit risk positions.
Liquidity engineering is likely in play—smart money drives price up on headlines, then exits into buyer momentum.
Equity & Oil rotation signals a shift in institutional preference short-term.
📌 Final Thoughts
This isn’t a time to chase breakouts. Gold is entering a volatile re-accumulation phase where news is being weaponized to induce emotional trading. The real edge lies in waiting for price to come to your level and only executing with confirmation.
🎯 Zone to Watch: 3383 – 3385
📉 Avoid chasing moves
📊 Respect your SL & manage risk like a pro
—
🧭 Stay patient. The next big move will reward those with discipline and timing.
