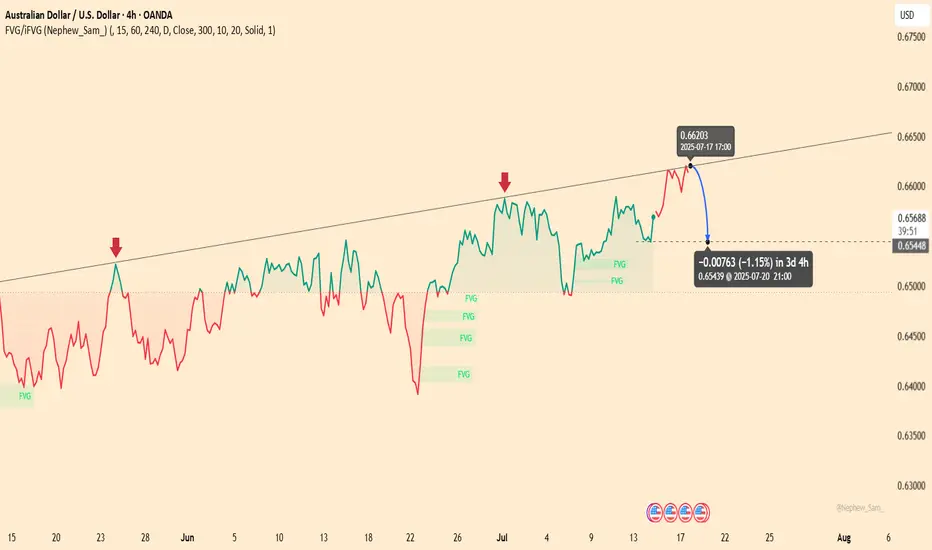
AUDUSD – Mild rebound, downside risk aheadAUDUSD is approaching a key trendline resistance after a short-term recovery. However, repeated rejections at this level in the past suggest a potential reversal is forming. The current structure mirrors previous setups – a mild rally into the trendline followed by weakness.
On the news front, recent U.S. economic data has supported the dollar, particularly stable job numbers and consumer confidence. Meanwhile, the market is awaiting the upcoming FOMC meeting minutes and Australia’s CPI report. Without a surprise boost from AUD fundamentals, the pair could face renewed downward pressure in the coming sessions.
Technical Analysis
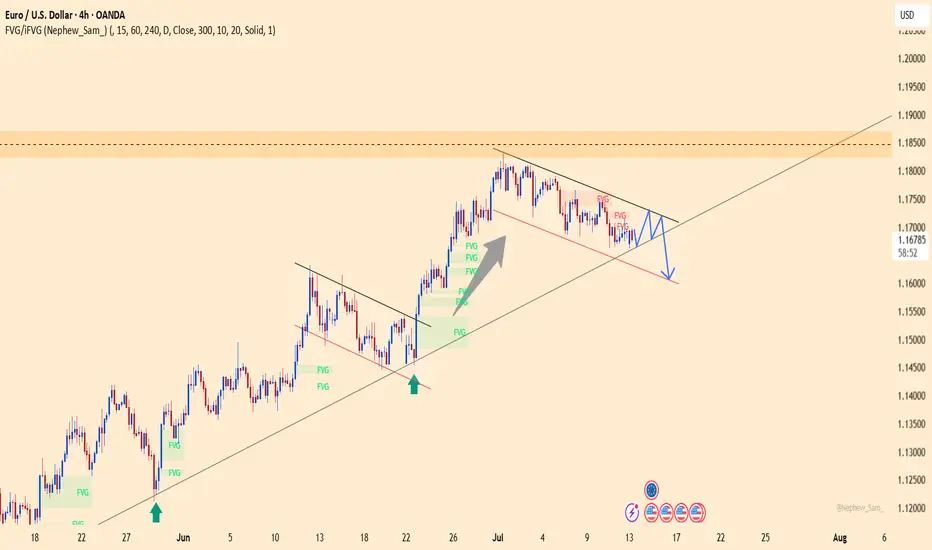
EURUSD – Bearish Pressure Mounts Ahead of Triangle Breakout EURUSD is trading within a contracting triangle and currently leans toward a bearish bias. After several failed attempts to break the upper boundary, momentum is weakening, and the pair is showing signs of a potential breakdown toward lower support levels.
With several key events ahead, the euro may face additional pressure if upcoming Eurozone inflation data disappoints or if the Fed maintains a hawkish tone through upcoming speeches by U.S. officials. Unless there is a strong bullish catalyst, EURUSD is likely to correct further to the downside.
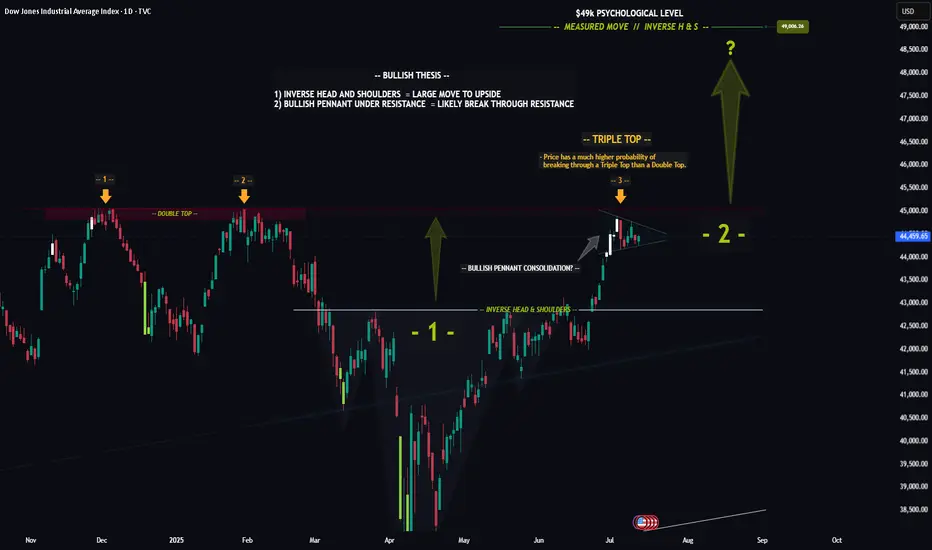
DOW (DJI) -- Preparing For The Next Big Move?Hello Traders!
The chart of the DOW is really quite incredible... Recently price formed a textbook Inverse Head & Shoulders pattern, which led to a nice nearly to the all time high. Furthermore price looks to be consolidating in a Bullish Pennant just below the all time high resistance level.
The reason the Pennant below resistance is so significant is because this signals that investors are likely preparing to drive price higher to new highs. Think about it like a fighter resting before the next big fight.
Triple Top: In addition to the pennant price has now hit this resistance level for the 3rd time. The more times price hits a level typically the weaker it gets. After the 3rd hit the chance of a breakout increases dramatically.
In Summary: The "Triple Top" in conjunction with the "Bullish Pennant" means that there is undoubtedly a very high probability that price will breakout and make new all time highs.
This post is primarily meant to be educational vs a trade idea. Its charts like this that invigorate my technical analysis side and I hope it does for you as well.
Best of luck on your trading journey!
EURAUD – Bearish Flag Breakdown OpportunityThe EURAUD pair is showing signs of trend continuation via a classic bearish flag pattern formation. After a sharp decline, the market has entered into a tight consolidation channel, climbing steadily inside a sloped flag structure. Price is now testing a critical resistance area near 1.7830–1.7840 while hovering just below the 200 EMA.
This setup offers a high-probability sell opportunity — but only after confirmation.
1. Structure Overview
The initial sharp downtrend is followed by a consolidation channel — a textbook bearish flag.
Price is approaching major resistance (1.7830–1.7840) and 200 EMA, acting as a ceiling.
A breakdown from the rising support of the flag is expected to trigger a continuation toward the downside.
2. Trade Plan – Bearish Flag Breakdown
✅ Entry Plan:
Wait for a breakdown of the green support trendline (flag support).
Then, wait for a re-test of the broken support (now resistance).
Enter short only after a bearish candlestick confirmation (e.g., bearish engulfing or rejection wick) on the 15-min or 1-hour chart.
🛡️ Stop Loss:
Place the stop loss just above the major resistance zone, around 1.7835–1.7840.
🎯 Target Zones:
Target 1 (TG1): 1.7755
Target 2 (TG2): 1.7718
Final Target: 1.7632
Risk/Reward Ratio: 1:2, 1:4, 1:9.4+
3. Why This Trade Makes Sense
Bearish Flag is a reliable continuation pattern in strong downtrends.
Price is failing to break above key resistance and 200 EMA.
The flag offers a tight SL and large downside potential — ideal conditions for R:R setups.
Confluence of structure, pattern, and trend all align for short bias.
4. Trade Management Tips
Scale out partial profits at TG1 and TG2, and trail stop for final target.
If breakdown fails, avoid chasing price — re-evaluate bias if price breaks above 1.7840.
5. Final Thoughts
This EURAUD chart is a textbook case of pattern + price action + resistance confluence. The flag structure is well-defined, and the reward-to-risk ratio is significantly favorable if the breakdown confirms.
📌 Watch for:
Breakdown of rising support
Retest and bearish candle
Entry only on confirmation
High-probability setups don’t require prediction — they require preparation.
=================================================================
Disclosure: I am part of Trade Nation's Influencer program and receive a monthly fee for using their TradingView charts in my analysis.
=================================================================

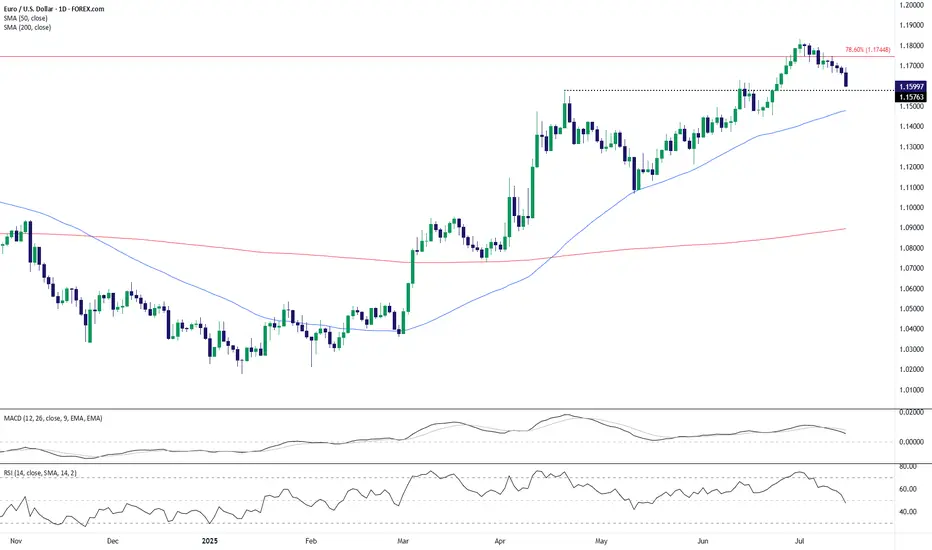
EUR/USD Technical Outlook: Bearish Momentum Builds Below Key ResEUR/USD has broken down from its recent highs near the 1.1750 resistance area, which coincides with the 78.6% Fibonacci retracement level. The pair is now trading around the 1.1600 handle, slipping below a short-term support zone near 1.1576. This breakdown signals potential continuation of bearish pressure in the coming sessions.
The 50-day SMA (1.1477) remains upward sloping, but the price action has now decisively turned lower, with a series of lower highs forming after the July peak. The MACD histogram is fading, indicating waning bullish momentum, and the RSI has dropped to 47.7—losing the bullish bias and heading toward bearish territory.
If EUR/USD cannot reclaim the 1.1576–1.1600 zone quickly, a deeper pullback toward the 50-day SMA or even the 1.1450–1.1500 range may unfold. On the upside, bulls would need to push back above the 1.1750 resistance to regain control, but given the loss of momentum and structure, the near-term bias favors the bears.
-MW
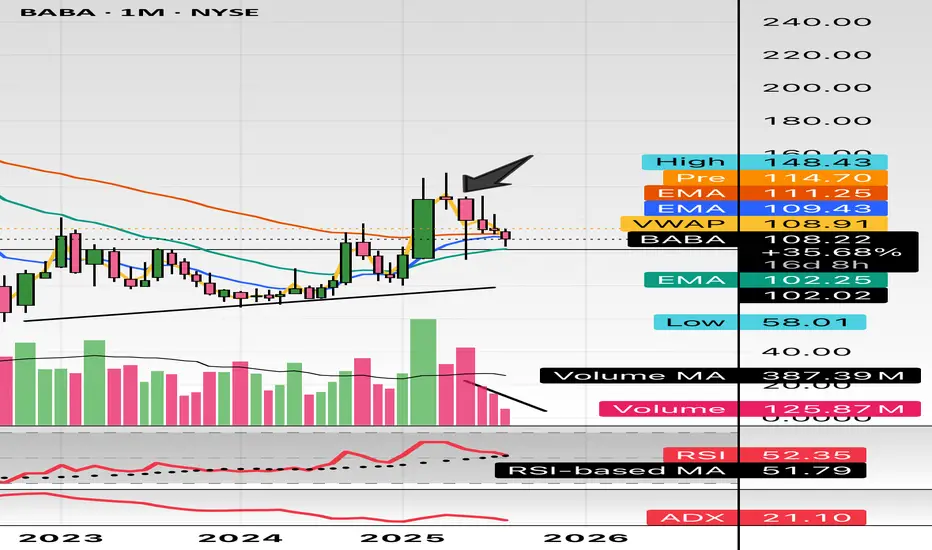
$BABA don’t miss this milky bottle. Called this out at $105 in minds. This Monthly declining volume, support at $100, and uptrend pattern. China will boom into the end of Q3 and early 2026. Target is $180 and $200.
WSL.
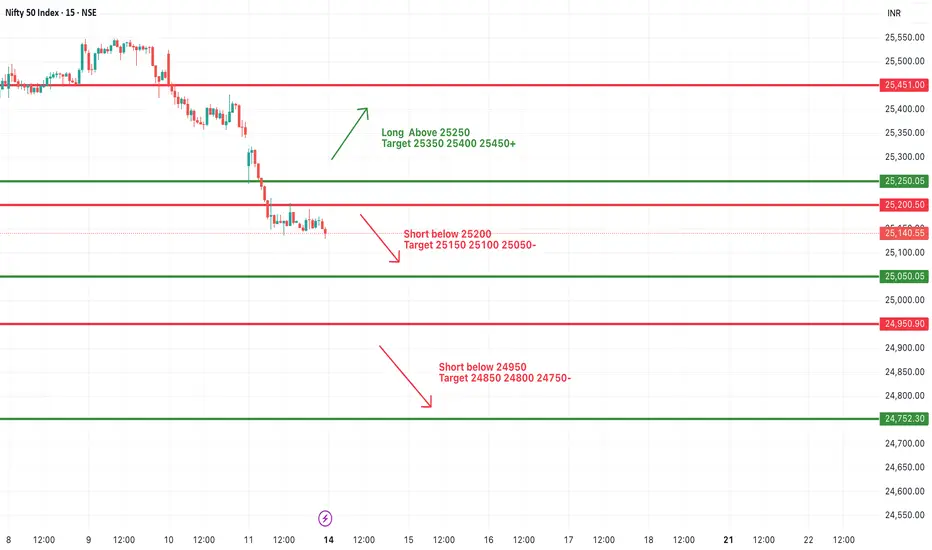
#NIFTY Intraday Support and Resistance Levels - 14/07/2025Nifty is expected to open slightly gap-down after consistent bearish momentum in the previous sessions. The index is hovering near 25140, and immediate support lies around the 25200 level. A breakdown below this level could lead to further downside pressure, with key support targets at 25150, 25100, and 25050.
If the index breaks and sustains below 24950, it may trigger a deeper correction toward the next support levels at 24850, 24800, and 24750. These zones should be watched closely for potential reversals or continuation of bearish momentum.
On the upside, any recovery and sustained move above the 25250 level may lead to a pullback rally. In that scenario, immediate resistance levels to watch would be 25350, 25400, and 25450+.
Intraday structure remains weak unless Nifty reclaims the 25250+ zone with strength. Price action near the 25200–25050 support range will be crucial in deciding the direction of the day.
#SENSEX Intraday Support and Resistance Levels - 14/07/2025Sensex is likely to open slightly gap-down, reflecting weakness carried over from the previous session. The index is currently trading near the 82450 zone. A breakdown below the 82400 level may trigger further downside movement, with potential support targets at 82200, 82100, and 82000. This zone should be monitored closely for continuation or reversal.
On the upside, any strong recovery above the 82600–82650 level could push the index higher, with resistance targets at 82800, 82900, and 83000+. Sustaining above this range may indicate buying interest returning in the market.
If Sensex spikes toward the 82950–83000 zone and faces resistance, a reversal from there could create shorting opportunities with targets at 82800, 82700, and 82600. However, a clear breakout above 83000 would negate this short setup and shift the bias to bullish.
The index is currently in a consolidation zone, and price action around 82600–82400 will be critical to determine the day’s direction.

USDJPY 1H - market buy with a confirmed structureThe price has bounced from a key support zone and is showing early signs of recovery. A clear base has formed, and the MA50 is starting to turn upward, indicating a shift in short-term momentum. While the MA200 remains above the price, the overall structure suggests a potential continuation of the bullish move.
Trade #1 — entry at market, target: 145.939, stop below recent local low.
Trade #2 — entry after breakout and retest of 145.939, target: 148.000, stop below the retest zone.
Volume has stabilized, and the reaction from support is clear. As long as price holds above the last swing low, buying remains the preferred strategy.

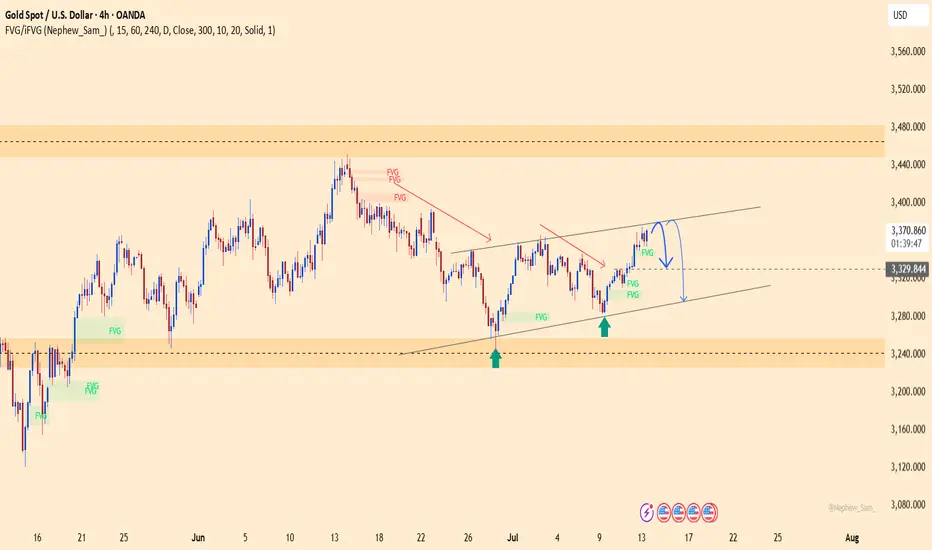
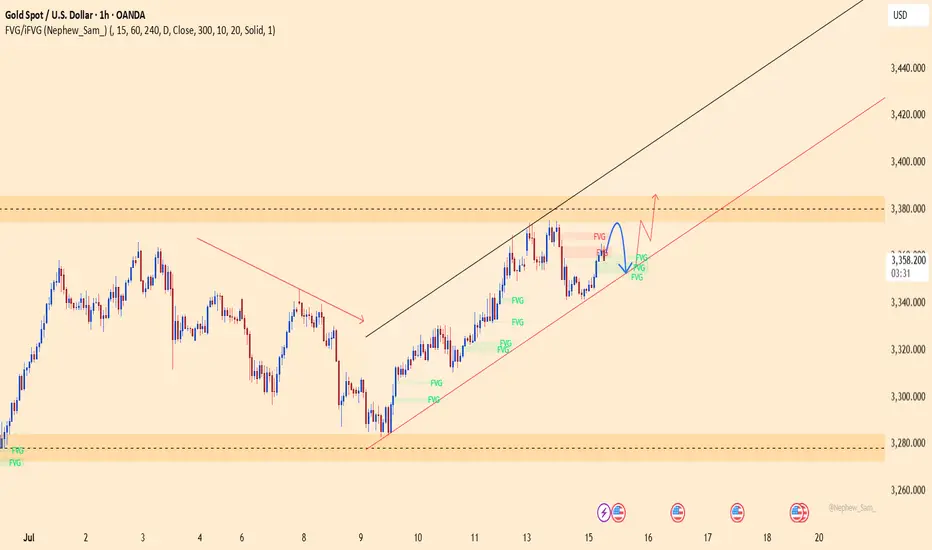
Early Week Pullback Ahead of Key Economic ReleasesGold Outlook – 14 July | Early Week Pullback Ahead of Key Economic Releases
🌍 Market Sentiment & Macro Overview
Gold has started the week with a sharp retracement after filling prior liquidity gaps (FVG) from the past two weeks.
This early weakness signals a risk-off tone as traders adopt a cautious stance ahead of a heavy macroeconomic calendar and geopolitical trade discussions.
This week’s high-impact events include:
📌 US CPI (Inflation Data)
📌 US PPI (Producer Prices)
📌 Unemployment Claims
📌 Retail Sales Figures
These data points will likely set the tone for price action through the second half of the week, with potential for sharp moves in gold.
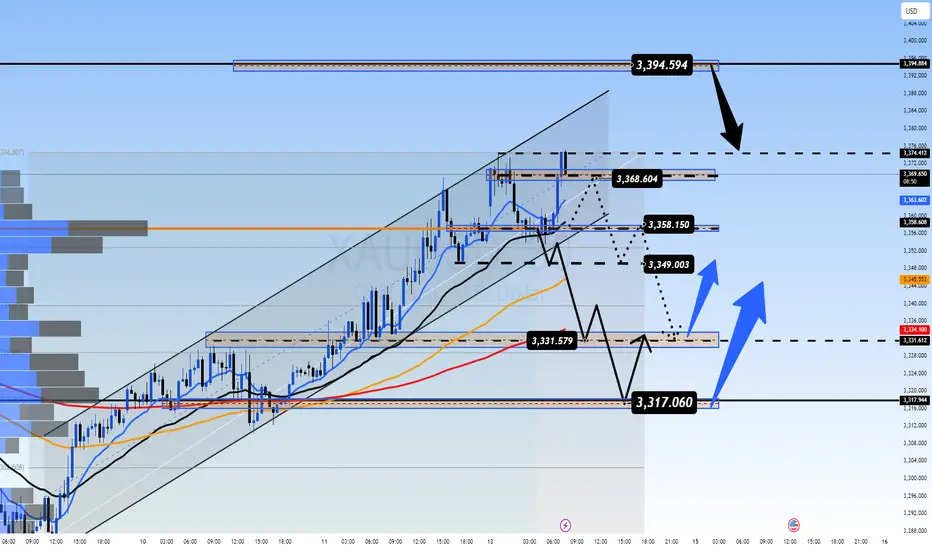
📉 Technical Snapshot – M30 Chart Structure
Price swept minor liquidity above recent highs
Pulled back by more than $15 from the short-term top
Currently trading below the intraday VPOC (~3358), suggesting short-term bearish momentum
If the selling pressure holds, we may see a move toward:
⚠️ 333x zone — initial liquidity pool
❗ 332x zone — deeper liquidity grab before any bullish reversal
🧭 Trading Plan – Key Zones and Setup
📥 Buy Setup: 3331 – 3329 (Zone of Interest)
Stop Loss: 3325
Target Levels:
TP1: 3335
TP2: 3340
TP3: 3344
TP4: 3350
TP5: 3360 – 3370
✅ A highly reactive zone — ideal for intraday long setups if price sweeps into this area and shows bullish confirmation (e.g., volume spike or rejection wick).
📤 Sell Setup: 3393 – 3395 (Resistance Re-Test)
Stop Loss: 3399
Target Levels:
TP1: 3390
TP2: 3386
TP3: 3382
TP4: 3378
TP5: 3374 – 3370 – 3360
📉 Potential scalp zone if price retests resistance with signs of exhaustion. Monitor closely for bearish structure confirmation.
📊 Key Support & Resistance Levels
Resistance Zones:
3358
3368
3374
3394
Support Zones:
3349
3340
3331
3318
These zones remain relevant for both momentum trades and reversion setups.
⚠️ Strategy Considerations
At the time of writing, gold is trading indecisively around the M30 VPOC. No clear breakout has occurred yet.
⏳ Wait for volume confirmation during the London session
🚫 Avoid impulsive entries based on emotions or FOMO
✅ Stick to your risk parameters and let price come to your level
🧠 Summary & Bias
Gold is experiencing an early-week technical correction after recent strength.
The market is in "wait-and-see" mode, with macro drivers likely to dictate direction from mid-week onwards.
📍 Watch the 3331–3329 zone closely — it remains the most attractive level for long setups.
📍 The 3393–3395 zone is a key area to fade strength if price struggles at resistance.
Patience and precision are key this week. Let the market reveal its intention, and trade accordingly.
XAUUSD – Topping Out, Correction Pressure MountsGold prices are stalling after approaching the key resistance at $3,381, precisely at the upper boundary of the short-term ascending channel. The bullish momentum is fading as the USD and U.S. bond yields remain firm, supported by stable jobs data and a lack of clear rate guidance from the Fed.
Additionally, the World Gold Council (WGC) has warned of medium-term correction risks if geopolitical tensions ease or the dollar continues to strengthen — prompting buyers to stay cautious. In the near term, XAUUSD may pull back toward the $3,295 support zone before the market defines its next direction.
ACC Trade Setup for the Week(14–18 July 2025) – Uptrend ChannelACC Ltd. (NSE: ACC) has been trading inside a clean uptrend channel for the past few weeks, bouncing consistently between rising support and resistance. Now, it approaches a critical inflection point — the lower support of the channel.
While no breakdown has occurred yet, the structure is weakening, and a bearish opportunity may soon present itself. Let’s explore how to trade this if the setup confirms.
1. What’s Happening on the Chart?
ACC is trading close to the channel support zone (~₹1975).
The resistance zone near ₹2000–₹2020 has held strong.
A potential breakdown below the rising green support trendline could trigger a bearish move toward the ₹1910–₹1920 demand zone.
But nothing is confirmed yet — this is a watchlist setup.
2. Trade Setup – Conditional Bearish Opportunity
✅ Trade Plan:
Wait for breakdown of the rising support line.
After breakdown, wait for a re-test of the broken support zone (~₹1975–₹1980).
Look for bearish confirmation via a candlestick pattern (engulfing or strong rejection) on the 15-min or 1-hour timeframe.
🚨 Entry Trigger:
Only enter short if re-test holds and price starts reversing.
📉 Stop Loss:
SL should be above the re-test high (around ₹1990–₹1995).
🎯 Target:
Profit booking zone: ₹1910–₹1920.
Potential R:R: 1:2, 1:3, or even 1:4 depending on entry.
3. Why This Setup Matters
Trend exhaustion is visible near the upper resistance of the channel.
A clean breakdown + re-test gives a low-risk entry.
The 200 EMA lies near the target zone, providing confluence for mean reversion.
4. What If There’s No Breakdown?
If price respects the support and bounces again, no trade should be taken on the short side.
In that case, look for possible bullish reversal signals back toward channel resistance — or stay neutral.
5. Final Thoughts
This is a highly conditional setup — and patience is the key. Don’t jump the gun. The best trades happen after confirmation.
🔔 What to watch this week:
Breakdown below ₹1975 support
Re-test and rejection from ₹1975–₹1985
Confirmation candle (bearish engulfing)
Only then consider a short trade toward ₹1910 with a well-placed SL.
Plan your trade. Wait for structure. Trade only when the market shows its hand.

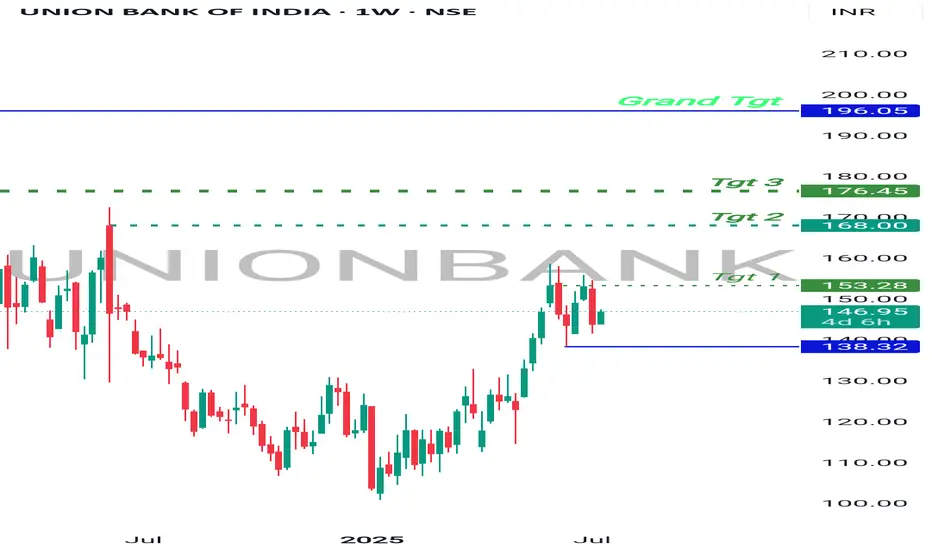
Bullish Bet , UnionBankBanknifty at support.
UnionBank on recent high making sideways moves, which means consolidation.
Once Banknifty Bounce back, UnionBank will break the resistance on weekly and monthly Basis and will start moving higher.
It has higher targets on a short and long term investment.
Good to hold for short term.
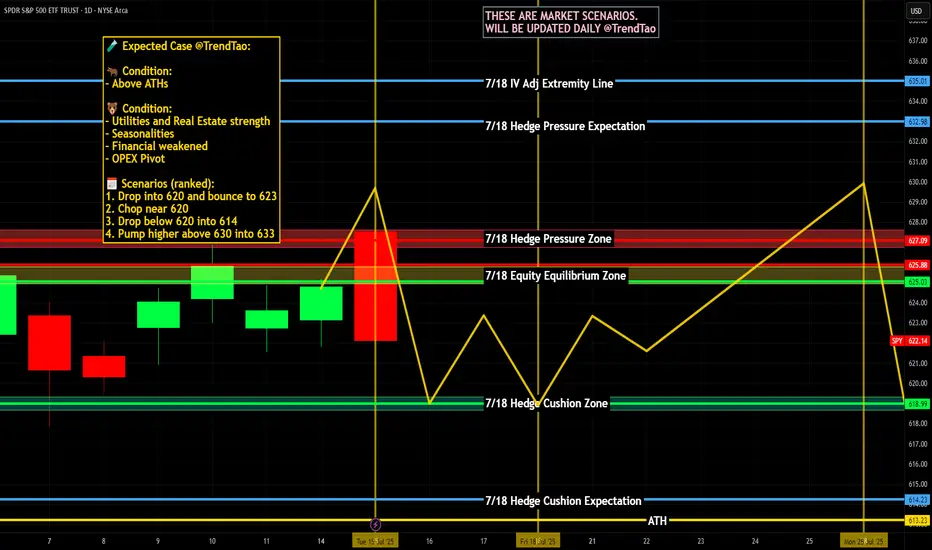
Nightly $SPY / $SPX Scenarios for July 16, 2025 🔮 Nightly AMEX:SPY / SP:SPX Scenarios for July 16, 2025 🔮
🌍 Market-Moving News 🌍
📈 Record Bullish Sentiment Signals Rotation
Bank of America reports the most bullish fund-manager sentiment since February. With 81% expecting one or two Fed rate cuts this year, the group sees a rotation strategy replacing outright selling, with investors tipping toward sector shifts over wholesale exits
⚠️ Trump’s Fed Attacks Stir Policy Concerns
President Trump’s public criticism of Fed Chair Powell—calling for steep rate cuts and threatening removal—has raised market alarms over the central bank’s independence. Analysts warn such interference could destabilize confidence in U.S. monetary policy
🏦 Banks Prepare for Earnings Surge
Major U.S. banks are expected to report strong Q2 results this week. Enhanced trading and investment banking revenues are forecasted to offset economic uncertainties tied to tariffs
📡 Nvidia CEO to Visit Beijing
Jensen Huang is set to hold a high-profile media briefing in Beijing on July 16, signaling continued emphasis on China for Nvidia despite U.S. export restrictions—potentially a key narrative for tech markets
📊 Key Data Releases & Events 📊
📅 Wednesday, July 16:
8:30 AM ET – Producer Price Index (June)
Gauges wholesale inflation pressures; June expected +0.2% MoM vs May’s +0.1%
9:15 AM ET – Industrial Production & Capacity Utilization (June)
Monitors factory and utilities output and usage rates—key for industrial-sector health
Jensen Huang in Beijing
Nvidia CEO to lead media briefing in Beijing—a potential market mover for chipmaking and AI sectors
⚠️ Disclaimer:
This info is for educational purposes only—not financial advice. Consult a licensed professional before making investment decisions.
📌 #trading #stockmarket #inflation #Fed #tech #industrial #PPI
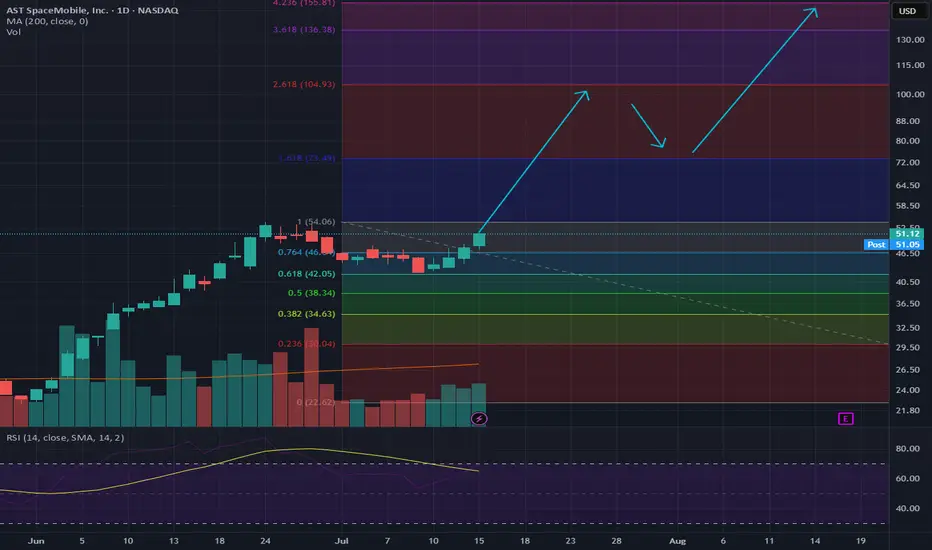
LONG-TERM $ASTSYou can't spell Sats without ASTS
This will be a trillion dollar company - here's the next few years, cheers!
BITCOIN PULLBACK 110.000🔹 The uptrend remains intact
After setting a new high, the price may enter a mild correction toward the $110K zone.
Key support levels in this uptrend are:
✅ $115K
✅ $110K
✅ $105K
As long as the price holds above $105K, any pullback is considered healthy and the uptrend is likely to continue.
📊 A shallow correction is part of a healthy market structure.

CRV ANALYSIS🔮 #CRV Analysis 💰💰
🌟🚀 As we can see that #CRV is trading in a symmetrical triangle and given a perfect breakout. But there is an instant resistance. If #CRV breaks the resistance 1 then we will see a good bullish move in few days . 🚀🚀
🔖 Current Price: $0.7280
⏳ Target Price: $1.0800
#CRV #Cryptocurrency #DYOR

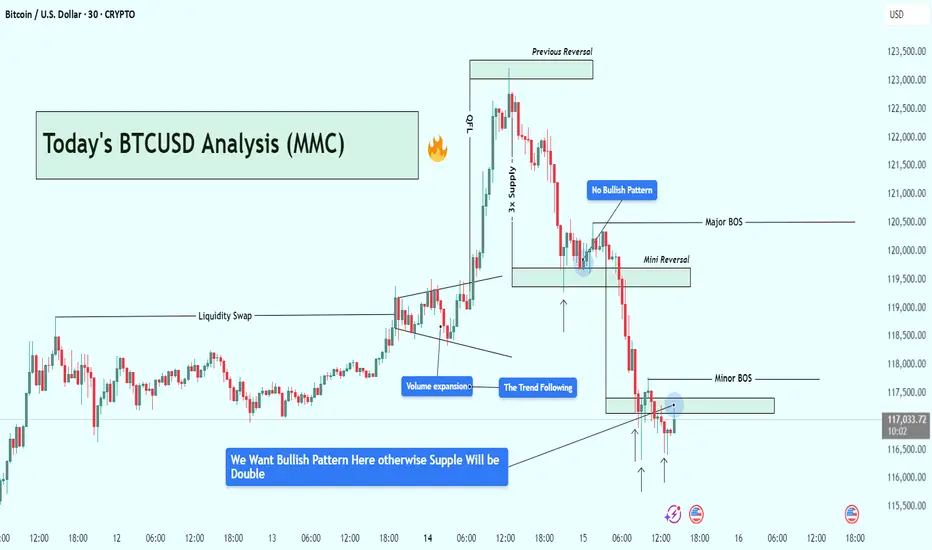
BTCUSD Analysis : Bitcoin Trend Shifted/Bullish Pattern + Target🧭 Overview:
Bitcoin’s recent price action has delivered a textbook sequence of institutional liquidity play, volume-driven breakout, and supply zone rejection. After rallying on increasing volume, BTC tapped into a significant 3x Supply Zone—which also served as a previous reversal point—and was swiftly rejected. The market is now trading around a key decision zone where traders must stay alert for a confirmed bullish reversal, or risk getting caught in further downside.
🔍 Step-by-Step Technical Breakdown:
🔸 Liquidity Grab + Volume Expansion
The move began with a liquidity sweep, as BTC pushed above recent highs, hunting stop-losses and inducing breakout traders. This kind of price manipulation is typical of smart money accumulation/distribution zones.
Immediately following that, we observed a volume expansion—a strong signal that institutional players had stepped in, propelling BTC upward with conviction. This expansion pushed price sharply into the 3x Supply Zone, a critical zone of interest from a previous bearish reversal.
🔸 3x Supply Zone – The Turning Point
Once price entered the 3x Supply Zone, bearish pressure resumed. No bullish continuation pattern appeared on the second attempt into this zone—confirming that sellers were defending it aggressively. This area has now been validated as a strong supply barrier, capable of initiating trend reversals.
🔸 Major BOS – Structural Shift Confirmed
Price broke below key support around $120,500, which marked a Major Break of Structure (BOS). This BOS is crucial—it represents a shift from a bullish to bearish market structure and is often the signal that retail longs are trapped.
This BOS was followed by a mini reversal zone, but again, no bullish confirmation appeared there—highlighting market weakness.
🔸 Minor BOS & Trendline Breakdown
Further downside action led to a Minor BOS near $117,800, reinforcing the bearish sentiment. Additionally, the ascending trendline—which had supported BTC’s rally—was decisively broken and retested from below. This confirms a shift in momentum, now favoring sellers.
📍 Current Price Action – Critical Decision Zone
BTC is currently hovering around $117,000, right at a potential demand zone. While there was a brief bullish reaction, the market hasn’t formed a valid bullish reversal pattern yet.
There’s a clear message from the chart:
“We want a bullish pattern here—otherwise, support will break and supply will double.”
In simple terms, unless bulls step in with structure (higher low, engulfing candle, etc.), sellers will likely take over, and price may test deeper support levels.
🎯 What to Watch Next:
✅ Bullish Case:
If BTC forms a strong reversal pattern (e.g., double bottom, bullish engulfing, or inverse head & shoulders), we can expect a short-term recovery back to:
Target 1: $118,500
Target 2: $120,000–$120,500
❌ Bearish Case:
Failure to hold this zone and no clear bullish pattern = likely continuation to the downside, potentially targeting:
$116,000
Even $114,500 in extended moves
🧠 Trading Insights (Educational):
Volume + Structure = Edge
Don’t rely solely on candlestick signals—combine them with structural breaks and volume to get confluence.
Supply Zones Aren’t Just Rectangles
The 3x Supply Zone was powerful because it had historical context, volume convergence, and psychological resistance. These layered factors make zones more reliable.
BOS Isn’t a Trendline Break
BOS means real structural shift. In this case, lower highs and lower lows confirmed the change.
💡 Final Thoughts:
BTC is at a make-or-break level. The recent rejection at the 3x supply zone has shifted the momentum, and buyers must prove their strength now—or risk watching the price unravel further.
Stay patient, wait for structure, and never fight momentum.
Technical Analysis Forecast for NIFTY50 (25,191) (UTC+4) 1:11PM
1. Candlestick Patterns
Recent Structure:
If NIFTY50 closed near 25,191 with a long upper wick (shooting star/gravestone doji), it signals rejection at higher levels → bearish reversal potential.
A bullish engulfing/marubozu candle would indicate strength → upside continuation.
Key Observation: Watch for confirmation candles. A close below 25,000 invalidates bullishness.
2. Harmonic Patterns
Potential Setups:
Bullish Bat Pattern: If 25,191 aligns with the 0.886 retracement of a prior up-move (e.g., 24,800 → 25,191), it suggests a reversal zone for longs.
Bearish Crab: If 25,191 is the 1.618 extension of a prior swing, expect resistance → pullback to 24,900-25,000.
Action: Validate with Fibonacci levels. Break above 25,250 negates bearish harmonics.
3. Elliott Wave Theory
Wave Count:
Scenario 1 (Bullish): If in Wave 3 (impulse), 25,191 could extend to 25,500 (Wave 3 = 1.618x Wave 1).
Scenario 2 (Bearish): If in Wave B (corrective), 25,191 may peak → Wave C drop to 24,600 (Wave A = Wave C).
Confirmation: A break below 24,950 supports Wave C; hold above 25,100 favors Wave 3.
4. Wyckoff Method
Phase Analysis:
Distribution?: If volume spiked at 25,191 without further upside, it suggests "upthrust" (smart money exiting) → downside to 24,700 (accumulation zone).
Re-accumulation?: If consolidating near 25,191 on low volume, expect breakout toward 25,400.
Key Sign: Watch for springs (false breakdowns) or upthrusts (false breakouts).
5. W.D. Gann Theory
Price & Time Squaring:
25,191 is near 25,200 (a Gann square number). Close above 25,200 opens 25,500 (next resistance).
Time Cycle: July 15–20 is a potential turning window (watch for reversals).
Gann Angle: Trade above 1x1 angle (e.g., 45° from June low) = bullish momentum.
6. Indicator Synthesis (RSI + BB + VWAP)
RSI (14-period):
>70: Overbought → pullback likely if diverging (e.g., price highs ↑, RSI ↓).
<50: Loss of momentum → risk of deeper correction.
Bollinger Bands (20,2):
Price near upper band → overextended → mean-reversion to middle band (25,000) possible.
"Squeeze" (narrow bands) → impending volatility breakout.
VWAP (Daily):
Price above VWAP = intraday bullish bias. A dip to VWAP (~24,950) is a buy opportunity.
Price below VWAP = bearish control → sell rallies.
Intraday/Swing Outlook
Bullish Case (Hold above 25,100):
Target: 25,400 (Elliott Wave 3 + Gann resistance).
Trigger: Bullish candle close + RSI holding 60.
Bearish Case (Break below 25,000):
Target: 24,700 (Wyckoff accumulation + BB lower band).
Trigger: Bearish harmonic confirmation + RSI divergence.
Key Levels
Type Level Significance
Support 25,000 Psychological + BB middle band
24,700 Wyckoff accumulation zone
Resistance 25,191-25,200 Current price + Gann square
25,400 Elliott Wave 3 target
Trading Strategy
Intraday:
Long if holds 25,050-25,100 with RSI >50. Stop loss: 24,950. Target: 25,250.
Short if breaks 25,000 on high volume. Stop loss: 25,150. Target: 24,800.
Swing:
Wait for daily close above 25,200 (bullish) or below 24,950 (bearish).
Hedge with options: Buy 25,200 Calls + 25,000 Puts for volatility breakout.
Conclusion
25,191 is a pivotal level. The confluence of:
Harmonic resistance + Gann square at 25,200,
RSI near overbought territory,
Price testing BB upper band,
suggests short-term consolidation/pullback is likely. However, a daily close above 25,200 ignites bullish momentum toward 25,500. Trade the breakout/breakdown with confirmation.
*Disclaimer: This analysis is time-sensitive (as of July 15, 2025). Monitor real-time volume/price action for validation.*
For those interested in further developing their trading skills based on these types of analyses, consider exploring the mentoring program offered by Shunya Trade.
I welcome your feedback on this analysis, as it will inform and enhance my future work.
Regards,
Shunya Trade
⚠️ Disclaimer: This post is educational content and does not constitute investment advice, financial advice, or trading recommendations. The views expressed here are based on technical analysis and are shared solely for informational purposes. The stock market is subject to risks, including capital loss, and readers should exercise due diligence before investing. We do not take responsibility for decisions made based on this content. Consult a certified financial advisor for personalized guidance.

Falling Wedge Formation Ive been bullish on GBPJPY for a couple weeks now and I still believe that it has more upside potential. Here we have a Falling Wedge Formation. we have 4 touches on our pattern already and just waiting for a break and retest to enter again. I am currently in a position based of the retest price gave of the previous resistance (circled on chart). Lets see how it goes.

Gold set to surge? XAUUSD is holding firmly within a clear ascending channel on the H1 chart. After a strong rally, price is showing signs of a minor pullback toward the trendline support – potentially the last chance for buyers before gold accelerates toward the upper resistance zone.
On the news front, lower-than-expected U.S. producer inflation data has weakened the dollar, increasing gold’s appeal as a safe haven. In the coming days, key economic events like retail sales and comments from the Fed could serve as catalysts for the next bullish leg.
[INTRADAY] #BANKNIFTY PE & CE Levels(15/07/2025)Bank Nifty is expected to open with a gap-up near the 56950 zone. If the index sustains below the 56900–56950 resistance range after the initial up-move, it could face selling pressure. A downside move from this level may trigger a correction toward the 56750, 56650, and 56550 zones. This level becomes a key intraday resistance.
On the downside, a breakdown below the 56650 level could intensify selling, leading to further downside targets of 56250, 56150, and 56050. This zone must be monitored closely as it holds short-term support strength. A decisive move below 56650 will shift sentiment bearish for the session.
On the other hand, a breakout and sustained move above 57100 could attract bullish momentum and may lead to upside targets of 57250, 57350, and even 57450+. Price action around the 57000–57100 mark will be crucial to determine any bullish continuation.
Overall, today's session is expected to open strong but watch for follow-through near the key zones. Traders should remain cautious and wait for confirmation around 56900–57100 for direction clarity.

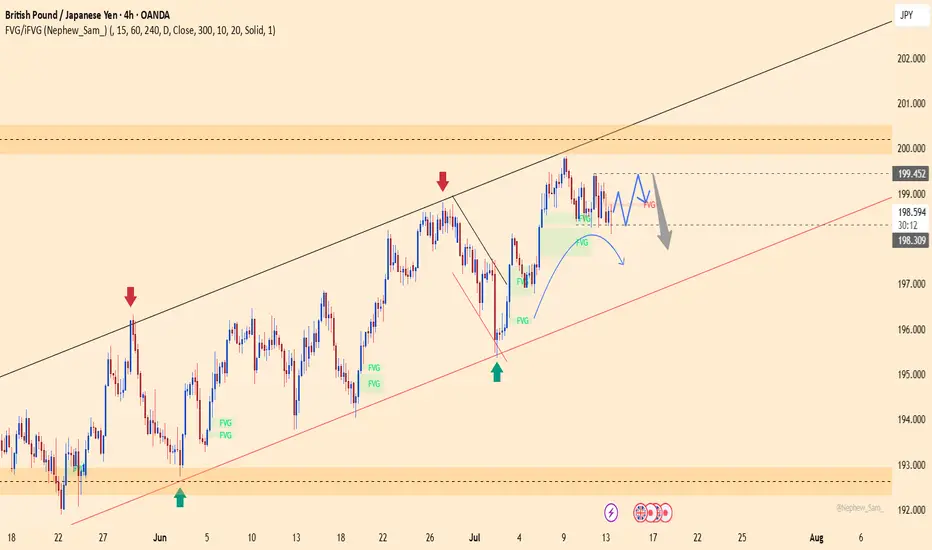
GBPJPY: Downside Pressure Increasing - Sell Opportunity!GBPJPY is showing clear signs of weakness, currently trading around 198.620. If it breaks and holds below 198.300, the bearish trend will be confirmed, with the next potential target at 192.000.
Upcoming key economic news from the UK (inflation, retail sales) and Japan (BOJ policy) will be decisive. Prioritize selling strategies, monitor news closely, and manage risk tightly.