EUR/USD Pressured by Safe-Haven Dollar DemandEUR/USD traded near 1.15 on Wednesday, under pressure from safe-haven demand for the U.S. dollar as Middle East tensions escalated. Fears of broader conflict involving the U.S. kept the dollar firm. Markets await the Federal Reserve’s policy decision, with rates expected to stay unchanged, though guidance may shape future expectations. The euro remained weak, burdened by Europe’s energy import exposure amid rising oil prices.
Resistance is located at 1.1580, while support is seen at 1.1460.
Technical Analysis

Smart Money Zones Revealed (XAUUSD) Is Gold Just Breathing or Breaking? Smart Money Zones Revealed (XAUUSD)
🔍 Macro & Sentiment Overview
Gold faced a sharp correction after a strong Asian session rally, which caught many traders off guard...
While the US Dollar gained 0.7% due to safe-haven flows and Fed anticipation, gold's dip seems more like a liquidity sweep than a structural reversal...
🌍 Rising geopolitical tensions — especially Iran–Israel and Trump’s comments about Tehran — keep the fear premium alive…
🛢️ Meanwhile, oil prices are surging, and institutional funds might be rotating capital between commodities and equities...
📝 All eyes are now on the Fed’s rate decision and the US retail sales report — a potential "horror print" that could shock rate expectations and trigger high volatility across markets.
📉 Technical Breakdown (M30 Perspective)
Price pulled back sharply after an overextended bullish move from Asian FOMO…
EMAs (13, 34, 89, 200) show early signs of potential crossover — signaling caution for buyers…
Liquidity gaps (FVG zones) below current price indicate a magnet for institutional fills…
🎯 Trade Setup
🔵 BUY ZONE: 3345 – 3343
Stop-Loss: 3339
Take Profits:
3350 → 3354 → 3358 → 3362 → 3366 → 3370 → 3380 → 3400 → ???
🧠 Look for confirmation through price action and rejection candles during London/NY sessions before entering.
🔴 SELL ZONE: 3442 – 3444
Stop-Loss: 3448
Take Profits:
3438 → 3434 → 3430 → 3425 → 3420 → 3410 → 3400
⚠️ Only short upon clean rejection and strong bearish confirmation patterns — avoid blind entries in this volatile phase.
🧠 Final Thoughts
Gold is moving within a smart money playbook — triggering stop hunts and liquidity grabs. With macro uncertainty ahead, patience and precision matter more than ever.
Let price come to your zones. Don’t chase. Let volatility serve you — not shake you.
📌 Follow this idea for live updates during the Fed press conference and NY session.

Yen Holds Ground as BoJ Stays CautiousThe yen held near 145.1 per dollar on Wednesday following three consecutive sessions of losses, weighed down by soft economic data and trade uncertainty. Japan’s exports declined in May for the first time in eight months, alongside drops in machinery orders and manufacturing sentiment. The Bank of Japan left rates unchanged and maintained a cautious tone, though Governor Ueda signaled future hikes remain possible. Trade talks between Prime Minister Ishiba and President Trump at the G7 summit showed no progress on tariffs.
Resistance is at 145.30, while support stands near 142.50.

USDCHF: Pullback From Resistance 🇺🇸🇨🇭
USDCHF is going to retrace from a key daily horizontal resistance cluster.
As a confirmation, I spotted a bearish breakout of a support line of a rising
wedge pattern on an hourly time frame.
We see its retest now.
Goal - 0.815
❤️Please, support my work with like, thank you!❤️
I am part of Trade Nation's Influencer program and receive a monthly fee for using their TradingView charts in my analysis.

EURUSD – Bullish momentum fades, downside pressure intensifiesEURUSD formed a lower high near 1.1613, signaling weakening bullish momentum. Price is now testing a key trendline, and a break below 1.1473 could confirm a bearish move toward 1.1350.
Market sentiment is currently dominated by the Fed’s hawkish stance following the latest FOMC meeting, where the central bank kept rates unchanged but expressed readiness to hike further if necessary. Meanwhile, although tensions in the Middle East are escalating, they have yet to deliver a significant blow to the USD.
Given the current backdrop, EURUSD is under considerable pressure and may soon break its bullish structure unless strong buying interest re-emerges.

AUD/JPY ShortSell-limit (primary) 93.90 — front-runs the twin highs at 94.00 (May and again last week).
Stop-loss 95.10 — just above the 2024 YTD peak and round-number 95; if price closes above, the breakout is real.
Take-profit 1 91.50 — first daily support shelf; locks ~240 pips (≈ 1.6 R) and is often the first bounce zone.
Take-profit 2 88.50 — November-2023 base / 200-day SMA; full mean-reversion target (~540 pips, ≈ 3.6 R).
Filter to keep order Only leave the order active while the daily candle closes ≥ 93.80 (shows the lid is still respected).
GTC Cancel the order if unfilled after 5 trading days; reassess next week.
Quick rationale
Fundamentals: RBA leaning dovish; JPY could firm on BoJ hawkish hints & intervention risk.
Technical: Double-top near 94; bearish RSI divergence on daily; room down to 91s/88s.
Risk-reward: 120-pip risk vs. 240 / 540-pip reward = 1.6 R and 3.6 R pay-offs.
Place the limit, set the filter alert on daily closes, and let the trade come to you—no need to babysit intraday moves.

[INTRADAY] #BANKNIFTY PE & CE Levels(18/06/2025)Today, Bank Nifty is expected to open with a slight gap down near the 55,650–55,700 zone, indicating early signs of consolidation within a tight range.
🔼 If Bank Nifty sustains above the 55,550–55,600 levels after opening, it could trigger a bullish move towards the targets of 55,750 → 55,850 → 55,950+.
🔽 However, if Bank Nifty approaches the 55,950–55,990 zone and shows signs of reversal, a corrective fall may follow with potential downside targets at 55,750 → 55,650 → 55,550.
🔻 A clear breakdown below the 55,450 level would indicate bearish strength, and the next downside levels to watch are 55,250 → 55,150 → 55,050-.
🚀 On the upside, if Bank Nifty manages to break out above the key resistance of 56,050, we can expect a strong rally with targets at 56,250 → 56,350 → 56,450+.

$6 to $27 in minutes after market open $CERONASDAQ:CERO went $6 to $27. All I did was just take safest piece of the move, bought right before halt and sold into easy gap up blowout after halt 🎯

Nightly $SPY / $SPX Scenarios for June 18, 2025🔮 Nightly AMEX:SPY / SP:SPX Scenarios for June 18, 2025 🔮
🌍 Market-Moving News 🌍
💼 Business Inventories Flat in April
U.S. business inventories held steady in April, indicating stable consumer and wholesale demand. That suggests production won't need to cut sharply in the near term, supporting GDP outlook
🏭 Industrial Production Slips
Industrial output declined 0.2% in May, signaling ongoing weakness in factory activity amid less favorable global trade conditions .
🌐 Geopolitical Pressures Persist
Heightened tension in the Middle East continues to pressure risk assets. Investors remain focused on safe-haven flows into gold, Treasuries, and defensive equities, with analysts noting the risk backdrop remains tilted to the downside
📊 Key Data Releases 📊
📅 Wednesday, June 18:
8:30 AM ET – Housing Starts & Building Permits (May)
Measures new residential construction — leading indication of housing sector health.
8:30 AM ET – Initial Jobless Claims
Tracks the weekly count of new unemployment filings — useful for spotting early labor-market weakening.
2:00 PM ET – FOMC Interest Rate Decision
The Federal Reserve is expected to hold steady. Market focus will be on any commentary that hints at future tightening or easing plans.
2:30 PM ET – Fed Chair Powell Press Conference
Investors will parse Powell’s remarks for guidance on rate paths, inflation trends, and economic risks.
⚠️ Disclaimer:
This is for educational/informational purposes only and does not constitute financial advice. Consult a licensed advisor before making investment decisions.
📌 #trading #stockmarket #economy #housing #Fed #geo_risk #charting #technicalanalysis

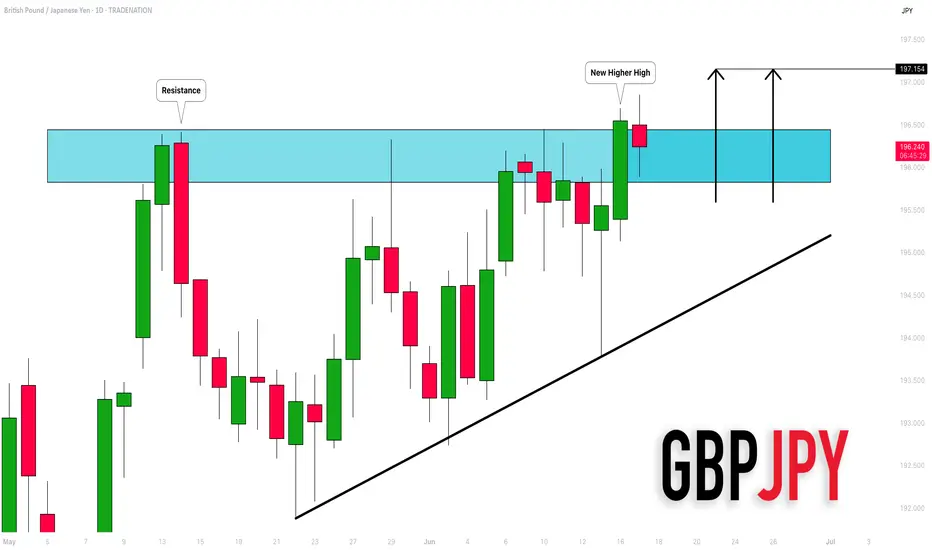
GBPJPY: Important New High 🇬🇧🇯🇵
GBPJPY set a new higher high higher close on a daily,
violating a key horizontal resistance cluster.
I think that it opens a potential for more growth.
Next strong resistance is 195.15
❤️Please, support my work with like, thank you!❤️
I am part of Trade Nation's Influencer program and receive a monthly fee for using their TradingView charts in my analysis.
"Downside DAX" is what we will call it in July?Looking at the technical picture purely, we can see that weakness is starting to kick in. Will July be a negative month for DAX? Let's have a look.
XETR:DAX
Let us know what you think in the comments below.
Thank you.
77.3% of retail investor accounts lose money when trading CFDs with this provider. You should consider whether you understand how CFDs work and whether you can afford to take the high risk of losing your money. Past performance is not necessarily indicative of future results. The value of investments may fall as well as rise and the investor may not get back the amount initially invested. This content is not intended for nor applicable to residents of the UK. Cryptocurrency CFDs and spread bets are restricted in the UK for all retail clients.

Gold holds above key zoneAfter breaking the major resistance at 3,392 USD — a level that had been rejected multiple times in the past — XAUUSD is undergoing a slight pullback to retest the newly established support. The bullish reaction in this area suggests that buyers are still in control of the trend.
In the current context, U.S. retail sales have fallen more than expected, reinforcing expectations that the Fed may cut interest rates soon. This puts pressure on the dollar and benefits gold.
The primary scenario is a bounce from the current support toward the next resistance area near 3,481 USD. The 3,392 USD level has now become a key support to sustain the ongoing bullish structure.

EURUSD: Awaiting Confirmation to Continue the UptrendThe EUR/USD pair closed yesterday at 1.1550, moving within the 1.1526–1.1558 range. The euro continues its bullish trend, driven by U.S. inflation data coming in lower than expected, which increases expectations of an upcoming rate cut by the Fed. In addition, geopolitical tensions in the Middle East—particularly between Israel and Iran—have slightly weakened the U.S. dollar, providing additional support to the euro.
From a technical perspective, the price is currently correcting toward the 1.1480 area, where the ascending trendline converges with the exponential moving average. This is a key support zone. If it holds and a clear bullish signal emerges, EURUSD could rebound and move toward the 1.1610 resistance level.
Main scenario: look for buying opportunities around 1.1480 if a bullish confirmation appears, targeting 1.1610.
Alternative scenario: if the 1.1480 level is broken, the short-term uptrend could be at risk.

Gold Soars – Heading Towards 3,500 USD/ounce?Gold prices closed yesterday at 3,457.7 USD/ounce, up 0.12% from the previous day, fluctuating between 3,453.7 USD and 3,458.1 USD/ounce, marking the highest level in the past two months.
XAU/USD is currently maintaining an uptrend within a well-defined price channel, with strong support at the 3,390–3,400 range. After a short correction, the price could continue to rise if it holds above the EMA34, with the next target towards the 3,445–3,460 range and further up to 3,500 USD/ounce.
This upward momentum is supported by geopolitical tensions in the Middle East, particularly between Israel and Iran, driving demand for gold as a safe-haven asset. U.S. CPI data lower than expected has also increased expectations of a Fed rate cut, alongside central banks increasing gold reserves, all contributing to the continued rise in gold prices.

AUDCAD: Pullback From Resistance Confirmed 🇦🇺🇨🇦
AUDCAD is going to retrace from a key intraday horizontal resistance.
A local bearish CHoCH and an imbalance on an hourly time frame
provide a strong bearish confirmation.
Goal - 0.88445
❤️Please, support my work with like, thank you!❤️
I am part of Trade Nation's Influencer program and receive a monthly fee for using their TradingView charts in my analysis.

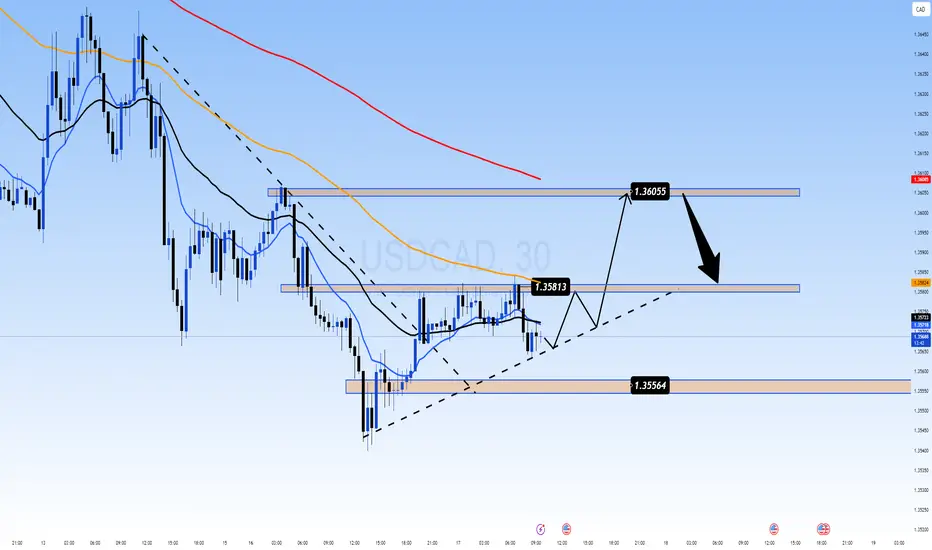
Oil Rises, Canadian Yields Surge: Can USD/CAD Rebound?USDCAD 17/06 – Oil Rises, Canadian Yields Surge: Can USD/CAD Rebound?
After a significant drop to the 1.355x area, USD/CAD is showing early signs of recovery. However, the pair remains influenced by strong macro headwinds—particularly oil prices and Canadian monetary policy signals.
🌐 Macro & Sentiment Overview
WTI crude oil is rising due to ongoing tensions between Israel and Iran, which increase the risk of global supply disruptions. This supports the Canadian Dollar (CAD) as a commodity-linked currency.
Canada’s 10-year bond yields have reached their highest levels in 5 months (~3.4%), reinforcing expectations that the BoC may remain hawkish in the near term.
USD weakens slightly as traders await more clarity from the Federal Reserve about the next rate cut timeline, potentially in Q3.
📊 Technical Analysis (M30 Chart)
Price is printing higher lows above the key trendline.
EMAs 13–34–89 are tightening → sign of sideways pressure before breakout.
Short-term bullish channel still intact.
Key resistance zones: 1.3581 and 1.3605.
🎯 Trade Setup Scenarios
📈 Long Scenario
Entry: 1.3556 – 1.3560 (trendline bounce)
Stop Loss: 1.3535
Take Profits: 1.3581 → 1.3605
✅ Wait for M30/H1 confirmation like bullish engulfing or price-action breakout.
📉 Short Scenario
Entry: 1.3605 (if price rejects resistance)
Stop Loss: 1.3630
Take Profits: 1.3581 → 1.3556
⚠️ Trigger only on bearish rejection with strong candle and volume at resistance.
📌 Strategic Outlook
USD/CAD is caught in a tug-of-war: stronger Canadian fundamentals (oil + yields) vs. cautious USD movement post-FOMC. If oil prices and Canadian yields continue to climb, CAD may remain in favor. However, short-term technical rebounds toward 1.3600 remain valid if price structure holds.
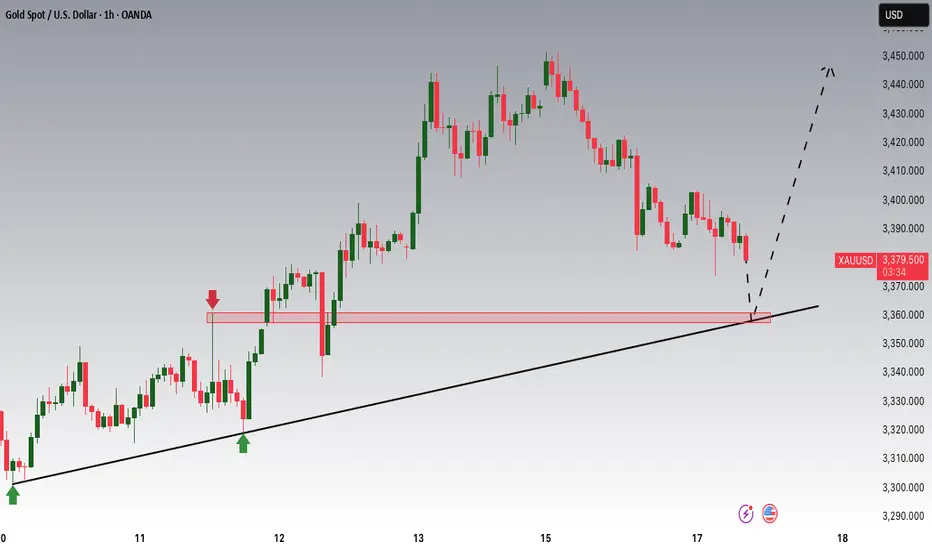
Gold is Nearing an Important Support!!Hey Traders, in today's trading session we are monitoring XAUUSD for a buying opportunity around 3,360 zone, Gold is trading in an uptrend and currently is in a correction phase in which it is approaching the trend at 3,360 support and resistance area.
Trade safe, Joe.
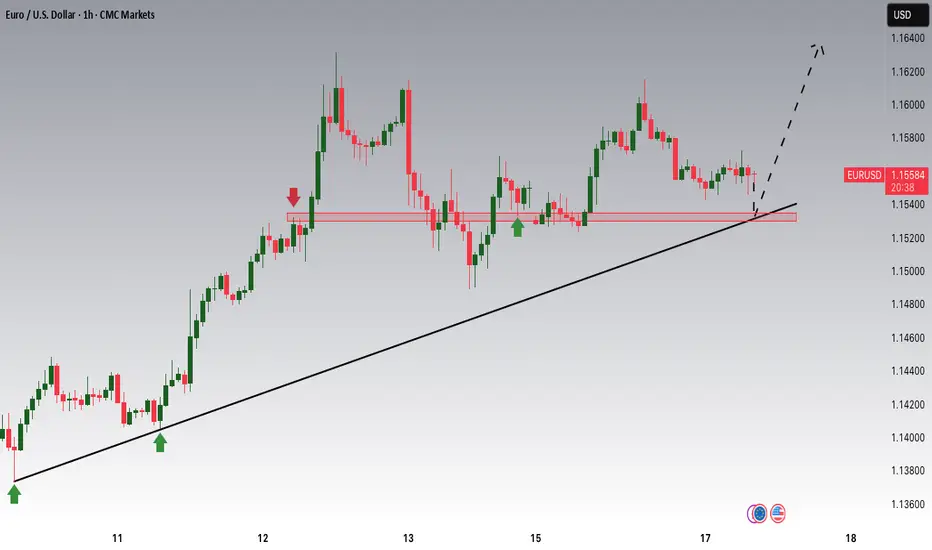
EURUSD Potential UpsidesHey Traders, in today's trading session we are monitoring EURUSD for a buying opportunity around 1.15300 zone, EURUSD is trading in an uptrend and currently is in a correction phase in which it is approaching the trend at 1.15300 support and resistance area.
Trade safe, Joe.
Bitcoin Pushed Crypto Market Into A Higher Degree CorrectionGood morning Crypto traders! Cryptos are coming lower and we can now see a five-wave drop on Bitcoin, which indicates for a deeper, higher degree correction, so Crypto TOTAL market cap chart may stay in consolidation within an ABC correction, which can retest 3.0T – 2.8T support zone before bulls return.
Bitcoin has impulsive characteristics on 4h time frame, and we can clearly see five waves up that can send the price even higher after a pullback. Now that it’s back to all-time highs, we can see it making a higher degree ABC correction, which can take some time, and it can retrace the price back to 97k-93k support zone before a bullish continuation.
However, we may now see a temporary corrective recovery in wave B, where some ALTcoins could still be doing well, if we consider that ALTcoin dominance may start kicking in. Yesterday we shared a chart of the ratio of TOTAL3(ALTcoins) market cap against Bitcoin with ticker TOTAL3ESBTC, which shows that ALTcoins may start outperforming BTC soon. It can be finishing final subwave C of (Y) of a correction in blue wave B which may cause a new strong rally into wave C that can bring the ALTseason similar as in the beginning of 2021.

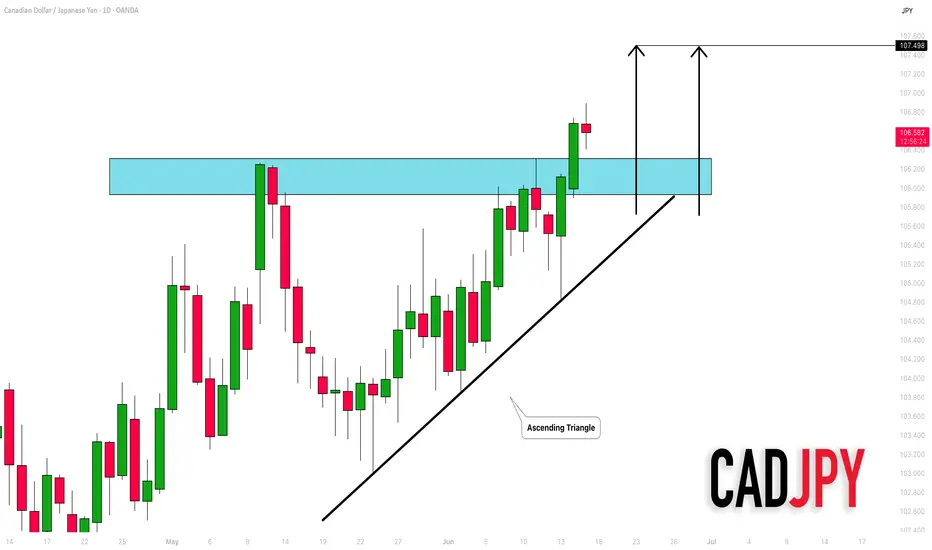
CADJPY: Important Breakout 🇨🇦🇯🇵
CADJPY successfully violated a resistance of an ascending triangle
pattern on a daily time frame.
The broken structure turns into a strong support now.
The pair may continue rising after a pullback.
Next goal - 107.5
❤️Please, support my work with like, thank you!❤️
Squeeze in Progress: Will BOJ Trigger the Next Breakout?USDJPY 17/06 – Squeeze in Progress: Will BOJ Trigger the Next Breakout?
The USDJPY pair is currently consolidating just below the key 144.650 resistance, stuck within a tightening triangle structure. As markets await more clarity from both the Bank of Japan (BOJ) and the Fed, price action is showing signs of indecision — but pressure is building.
🌐 Macro & Sentiment Overview
BOJ maintains a neutral stance: Despite growing speculation of a hawkish shift, the BOJ held rates steady, providing no strong forward guidance. Markets remain cautious.
US Dollar remains resilient amid stable bond yields and expectations that the Fed may delay rate cuts, adding short-term support to USDJPY.
Geopolitical risk is on the rise: Ongoing Middle East tensions are fueling safe-haven demand for JPY, capping bullish momentum.
🔍 Technical Setup (M30 Chart)
Price is trapped inside a symmetrical triangle, tightening between 144.652 resistance and 143.126 support.
EMA 13/34/89 are aligned bullishly, but EMA 200 (red) is acting as a dynamic ceiling near 144.300.
Key support zones:
144.071: Minor structural level and trendline test.
143.126: Major liquidity zone and untested demand.
🎯 Trade Scenarios
📉 Scenario 1 – Sell on Rejection at 144.652
Entry: 144.650–144.700
Stop Loss: 145.250
Take Profit: 144.071 → 143.600 → 143.126
Ideal if BOJ shifts tone or USD weakens post-Fed comments.
📈 Scenario 2 – Buy on Bullish Reaction at 143.126
Entry: 143.100–143.150
Stop Loss: 142.700
Take Profit: 143.600 → 144.071 → 144.650 → 145.200
Valid only with clear bullish confirmation on M15–M30 structure.
🧠 Final Thoughts
USDJPY is coiling tightly ahead of a potential breakout. Macro uncertainty from central banks, geopolitical instability, and upcoming CPI data make this week highly volatile. Instead of chasing, let price come to your zones and react accordingly.
🔔 Focus on structure, confirm with price action, and avoid emotional trades. Patience and discipline are key in this compression phase.

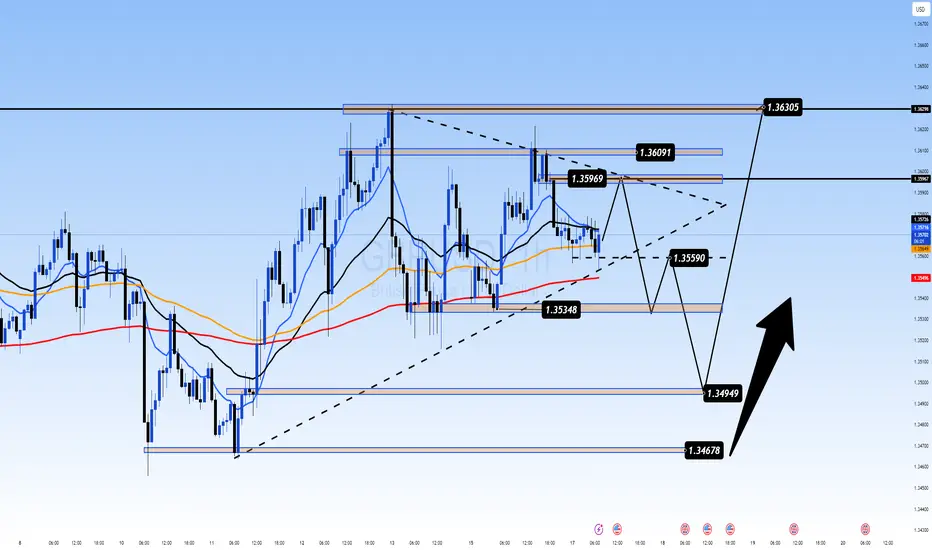
The Calm Before the Storm: All Eyes on UK CPI & Central BanksGBPUSD 17/06 – The Calm Before the Storm: All Eyes on UK CPI & Central Banks
The GBPUSD pair is coiling in a tight range near the mid-1.3500s as traders brace for two high-impact events: UK CPI data on Wednesday and interest rate decisions from both the Fed and BoE this week. Price remains supported above the 200 EMA and is compressing within a symmetrical triangle – typically a precursor to a major breakout.
📊 Macro & Fundamental Outlook
🔹 Federal Reserve (FOMC): Expected to hold rates steady, but growing anticipation of a dovish tilt toward September is weighing slightly on the USD.
🔹 Bank of England (BoE): Markets are pricing in deeper rate cuts following recent UK GDP weakness, pressuring the GBP in the short term.
🔹 Geopolitical Risks: Rising Middle East tensions are fuelling demand for USD as a safe haven, reinforcing its strength ahead of data events.
📝 Bottom Line: The CPI release could be the first trigger to shift GBPUSD’s current consolidation. A hot inflation print might push GBP higher; a miss could fuel further downside.
🔧 Technical Analysis (H1 Chart)
Price is ranging between 1.3535 (support) and 1.3609 (resistance)
EMAs 13/34 crossing below EMA 89 → signal of potential bearish continuation
Uptrend line from 1.3467 is still intact and acting as dynamic support
Break below 1.3559 may lead to a move toward 1.3495 and 1.3467
A confirmed breakout above 1.3609 opens the door to 1.3630+
🎯 Trade Scenarios
Scenario 1 – Buy from Trendline Support
Buy Zone: 1.3495 – 1.3467
Stop Loss: 1.3440
Targets: 1.3535 → 1.3559 → 1.3596 → 1.3630
🟢 Best setup if price prints a bullish engulfing or hammer candle on key support + UK CPI surprise.
Scenario 2 – Sell on Resistance Rejection
Sell Zone: 1.3609 – 1.3630
Stop Loss: 1.3660
Targets: 1.3590 → 1.3559 → 1.3535 → 1.3495
🔴 Only valid with strong rejection signals + softer UK data or hawkish Fed tone.
💡 Market Sentiment
Retail traders are trapped in a waiting zone – expecting a breakout
Institutions may push price into one direction pre-data to collect liquidity
Risk appetite is fragile, and traders are cautious ahead of back-to-back central bank announcements
📌 Final Thoughts
GBPUSD is preparing for volatility. Instead of chasing moves, let the market come to your key zones and react with discipline. The 1.3467–1.3495 support area could be crucial for the next directional move.
Stay patient. Wait for confirmation. Respect your risk.
EURUSD – Healthy pullback within a strong uptrendEURUSD is undergoing a temporary correction after a strong bullish move, but the pair remains above key technical support levels such as the EMA34 and the ascending trendline. The 1.15070 zone now acts as a potential buy area—where demand may return if confirmation signals appear.
Market sentiment is leaning toward the expectation that the Fed may cut interest rates soon due to weaker-than-expected U.S. retail sales data, which has weighed on the USD and indirectly supported the euro. Meanwhile, the ECB continues to maintain a stable policy stance, further reinforcing the current bullish trend.
If the price holds above the green support zone, the next target could be around 1.15940. If this support breaks, traders should watch price behavior at the trendline before making the next trading decision.
