$5 to $26 big +400% day for $MULNThe biggest mover of the entire stock market NASDAQ:MULN with huge 400% squeeze. Mentioned probable bounce from $14.50 in chat, then double bottom possibility and stronger bounce from $14.50 again, after double bottom was confirmed it rocketed beyond $20 and $25.
It closed the day right at same $14.50 area once again, we'll see how it trades tomorrow.
Technical Analysis

TradeCityPro | LINKUSDT Chart Primed for a Big Move! 👋 Welcome to TradeCityPro Channel!
Let’s dive into analyzing one of the market’s most popular coins, LINK, which continues to hold its key supports in higher timeframes and is poised for strong moves during a market uptrend.
🌐 Overview Bitcoin
Before starting the analysis, I want to remind you again that we moved the Bitcoin analysis section from the analysis section to a separate analysis at your request, so that we can discuss the status of Bitcoin in more detail every day and analyze its charts and dominances together.
This is the general analysis of Bitcoin dominance, which we promised you in the analysis to analyze separately and analyze it for you in longer time frames.
📊 Weekly Timeframe
On the weekly timeframe, LINK has been one of the cryptocurrencies that remained in a range for 500 days. After breaking out, we have seen the beginning of an uptrend.
This is exactly what I mean by avoiding capital lock-up. We waited weeks for the 8.06 trigger to break, allowing us to buy with momentum confirmation rather than buying inside the range and waiting in a high-risk market.
You might say, "Why not buy inside the range to avoid missing the 8.06 breakout?" My answer is that hundreds of coins are still stuck in similar ranges without showing any bullish moves, and even now, they could trap your capital for a long time, causing frustration!
Currently, we can say that after a price rejection at 18.10, we’ve pulled back, and if selling volume increases, we’ll go to test the 9.06 level, but if we form a higher low, we’ve created a good trigger for a buy!
📈 Daily Timeframe
On the daily timeframe, LINK is one of the few cryptocurrencies that, after recent corrections, did not return to lower levels. Instead, it bounced off the 0.382 Fibonacci level, increasing the bullish bias.
After breaking 12.96, LINK had a strong rally up to 29.07, where resistance was observed.
Instead of considering 29.07 as resistance, I prefer to buy after a breakout of 26, as this level was previously a pullback zone and had multiple rejections.
On the daily timeframe, we’ve also been rejected from a strong resistance, which further emphasizes the importance of this daily resistance, and it’s better to say that as long as we’re above the 11.99 support level, the 17.45 resistance will be the best trigger for a spot buy and our entry!
📝 Final Thoughts
Stay calm, trade wisely, and let's capture the market's best opportunities!
This analysis reflects our opinions and is not financial advice.
Share your thoughts in the comments, and don’t forget to share this analysis with your friends! ❤️

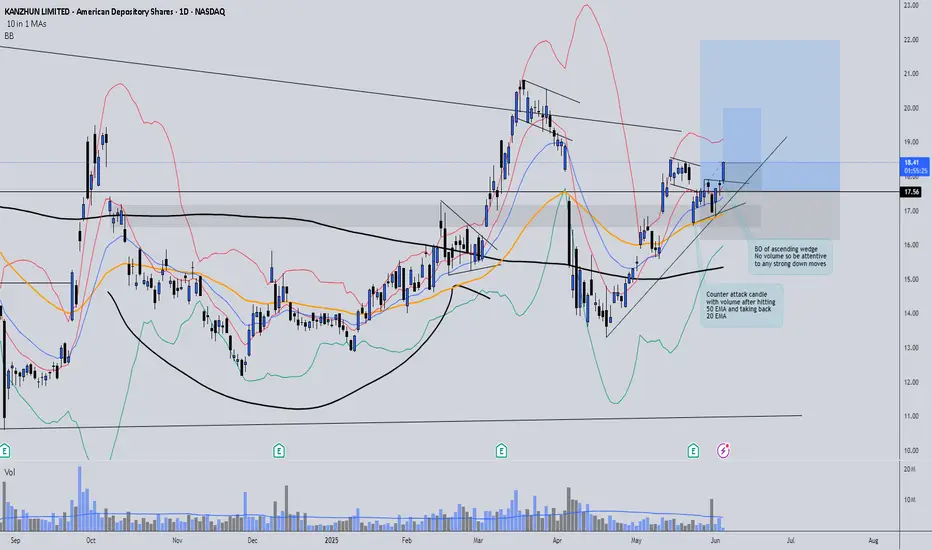
BZ BO of ascending wedgeBZ Trade Update 📈
BZ has shown strong bullish behavior after bouncing off a key support level. It has now broken out of an ascending wedge formation, offering another solid entry opportunity.
I've entered a second position and adjusted risk management accordingly:
✅ SL of the first trade moved to breakeven (BE)
✅ New SL set 1% below the second entry candle
Now it's a matter of patience and discipline, letting the trade play out while following the plan.
Stay consistent and trust your process! 💪
This Trendline Refuses To Be OverlookedTrading Fam,
While it is somewhat unclear what Bitcoin's next move will be (though I tend to lean towards more upside bias), one thing has become clear ...that aqua blue trendline I have drawn on our chart is proving its significance. Currently, it holds as support. A break to the downside though, and I expect us to drop all the way to 96k. If it continues to hold, a break above our recent high should be expected and new highs will be formed in a relatively quick timeframe.
Stew

GOOG In Trouble!I first started warning about GOOG back on March 18, 2025
Since GOOG has formed this big bear flag outside the structure in the middle of nowhere.
This is an indication of more weakness to come!
GTF out is in order for bulls. It is better to be out of the market wishing you were in and then in the market wishing you were out!
I can only provide the setup. The rest is up to you.
Click like, follow, for more. Let's get to 5,000 followers.

Possible Bear MoveCurrently monitoring its bearish trend and identifying additional potential zones for shorting opportunities.

Minswap looks like a good entry here.Trading Fam,
I'm seeing great potential on this Minswap entry.
First, we're oversold on all lower indicators.
Secondly, we're back inside of a green liquidity block.
Third, we're on excellent support (aqua trendline).
This trade is a no brainer. I'm setting my target for an easy 25% profit target at which point I'll take half off and let the rest ride a bit longer, trailing my stops as I go.
Stew

AJA'S Gold view... Daily Timeframe Analysis.Gold has been on a correction spree now, with short term buys.
On the monthly timeframe, Gold is completely OVERSOLD.
From my analysis on the daily timeframe, the bear power is more, we'll keep selling to our poi, which is our order block at 3025-2975.
Gold needs to make a huge correction by coming down past the inducement point at 3122 before hitting the order block at that BOS.
Then we'll see if the bearish market will continue, or the bull will take power.
What do you think about this analysis?

USDCAD 04/06 – BoC Rate Decision Ahead USDCAD 04/06 – BoC Rate Decision Ahead | Will the Market Break Higher or Reverse From 1.3820?
The USDCAD pair is trading around the 1.3700 area as markets prepare for the upcoming Bank of Canada (BoC) interest rate decision. Price action shows potential for a breakout, but macro risks remain high.
🌍 MACRO OUTLOOK
BoC Expected to Hold Rates
Analysts widely expect the BoC to keep the interest rate unchanged at 2.75%, marking the third consecutive pause. Inflation has slipped below 2%, supporting the case for a dovish tone.
Trade Policy in Focus
With growing global uncertainties and Trump’s trade stance back in the spotlight, BoC Governor Tiff Macklem is expected to address policy risks, especially related to tariffs.
Market Sentiment
USD is mildly weaker after soft ISM data.
CAD remains near YTD highs but sensitive to policy commentary.
📉 TECHNICAL OUTLOOK – H2 Chart
Price is forming a potential double bottom near the 1.3693 zone – a key structure support.
Resistance sits at 1.3725 – 1.3757. A confirmed breakout could lead to a test of 1.3824, the recent high.
Failure to hold 1.3690 may expose deeper downside toward 1.3620–1.3600.
🔑 KEY LEVELS TO WATCH
🟢 BUY ZONE: 1.3693 – 1.3700
SL: 1.3670
TP: 1.3725 → 1.3757 → 1.3800 → 1.3824
🔴 SELL ZONE: 1.3824 – 1.3830
SL: 1.3850
TP: 1.3780 → 1.3750 → 1.3700 → 1.3650
🎯 TRADE STRATEGY
If BoC holds rates with a dovish bias, USDCAD may rally sharply toward 1.3824 and potentially higher.
If BoC surprises with hawkish comments, CAD strength may push the pair lower, targeting the 1.36 handle.
Traders should be cautious around 1.3690 – this is the pivot zone for the week.
📌 CONCLUSION
“The BoC’s decision may already be priced in – but the true volatility could come from Governor Macklem’s press conference. Any hint regarding Trump’s trade policies could trigger sharp moves. Stick to clean key levels and protect your capital.”

AUDCHF BULLISH OR BEARISH DETAILED ANALYSISAUDCHF is currently breaking out of a textbook falling wedge pattern on the 4H chart, signaling a potential shift in momentum from bearish to bullish. Price action has been consolidating within this structure for several weeks, creating lower highs and lower lows, but with clear bullish divergence beginning to show up in recent sessions. The breakout around the 0.53300 zone marks a significant technical confirmation that bulls are taking control, with eyes now on the 0.54400 target.
From a fundamental standpoint, the Australian dollar is gaining strength backed by hawkish sentiment from the RBA. Despite global uncertainties, the RBA’s firm stance on managing inflation is keeping the Aussie resilient. On the flip side, the Swiss franc has been showing signs of relative weakness due to softer inflation readings and safe-haven outflows as global risk sentiment improves. This macro backdrop is creating favorable conditions for AUDCHF to rally.
Technically, this breakout aligns with strong market structure and volume support, making this a high-conviction bullish setup. The breakout candle is closing above resistance with momentum, and as long as price holds above the 0.53250–0.53000 zone, bulls are likely to maintain control. With the falling wedge breakout and favorable risk-reward setup, the upside move toward 0.54400 looks increasingly probable.
This is a clean price action play with fundamental alignment. The breakout not only confirms the end of the previous downtrend, but also opens up space for a bullish wave to unfold. Momentum traders and swing traders will want to watch this closely as AUDCHF transitions from accumulation to a potential bullish expansion phase.

PIRAMAL ENTERPRISES LTDThis is the Weekly Chart of PEL !!
PEl is moving in an Ascending Channel pattern on the weekly chart.
PEL is following a HH–HL structure in the channel in Daily chart support at 1040-1050 range, confirming a bullish trend continuation.
Based on historical price behavior, the stock has
previously delivered a 74% return from its swing low, reaching the 1500–1520 range.
Thank You!!

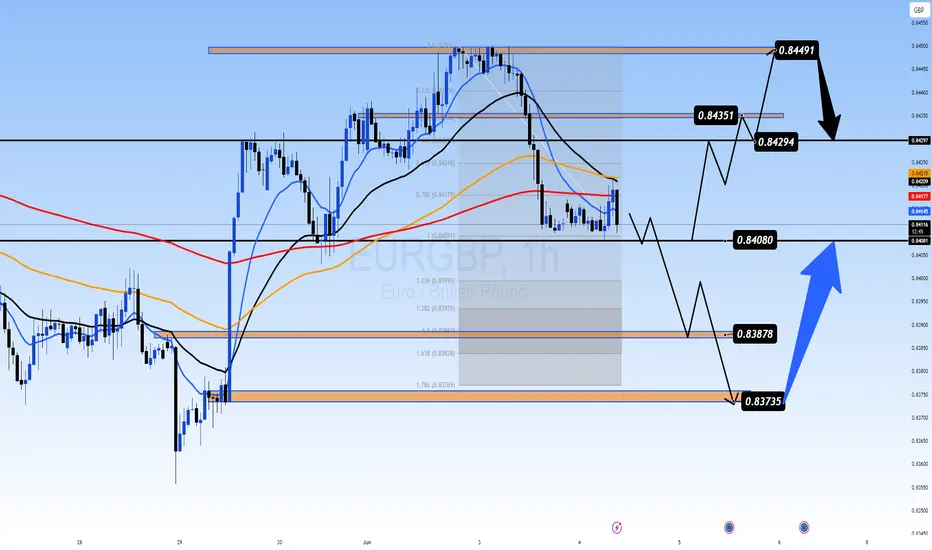
PMI Divergence & ECB Rate Decision Looms:0.84 Key Level in PlayEURGBP 04/06 – PMI Divergence & ECB Rate Decision Looms: 0.84 Key Level in Play
EUR/GBP is hovering around the 0.8420 mark after mixed PMI releases from the Eurozone and Germany. Traders are cautiously awaiting the ECB’s interest rate decision this Thursday, while the Bank of England signals potential easing — but remains non-committal on timing.
🌍 MACRO OUTLOOK
Eurozone & German PMI:
Eurozone Composite PMI eased to 50.2, still above forecasts (49.5) but reflecting slowing momentum.
German Composite dropped to 48.5; Services fell further to 47.1 — signaling contraction risk in Europe’s largest economy.
ECB Dovish Expectations:
Core inflation fell to 1.9% YoY in May — below the 2% ECB target for the first time in eight months.
Markets are fully pricing in a 25bps rate cut this week.
BoE Shifts Cautiously Dovish:
Governor Andrew Bailey acknowledged that monetary easing is likely, but warned of "uncertainty ahead."
The MPC is split — some fear sticky inflation; others warn that rates staying too high too long may damage growth.
Market Sentiment:
EUR remains pressured by ECB dovish expectations.
GBP is also under pressure from weak UK macro indicators and global trade tensions.
📉 TECHNICAL OUTLOOK (H1 Chart)
Price is consolidating near the EMA200 (0.8409) — a crucial dynamic support.
A tight sideways range has formed; 0.8408 is a key horizontal level to watch for breakout/breakdown confirmation.
Break below 0.8408 could send price toward Fibo 1.618 at 0.8383 or psychological support at 0.8373.
If bulls defend 0.8408, we may see a bounce toward 0.8429 → 0.8449 resistance zone.
🔑 KEY TRADE ZONES
🟢 BUY ZONE: 0.8380 – 0.8373
SL: 0.8358
TP: 0.8400 → 0.8415 → 0.8429 → 0.8435
🔴 SELL ZONE: 0.8448 – 0.8450
SL: 0.8460
TP: 0.8435 → 0.8420 → 0.8408 → 0.8388
⚠️ TRADE STRATEGY
Watch the 0.8408 area closely. If price holds → short-term BUY scalp opportunities.
If it breaks strongly → consider SELL toward lower Fibo/structure levels at 0.838x.
Be cautious around ECB release — avoid trading during the spike. Wait for structure confirmation post-news.
📌 CONCLUSION
"EUR/GBP is entering a critical zone near 0.8400. With ECB and BoE both leaning dovish, expect increased volatility. Hold or break at this key level will likely define the next directional leg. Stay patient and let the market show its hand."
EURUSD: Pullback From Support Confirmed 🇪🇺🇺🇸
Update for our yesterday's setup on EURUSD.
It feels like the pair has successfully completed a retracement,
respecting an intraday horizontal support.
A double bottom formation on that and a formation of a bullish
imbalance candle provide a strong bullish confirmation.
I think the pair may rise at least to 1.144 support soon.
❤️Please, support my work with like, thank you!❤️
I am part of Trade Nation's Influencer program and receive a monthly fee for using their TradingView charts in my analysis.

GOLD (XAU/USD) Analysis – Head & Shoulders & Target📌 Overview:
Today’s GOLD market presented an excellent educational setup using the MMC (Market Maker Cycle) methodology. We identified a Head & Shoulder reversal pattern, volume contraction at a key zone, a Major Break of Structure (BOS), and finally, a clear shift in market structure leading to a strong bullish move.
Let’s break it down step-by-step:
🧠 1. Head & Shoulders Pattern – The Early Reversal Signal
The pattern started forming around May 26–28, a classic Head & Shoulders that signaled potential exhaustion of the downtrend:
Left Shoulder: Price attempted to rise but failed to break previous highs.
Head: Sellers pushed to form a deeper low, forming the head.
Right Shoulder: Buyers entered again at the previous demand, creating a higher low than the head—indicating weakening bearish momentum.
🟦 The neckline was drawn across the swing highs. Once broken, it confirmed the reversal.
📍Significance: This pattern formed inside a strong SR Interchange Zone, where support turned resistance and vice versa—adding confluence.
🛠 2. Major Break of Structure (BOS) – Confirmation of Trend Shift
After forming the right shoulder, price decisively broke above the neckline and previous highs—this was the Major Break of Structure (BOS).
This is critical in MMC because:
It signals the end of the accumulation or manipulation phase.
It confirms that smart money has taken control and is pushing price in the new direction.
BOS acts as an entry trigger for traders using structure-based strategies.
💥 A strong bullish candle closed above the BOS level, showing aggressive buying.
📉 3. Volume Contraction – Smart Money Behavior
Between May 31 and June 2, we observed a tight consolidation at the previous resistance zone (now support).
Volume was contracting, forming a compression zone—a common sign of liquidity buildup by institutional players.
🧠 Why is this important?
Low volume ranges typically lead to high-volume breakouts.
This is the “accumulation before expansion” phase.
Smart money often accumulates orders here before a major move.
When price broke out of this compression, it did so with high momentum—validating this theory.
🔄 4. Structure Shifting – New Bullish Market Cycle
Following the BOS and breakout from volume contraction, price aggressively shifted its structure:
Higher highs and higher lows started forming.
Price invalidated bearish order blocks and respected bullish zones.
A new bullish market cycle under MMC began unfolding.
🚀 Price is now headed toward the Next Reversal Zone (around $3,460–$3,470), where we expect significant reaction.
🔍 5. Key Levels Explained
🔵 SR Interchange (~$3,280): This acted as a strong base for the Head & Shoulder formation. A key demand zone if price retraces.
🟦 Volume Contraction Zone (~$3,330–$3,350): Launchpad for the bullish impulse.
🟥 Next Reversal Zone (~$3,460–$3,470): A likely profit-taking or short-term reversal zone. Watch for bearish setups or consolidation here.
🎯 Strategy Insights (Based on MMC)
Entry Opportunity: After BOS + Retest of neckline or volume contraction zone.
Risk Management: Stop loss just below the previous low or reversal zone.
Target Zones: Next Reversal Zone or Fibonacci extensions depending on strategy.
📈 Conclusion
This GOLD chart is a textbook example of how technical confluences create high-probability setups:
✅ Head & Shoulder at demand
✅ Break of structure confirms reversal
✅ Volume contraction signals smart money entry
✅ Bullish expansion shows structure shift
🔔 Final Thought:
Watch closely how price reacts around the Next Reversal Zone. If bearish price action appears, it may provide a short-term reversal or retracement trade. Otherwise, a clean break above could signal the continuation of the bullish leg.

Gold Awaits Breakout: Will the 3345–3370 Range Explode? XAUUSD 04/06 – Gold Awaits Breakout: Will the 3345–3370 Range Explode?
Gold is currently consolidating within a critical range between 3345–3370, following a wave 4 correction. After a sharp retracement to the 335x area, traders are closely watching for the next move — either a continuation of the correction or a breakout toward new highs.
🌍 MACRO CONTEXT
Trump–Xi Call Incoming: A high-level diplomatic call is expected in the coming days. Market participants are anticipating potential shifts in global trade sentiment.
US 10-Year Yields remain elevated, keeping pressure on gold in the short term. However, geopolitical risks and macro uncertainty still support demand for safe-haven assets.
The US Dollar Index (DXY) is showing signs of weakness after recent strength, which may give gold room for recovery.
📉 TECHNICAL ANALYSIS – H1 / H4 Timeframe
Gold is in a wave 4 structure within a 5-wave Elliott pattern. A break above 3370 could signal the beginning of wave 5, targeting 3400.
A breakdown below 3345 would imply deeper correction toward the 332x liquidity zone, completing wave 4 before a bullish continuation.
EMAs 13 and 34 remain above EMA200 on H1, indicating the broader uptrend is still intact.
🔑 STRATEGIC PRICE LEVELS
🟢 BUY ZONE: 3317 – 3315
Stop Loss: 3310
Take Profit: 3322 → 3326 → 3330 → 3334 → 3338 → 3345 → 3350 → 3360
🔴 SELL ZONE: 3372 – 3374
Stop Loss: 3378
Take Profit: 3368 → 3364 → 3360 → 3356 → 3350 → 3345
⚠️ STRATEGY RECOMMENDATION
Respect the 3345–3370 range until a breakout is confirmed.
Avoid chasing trades in the middle of the range. Wait for strong rejections or clear breakout confirmations.
Be cautious with unexpected news from the Trump–Xi call, which may trigger sudden market volatility.
📌 FINAL THOUGHT
“Gold is at a turning point. Break above 3370 and we may see wave 5 unfold toward 3400. But a breakdown below 3345 could drag price lower before the next bullish leg begins. Focus on the key zones — volatility is just getting started.”

When and How to Use Weekly Time Frame in Gold Forex Trading
Ignoring weekly time frame chart analysis could cost you big losses in Forex, Gold trading!
Discover 3 specific cases when weekly time frame beats daily time frame analysis.
Learn the situations when weekly timeframe exposes what daily charts can’t, how to analyze it properly and when to check it.
1. Long-term historic levels
When the market trades in a strong bullish or bearish trend and goes beyond recent historic levels, quite often the daily time frame will not be sufficient for the identification of significant supports and resistances.
The proven way to identify the next meaningful levels will be to analyze a weekly time frame.
Examine a price action on EURAUD forex pair on a daily time frame chart. The market is trading in a strong bullish trend and just updated the high.
Checking the historic price action, we don't see any historic resistance on the left.
Switching to a weekly time frame chart, we can easily recognize a historic resistance that the price respected 5 years ago.
That's a perfect example when weekly t.f revealed a historic price action that a daily didn't.
2. Trend-lines
Weekly time frame analysis is important not only for a search of historic levels. It can help you find significant vertical structures - the trend lines.
We can easily find several meaningful historic resistances on EURUSD pair on a daily time frame.
Though, there are a lot of historic structures there, let's check if there are some hidden structures on a weekly.
Weekly time frame reveals 2 important trend lines, one being a vertical support and another being a vertical resistance.
With a daily time frame analysis, these trend lines would be missed .
3. More accurate breakout confirmations
Some false support and resistance breakouts that you see on a daily could be easily avoided with a weekly time frame analysis.
Quite regularly, a daily time frame support or resistance is in fact a weekly structure. And for its breakout, a weekly candle close will provide more accurate confirmation.
From a daily time frame perspective, we see a confirmed breakout - a daily candle close above a solid resistance zone.
It provides a strong bullish signal on AUDUSD forex pair.
However, the violation turned out to be false and dropped.
Such a false breakout , could be easily avoided, checking a weekly time frame chart.
The underlined resistance is in fact a weekly structure.
The price did not manage to close above, and perfectly respected that, starting to fall after its test.
Such a deeper analysis would completely change our bias from strong bullish (based solely on a daily) to strongly bearish (based on a daily AND weekly)
Remember This
Do not ignore and always check a weekly time frame.
It shows a unique perspective on the market and reveals a lot of hidden elements that you would not notice.
No matter whether you are a scalper, day trader or swing trader,
remember that weekly time frame structures are very impactful and accumulate large trading volumes.
❤️Please, support my work with like, thank you!❤️
I am part of Trade Nation's Influencer program and receive a monthly fee for using their TradingView charts in my analysis.

NZDUSD: Your Trading Plan For Today Explained 🇳🇿🇺🇸
NZDUSD is currently consolidating on a strong intraday/daily support.
To buy the pair with a confirmation, I suggest to focus on a double
bottom pattern on a 4H time frame.
Its neckline breakout and a 4H candle close above 0.6015
will provide a reliable bullish confirmation.
Goal will be 0.6035.
Alternatively, if the price sets a new lower low on a 4H,
this setup will become invalid.
❤️Please, support my work with like, thank you!❤️
I am part of Trade Nation's Influencer program and receive a monthly fee for using their TradingView charts in my analysis.

EUR/CHFLooking for the market to retrace, only entering once the market enters my area.
This will be confirmed with my RSI.
But if it takes the high before the retracing, I will not look for a trade anymore, as one of the targets have already been taken

Liquidity Hunt: Crude Oil's Next TargetFenzoFx—Crude Oil remains below the $64.19 resistance level. The Stochastic Oscillator is in overbought territory, and RSI 14 signals bearish divergence, suggesting a possible price dip.
Oil could briefly surpass $64.19 to grab liquidity before facing selling pressure. In this case, a drop toward the $61.72 support level may occur to fill the bullish fair value gap.
However, if Oil stabilizes above $64.19, the bearish outlook becomes invalid.
>>> Trade Crude Oil without swap and low spread at FenzoFx

Can Tech Strength Still Drive Markets Amid Trade Tensions?Macro approach:
The Nasdaq 100 (USTEC) began Jun with strong momentum after its best monthly performance since 2023, fueled by robust tech earnings and a brief lull in tariff concerns.
- However, renewed US-China trade tensions resurfaced early in the week, briefly weighing on sentiment before a market rebound restored cautious optimism.
- Nvidia (NVDA) surged due to the continued demand for AI chips. At the same time, Tesla (TSLA) drew investor focus ahead of its 12 Jun robotaxi launch, helping maintain positive momentum in the face of geopolitical uncertainty.
Technical approach:
- USTEC is now testing the previous swing high near 218000, staying above both EMAs, a sign of ongoing bullish strength.
- A clear break above 21800 would likely open the path toward the record-high zone near 22200.
- Failure to do so may trigger a pullback toward the nearest support of around 20700.
Analysis by: Dat Tong, Senior Financial Markets Strategist at Exness

EURCAD's Triangle Hints Drop AheadThe correction looks like a contracting triangle, which is a common pattern in Elliott Wave theory. This kind of triangle usually forms during wave B or wave 4. It includes five smaller waves labeled A, B, C, D, and E, which move within two sloping lines that get closer together. There is also a demand zone marked in red on the chart.
Triangles often show a pause in the market before the price continues in the same direction as before. In this case, the triangle suggests that once wave E is complete, the price may drop again to finish wave C. The expected target area is between 1.54900 and 1.54320. This outlook remains valid as long as the price stays within the correction channel.

#NIFTY Intraday Support and Resistance Levels - 04/06/2025Nifty is opening with a gap-up near the 24700 level, placing it right at a key decision zone. If the index sustains above the 24750–24800 resistance band, it could trigger a bullish breakout with intraday upside targets of 24850, 24900, and 24950+.
However, if Nifty fails to hold this gap-up and slips back below 24700, it could quickly turn into a false breakout. A breakdown below 24700 may invite selling pressure with targets at 24650, 24600, and 24550.
Since the gap-up is near a resistance threshold, early volatility is expected. Wait for confirmation of direction with price-action and volume before taking any directional trade. Use strict stop-loss and consider partial booking around each target zone.

[INTRADAY] #BANKNIFTY PE & CE Levels(04/06/2025)Bank Nifty is expected to open with a gap-up near the 55950 level, which places it at a critical resistance zone. If it sustains above this level, it may extend the bullish momentum toward 55750, 55850, and 55950+, but more importantly, a breakout above 56050 would trigger a fresh upside rally with targets at 56250, 56350, and 56450+.
However, if Bank Nifty fails to hold above 55900–55950 and reverses below this zone, a short trade setup may activate, with potential downside targets of 55750, 55650, and 55550.
Further weakness can be confirmed only if the index slips below the 55550–55600 support zone, exposing it to 55250, 55150, and 55050 levels.
