TATA STEEL at Resistance ZoneThis is Daily Chart of TATA STEEL.
Tata steel having good Law of Polarity at 163-168 range.
If this level is sustain , then We may see lower prices in the stock again.
Tata steel is a good support zone at 125-130 range.
Two EMAs are also supporting the stock, with the first EMA positioned at ₹140 and the second at ₹129.
THANK YOU !!
Technical Analysis

NZDJPY: Another Bearish YEN Pair 🇳🇿🇯🇵
One more YEN pair that looks bearish to me is NZDJPY.
I see 2 bearish price action confirmations after a test
of the underlined horizontal resistances:
the price broke a support line of a rising wedge pattern
and a neckline of a double top.
The price may drop now to 86.66 level.
❤️Please, support my work with like, thank you!❤️
I am part of Trade Nation's Influencer program and receive a monthly fee for using their TradingView charts in my analysis.

BTCUSD at Decision Point – Rejection or Breakout Ahead? (4H)Bitcoin is currently trading around $103,500, and the price action is presenting a textbook technical scenario with multiple confluences. This chart is rich in structure — from rejection zones and trendlines to channel breakdowns and historical support retests — making it a critical area for traders to observe.
🔍 1. Previous Reversal Zone
The chart shows that Bitcoin previously faced a strong rejection near the $110,500–111,000 level. This created the first lower high, signaling the end of bullish momentum and the start of a trend shift. Every subsequent touch of that zone resulted in rejection, confirming it as a major supply zone.
📉 2. Descending Trendline – Dynamic Resistance
After multiple failed attempts to break above, price has formed a clean descending trendline that is acting as dynamic resistance. Each touch along this trendline has led to a short-term selloff, and price is now approaching this line again, near the Next Reversal Zone.
📌 This confluence increases the probability of another rejection unless there's a strong bullish breakout with volume.
📊 3. Bearish Channel & Breakdown
Before the recent fall, Bitcoin was trading inside a small bearish channel. This type of consolidation often results in continuation — which we saw with the downside breakout. This breakdown also increased bearish momentum and pushed BTC into the major support area.
🧊 4. Major Support Zone – The Battle Ground
Marked around the $101,000–102,000 range, this zone has acted as a strong demand area multiple times. The most recent bounce suggests that buyers are still active here. This could be the last defense for bulls in the short term.
🧠 If this zone breaks, we could see price falling toward the psychological level of $100,000 or even lower.
🌀 5. Ellipse Zone – Accumulation Structure
Early on the chart, an ellipse highlights a horizontal accumulation zone where price moved sideways before breaking out upward. This shows how smart money often enters during quiet phases before explosive moves. Watching for similar signs can provide strong trade setups.
🔄 6. Next Reversal Zone – Watch Closely
Price is now approaching the Next Reversal Zone near $104,500–105,000, which aligns perfectly with the descending trendline. This is a high-probability rejection zone where traders should be watching for bearish confirmations like wicks, pin bars, or bearish engulfing candles.
📌 Two Possible Scenarios
🟥 Bearish Scenario (High Probability):
Price touches the Next Reversal Zone and gets rejected.
We could see a drop back to the Major Support Zone.
If support breaks, expect a move toward $100K–99K in the coming sessions.
🟩 Bullish Scenario (Low Probability Without Volume):
Price breaks and closes above the trendline with strong bullish candles and increased volume.
In that case, BTC could rally toward the $107K–108K resistance and potentially flip the trend bullish.
💡 Trading Insight:
Fridays usually have low volume, leading to unexpected wicks and false breakouts. That’s why it’s important to:
Use small lot sizes
Wait for confirmations
Avoid overtrading before weekend closes
🧠 Final Thoughts:
This is a classic setup — consolidation after trend, rejection zones, trendline resistance, and strong support areas all in one chart. Whether you’re a price action trader or a structure-based analyst, this chart offers a powerful decision point.
Stay patient. Let the market reveal its hand. The next few candles around this trendline will likely dictate the next 1–3 day direction for BTC.

ZYDUS LIFESCIENCES AT BEST SUPPORT !!This is the 4 hour Chart of ZYDUSLIFE.
Zydus Lifesciences at good support zone near ₹920–₹930 range.
Zyduslife is moving in a Higher High and Higher Low (HH-HL) formation.
Stock has formed a broadening pattern within the channel.
If this level is sustain, we may see higher prices in ZYDUSLIFE.
THANK YOU !!

EURO-USD BUY STRONG 1. "EUR/USD Strong Buy Alert 🚀 | Key support zone holding firm – bulls eyeing the next leg up!"
2. "Strong Buy Zone ✅ | EUR/USD showing bullish momentum from this support level – eyes on 1.09+"
3. "EUR/USD Reversal Zone 💥 | Buyers stepping in strong – potential rally ahead!"
4. "Watch this zone! EUR/USD strong buy setup forming – bullish confirmation underway 📈"
5. "EUR/USD bouncing from key demand zone 🔥 | Technicals align for a strong buy signal!"

AUDJPY: Pullback Confirmed?! 🇦🇺🇯🇵
There is a high chance that AUDJPY will pull back
from the underlined resistance cluster.
Its false violation, a formation of a bearish imbalance candle
and a breakout of a rising trend line provide strong bearish confirmation.
Goal - 93.185
❤️Please, support my work with like, thank you!❤️
I am part of Trade Nation's Influencer program and receive a monthly fee for using their TradingView charts in my analysis.

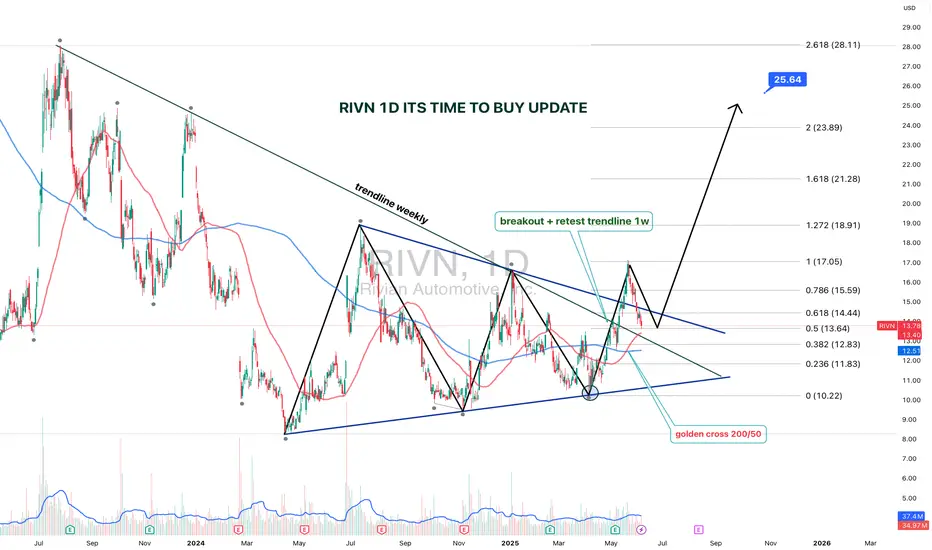
RIVN 1D — It’s Time to Buy: Setup UpdateThe setup on Rivian (RIVN) just got upgraded from “interesting” to “strategically significant.” We’re looking at a textbook symmetrical triangle that’s been developing since July 2023, with a clean breakout and retest on the weekly trendline.
The breakout was followed by a bullish retest, right at the intersection of the triangle base and the key trendline. Volume kicked in, price held — and that’s what smart money calls confirmation.
Now, the Golden Cross is live: the 50-day MA just crossed the 200-day MA from below. Price is confidently holding above both — momentum is shifting hard. Fibs from the bottom (10.22) to the last local top (17.05) project the first target at $17, and the extended Fibonacci confluence gives us $25.64 as a long-range goal (2.618 extension).
The weekly trendline — which acted as resistance for over a year — has flipped to support. Price action respects it, bulls are loading, and structure is clean.
This is not just a bounce. It’s a technical rotation from accumulation to expansion.
The time to talk about potential is over — price action has spoken.
[INTRADAY] #BANKNIFTY PE & CE Levels(06/06/2025)Bank Nifty is opening with a slight gap-up around 55800, but continues to consolidate in the same range that has held for the past few sessions. Despite attempts, no significant breakout or breakdown has occurred, indicating indecision and a potential buildup for a larger move.
Upside continuation will only be confirmed if the index sustains above 56050, opening room for a move toward 56250, 56350, and 56450+.
On the other hand, if price starts slipping back below 55900–55850, the index may retrace toward 55750, 55650, and 55550. Breakdown below 55450 will be a clear sign of weakness, targeting 55250, 55150, and 55050.

#NIFTY Intraday Support and Resistance Levels - 06/06/2025Nifty is opening with a slight gap-up around 24750–24760, placing it just above a key resistance-turned-support level. This setup suggests early optimism, but follow-through momentum is crucial for confirmation.
If Nifty sustains above 24800, it may pave the way for a smooth upside toward 24850, 24900, and 24950+. This range could act as a momentum zone for intraday buyers if volume supports the move.
On the flip side, a slip back below 24700 may signal weakness and open downside targets at 24650, 24600, and 24550, pulling Nifty back into a broader consolidation range.

GBPUSD Potential UpsidesHey Traders, in today's trading session we are monitoring GBPUSD for a buying opportunity around 1.35400 zone, GBPUSD is trading in an uptrend and currently is in a correction phase in which it is approaching the trend at 1.35400 support and resistance area.
Trade safe, Joe.

Nightly $SPY / $SPX Scenarios for June 6, 2025 🔮 Nightly AMEX:SPY / SP:SPX Scenarios for June 6, 2025 🔮
🌍 Market-Moving News 🌍
🇺🇸 U.S. Labor Market in Focus
Investors are closely watching the upcoming May employment report, which is expected to show a gain of 125,000 jobs, down from 177,000 in April. The unemployment rate is anticipated to remain steady at 4.2%. These figures will provide insights into the labor market's response to recent economic pressures, including tariff impacts .
🇮🇳 RBI Expected to Cut Rates Amid Low Inflation
The Reserve Bank of India (RBI) is anticipated to announce a 25 basis point cut in the repo rate on June 6, marking the third consecutive reduction. This move aims to support economic growth amid persistent low inflation and global uncertainties .
📊 Key Data Releases 📊
📅 Friday, June 6:
8:30 AM ET – U.S. Employment Report (May):
Analysts expect non-farm payrolls to increase by 125,000, with the unemployment rate holding at 4.2%. Average hourly earnings are projected to rise by 0.3% month-over-month. These figures will be critical in assessing the health of the labor market and potential Federal Reserve policy actions .
3:00 PM ET – U.S. Consumer Credit (April):
The Federal Reserve will release data on consumer credit, with forecasts predicting an increase of $10 billion. This report will shed light on consumer borrowing trends and financial health .
⚠️ Disclaimer:
This information is for educational and informational purposes only and should not be construed as financial advice. Always consult a licensed financial advisor before making investment decisions.
📌 #trading #stockmarket #economy #news #trendtao #charting #technicalanalysis

3,367% or $3 to $124 in 1 week!🚀 $3 to $124 in 1 week or +3,367% is the kind of stock we all live for!
NASDAQ:SBET was May's power mover, let's see which one does this in June!

USDCAD Potential DownsidesHey traders, in today's trading session we are monitoring USDCAD for a selling opportunity around 1.37500 zone, USDCAD is trading in a downtrend and currently is in a correction phase in which it is approaching the trend at 1.37500 support and resistance area.
Trade safe, Joe.

USDJPY is Nearing an Important ResistanceHey Traders, in today's trading session we are monitoring USDJPY for a selling opportunity around 143.700 zone, USDJPY is trading in a downtrend and currently is in a correction phase in which it is approaching the trend at 143.700 support and resistance area.
Trade safe, Joe.

US & Global Market Breakdown | Profits, Losses & Bearish TradesIn this video, I break down the current state of the US and global economy, and why I believe we’re heading into a bearish phase.
📉 Fundamentals:
I cover the key macroeconomic factors influencing the markets — including Trump’s proposed new tariffs, slowing GDP growth, and ongoing supply chain constraints. These all point toward increasing pressure on the global economy.
📊 Technical Analysis:
I go over the major indexes and highlight their recent behavior. We’ve seen reactions from resistance levels, contraction patterns forming, and a significant volume dry-up — followed by today’s spike in volume, which occurred right at resistance. These are potential signs that the market may be shifting toward a bearish trend.
That said, we could still just be witnessing a deeper pullback within a longer-term uptrend. Markets are unpredictable, and no one knows for sure — which is why it’s important to always do your due diligence.
💰 I also review the profits and losses I’ve taken on recent bullish trades, and why I’ve now positioned myself in select short opportunities based on what I’m seeing.
If I’m sharing this, it’s because I’m personally investing my capital based on my conviction — so always use your own judgment and risk management when making decisions.
If you found value in the breakdown, leave a like, comment, and subscribe for more timely updates.

Gold Potential UpsidesHey Traders, in today's trading session we are monitoring XAUUSD for a buying opportunity around 3,370 zone, Gold is trading in an uptrend and currently is in a correction phase in which it is approaching the trend at 3,370 support and resistance area.
Trade safe, Joe.

EUR/USD Long📍 Entry (Buy Limit):
1.1085
This is just above the 1.1000 psychological level but below previous minor structure at 1.1100.
Captures a shallow retest without risking being front-run by liquidity sweeps.
🛑 Stop Loss (SL):
1.0910
Below consolidation zone and wicks around 1.10
Provides enough space beneath the major breakout level while staying tight for R:R
🎯 Take Profit Targets:
TP1: 1.1500 (Previous weekly resistance, already tested but not broken)
TP2: 1.2000 (Next clean monthly structure level)
TP3 (macro): 1.2400 (Upper range of long-term channel, highly reactive zone)
⚖️ Risk/Reward:
Risk: ~175 pips
Reward:
• TP1: ~415 pips
• TP2: ~915 pips
• TP3: ~1,315 pips
R:R = 2.4 to 1, 5.2 to 1, 7.5 to 1

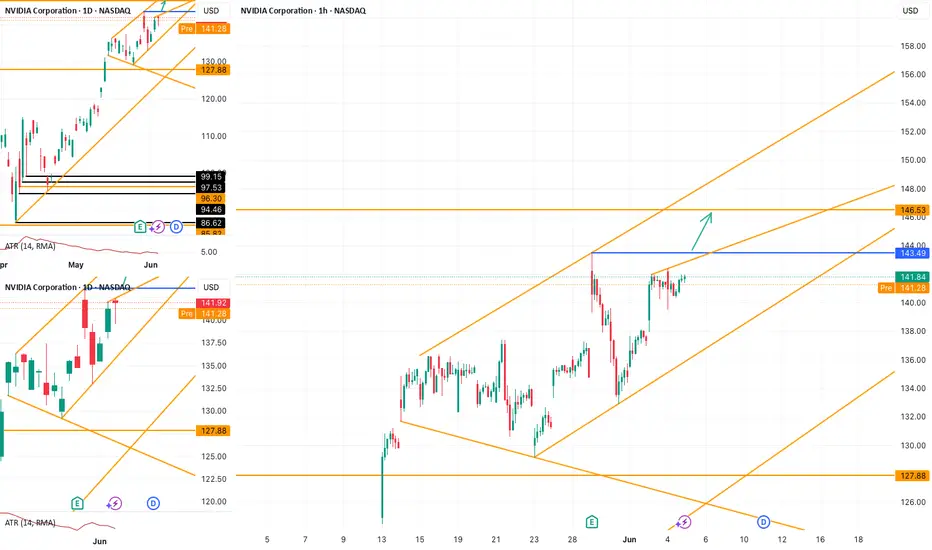
NVDA Setup: Clean Path to 146.53 If 143.49 Gives WayNASDAQ:NVDA continues to move within a rising channel. On the 1H chart, no major trendline currently limits further upside. If price breaks above the key swing high at 143.49 , the next potential target lies around 146.53 .
GOLD (XAUUSD) Technical Analysis – MMC Strategy Breakdown🧠 Conceptual Foundation:
This analysis is rooted in Market Maker Concepts (MMC), focusing on how smart money manipulates liquidity, traps retail traders, and shifts structure before making big moves. The GOLD market today gave us a high-probability setup that combined several key technical elements: SR interchanges, structure shifts, trendline breaks, and a major arc pattern.
Let’s dissect it step-by-step:
1️⃣ Initial Downtrend & Liquidity Sweep
In the early part of the chart, GOLD was in a clear bearish trend, forming lower highs and lower lows, consistently respecting a descending trendline. This downtrend attracted retail sellers who kept entering shorts, reinforcing the bearish sentiment.
🔻 However, right before the reversal, GOLD made a sharp move down to grab liquidity below previous lows near the $3,361–$3,364 support zone. This is a classic MMC liquidity trap — clearing out stop-losses of early buyers before initiating a reversal.
2️⃣ SR Interchange Zones (Smart Money Play)
Around the levels of $3,361 and $3,364, we noticed strong Support-Resistance Interchange (SR Flip) behavior:
These zones were first used as support during the initial decline.
Once broken, they acted as resistance, and again flipped to support post-breakout.
This flip signals institutional involvement — smart money often builds positions in these zones.
These interchanges also acted as the base of accumulation, preparing for a bullish breakout.
3️⃣ Trendline Breakout – Early Reversal Confirmation
As the price consolidated and coiled around the SR zones, it finally broke the descending trendline — a major reversal signal.
This breakout was accompanied by strong bullish candles, showing a sudden shift in momentum. It's likely that smart money stepped in aggressively, initiating a structure shift.
4️⃣ Arc Pattern Formation – Visual Clue of Accumulation
The most eye-catching part of this chart is the arc pattern — a rounded bottom formation. This type of pattern typically indicates accumulation phase, where institutions quietly enter positions while retail sentiment is confused or bearish.
🟡 The arc acts like a pressure cooker: as price coils and liquidity builds, it eventually explodes in the direction of accumulation — in this case, bullish.
5️⃣ Structure Shift – Confirmation of Bullish Intent
Once price broke above the internal structure (previous lower highs), it confirmed a structure shift from bearish to bullish.
📈 This is one of the most critical elements in MMC:
It tells us that smart money has reversed the flow.
The shift often leads to expansive moves in the new direction (as we saw here).
6️⃣ Next Reversal Area (Key Supply Zone)
Price continued surging upward and reached a predefined Reversal Area around $3,405–$3,410. This zone is likely to contain historical supply and institutional sell orders.
As expected:
Price showed early rejection signs from this level.
A potential short-term pullback or distribution phase may now be underway.
If bulls reclaim this zone, it may lead to further upside toward $3,420–$3,430.
📌 Key Technical Highlights:
Component Observation
Trendline Clean break signals momentum shift
SR Interchange Zones Strong demand re-entry near $3,361–$3,364
Arc Pattern Indicates bottoming and accumulation phase
Structure Shift Broke prior lower highs confirming bullish bias
Reversal Zone $3,405–$3,410 acting as resistance; possible rejection/pullback point
🔮 What to Expect Next?
If price rejects the $3,405–$3,410 zone again and forms a lower high, expect a pullback to $3,375–$3,380.
A break above the reversal zone with strong volume may open the door to new highs, targeting $3,420+.
Use caution around news events or high-impact fundamentals (e.g., USD data releases).
💡 Trading Strategy Ideas:
✅ Long Scenario (Already Played Out):
Entry: Post-trendline break + arc confirmation
TP1: Reversal Zone at $3,405
SL: Below $3,361 SR Flip
🔁 Potential Short Setup:
Entry: On bearish confirmation from $3,405–$3,410
TP1: $3,375
TP2: $3,364
SL: Above $3,412 (reversal zone high)
📢 Final Thoughts:
This chart is a great example of how MMC (Market Maker Concepts), when combined with clean price action tools like trendlines, SR zones, and structure shifts, can offer high-accuracy trades.
Don't chase price. Wait for zones to react. Let the market show its hand before taking action.

ALTseason May Show Up In 2025We found an interesting chart, which is showing us the ratio of TOTAL3(ALTcoins) market cap against Bitcoin with ticker TOTAL3ESBTC. Well, even this chart is showing that ALTcoins may start outperforming BTC soon. It can be finishing final subwave C of (Y) of a correction in blue wave B that can cause a new strong rally into wave C, which can bring the ALTseason similar as in the beginning 2021.

Is This the Optimal Entry After a PDL Sweep and FVG Retest?A clean structural development on CHFJPY (1H TF)
After sweeping the Previous Day’s Low (PDL), price created a bullish Break of Structure (BOS) to the upside , shifting short-term sentiment. This BOS was followed by a precise retest into a Fair Value Gap (FVG), suggesting possible continuation as liquidity shifts from weak hands to strong.
🧠 Educational Notes :
CRT Sweep Logic: Market often sweeps the previous day's high or low before making its true move. In this case, a clean PDL sweep was followed by a strong bullish reaction.
Break of Structure (BOS): Confirmed bullish intent after the sweep, validating a shift in order flow.
FVG Retest: Institutional pricing inefficiency filled — a classic SMC continuation behavior.
Entry Thesis: Based on reaction from FVG + BOS confirmation, with invalidation below the swept low and TP near the previous swing high.
This setup is not financial advice, but a clear visual case study for traders applying SMC + CRT logic.

USDCHF: Bearish Wave Ahead 🇺🇸🇨🇭
Quick update for USDCHF.
Earlier on Monday, I shared a bearish forecast based on a
confirmed violation of a neckline of a head and shoulders pattern on a daily.
We got quite a deep retest of that and bears finally showed their presence.
I remain bearish bias and expect a bearish continuation soon.
❤️Please, support my work with like, thank you!❤️
I am part of Trade Nation's Influencer program and receive a monthly fee for using their TradingView charts in my analysis.

GBPUSD: Potential Reversal After Strong RallyThe British Pound has shown strong gains against the US Dollar, approaching a key resistance area. After such an extended move, a correction or reversal would be a logical expectation.
Technical Setup
There is a clear series of bearish divergences on the CCI (14) indicator. Price is forming a narrowing rising wedge, which often signals trend exhaustion.
Trade Plan
Sell limit orders: 1.3690 and 1.3850
Market entry: Only after confirmation — either a trendline break or a moving average crossover
Conclusion
GBPUSD shows signs of weakening at the top. I remain focused on short setups from resistance areas, waiting for confirmation to act.
