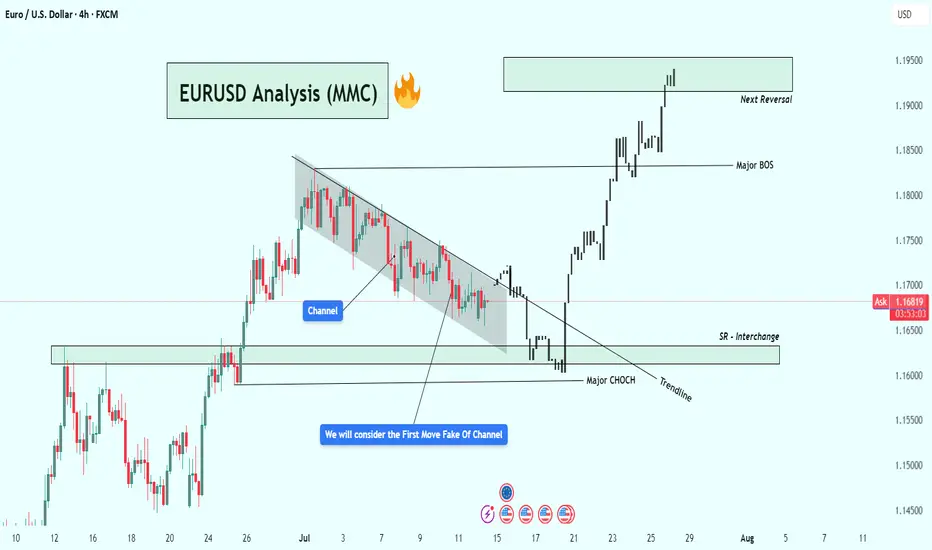
EURUSD Analysis – Smart Money Breakout + Reversal Zone in Play🔹 1. Bearish Channel & Liquidity Trap Setup
Price action from late June into mid-July formed a clearly defined descending channel, with consistent lower highs and lower lows. This structure likely attracted retail traders into short positions, expecting continued downside.
💡 Key Insight: The initial breakout of the channel was a fake move — often referred to as a liquidity grab or inducement. This is typical in smart money models where institutions trap early traders before the real move begins.
🔹 2. Major CHoCH (Change of Character)
Shortly after the fakeout, price sharply reversed and broke a major internal structure level, giving us our first CHoCH confirmation. This is a critical event in SMC, signaling a possible trend reversal from bearish to bullish.
Why it matters: A CHoCH after a channel + fakeout combo is a strong reversal signal, especially when supported by volume and aggression.
Visual cue: Look at the bullish engulfing momentum candle post-fakeout — this was the moment smart money entered.
🔹 3. Trendline Break + SR Interchange (Support/Resistance Flip)
Following the CHoCH, price broke the trendline and came back down to test a high-probability SR Interchange Zone — an area where previous resistance turned into fresh support.
This zone also aligns with the order block and inefficiency area, making it a premium entry for institutions.
Notice how price respected the zone before launching aggressively upward.
🧠 Note: This was the cleanest entry point in this setup — combining structure break, liquidity, and a demand zone.
🔹 4. Major BOS (Break of Structure)
After the retest, EURUSD broke the last major lower high, confirming a Bullish BOS (Break of Structure). This is where many traders realized the trend had shifted.
Market sentiment flipped from bearish to bullish.
Momentum increased, indicating institutional buying pressure.
🔹 5. Next Target: Reversal Zone (Supply Area)
Price has now reached a critical supply zone (1.1930 – 1.1970) where the next major reaction is likely to occur. This area was previously a strong rejection point, and it aligns with a potential higher timeframe supply zone.
⚠️ Watch for:
Bearish rejection wicks
Liquidity sweeps above highs
Bearish engulfing or mitigation patterns
CHoCH on lower timeframes (1H, 15m)
✅ Key Trading Takeaways:
Liquidity Trap: Retail was trapped inside a clean channel.
Fakeout Move: Induced shorts were wiped out.
CHoCH & BOS: Clear reversal pattern with momentum.
Perfect Retest Entry: Price retested demand and launched.
Current Area = Supply/Distribution: Great place to look for shorts or take profits.
📌 Possible Trading Plans:
🔸 Plan A: Reversal Short (Countertrend)
Entry: Inside 1.1930–1.1970 zone
Confirmation: Bearish PA + LTF CHoCH
TP1: Previous BOS (~1.1830)
TP2: Demand zone retest (~1.1650)
SL: Above 1.1980–1.2000
🔸 Plan B: Continuation Long (Breakout Bias)
Entry: Break + Retest above 1.2000 psychological level
SL: Below breakout wick
TP1: 1.2100
TP2: 1.2200+
🔖 Concepts Applied:
Smart Money Concepts (CHoCH, BOS, liquidity sweep)
Price Action Structure
Trendline break and retest
Supply & Demand Zones
Support/Resistance Flip (SR Interchange)
Volume + Momentum Confirmation
🔄 Conclusion:
This chart demonstrates a classic Smart Money narrative:
“Trap the retail, shift the structure, drive price into premium, then reverse.”
We're now at a make-or-break supply zone. Watch price behavior carefully — this is where smart traders either secure profits or prepare for the next leg.
Technical Analysis
[INTRADAY] #BANKNIFTY PE & CE Levels(14/07/2025)Bank Nifty is expected to open slightly gap-down, continuing the weakness observed in the previous sessions. The index is currently trading around the 56700 level after facing consistent resistance near the 57100 zone. If the index sustains below the 56950–56900 region, it may extend the downside toward 56750, 56650, and further down to 56550.
A break below 56650 could trigger a sharper fall, with the next key support levels placed at 56250, 56150, and 56050. These zones will be critical to watch for potential reversal or further breakdown.
On the upside, any strength and breakout above the 57050–57100 resistance zone may open the path toward higher levels like 57250, 57350, and 57450+. However, unless this zone is breached with strength, upward movement is likely to remain capped.
The overall structure indicates bearish pressure, and the price action near 56900–56650 will decide the intraday trend. Traders should remain cautious and react based on levels with proper risk management.

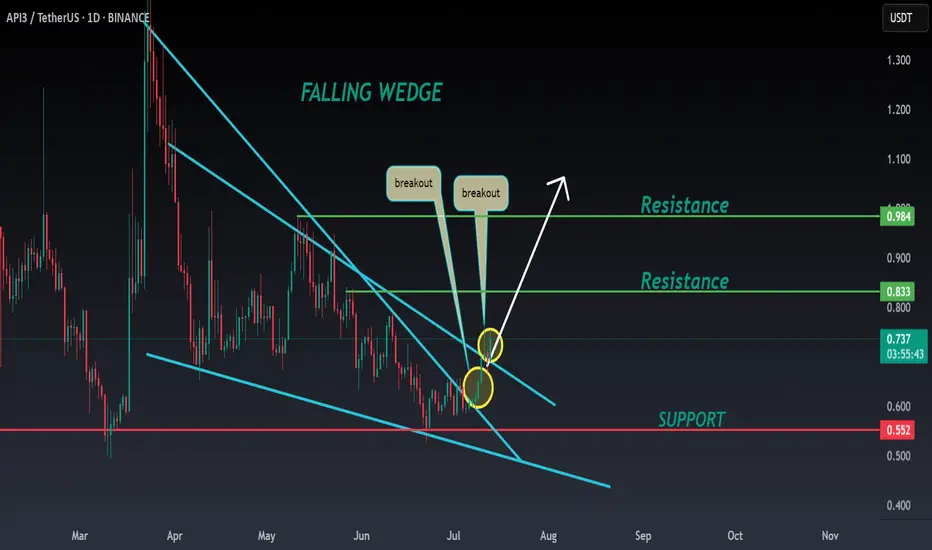
API3 ANALYSIS🚀#API3 Analysis :
🔮As we can see in the chart of #API3 that there is a formation of "Falling Wedge Pattern". In a daily timeframe #API3 broke out the pattern. Expecting a bullish move in few days if #API3 retest the levels
⚡️What to do ?
👀Keep an eye on #API3 price action. We can trade according to the chart and make some profits⚡️⚡️
#API3 #Cryptocurrency #TechnicalAnalysis #DYOR
$7.73 to $76.00 in 1 day! Another 800% runner $INKTAGAIN? Another 800% runner in a day? 🚀 Such massive moves became a daily thing these days? 😲 NASDAQ:INKT
Can't wait to see new one in the morning!

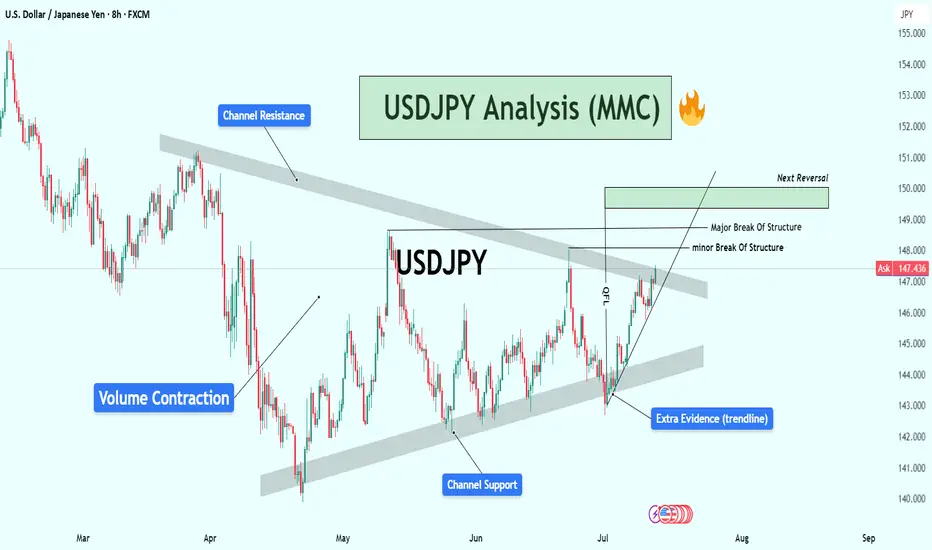
USDJPY Analysis : Major Move Loading Towards Target Zone🕵️♂️ Overview
The USDJPY pair is approaching a critical turning point within a well-established descending channel structure. After several months of corrective movement and internal structure shifts, the market is now displaying multiple layers of confluence pointing toward an impending major reaction or reversal. Let’s break down this chart step by step.
🧱 Market Structure Analysis
🔹 Descending Channel:
The entire chart is governed by a broad descending channel, with price making lower highs and lower lows since early March.
Each touch of the channel support has led to a bounce, and the price is now once again near channel resistance, creating a possible reaction zone.
🔹 Volume Contraction Phase:
In the mid-section of the chart, we observe volume contraction, indicating liquidity drying up and buyers/sellers entering a phase of uncertainty.
This contraction is typical in accumulation or re-accumulation phases, which often precede strong impulsive moves — exactly what followed here.
🧩 Structural Breaks and Trendline Clarity
🔸 Minor Break of Structure:
A recent high was taken out in early July, marking a minor break of structure (BOS), showing the first signs of bulls taking short-term control.
🔸 Major Break of Structure:
A more significant high (marked on the chart) has also been broken, confirming a major BOS — this implies institutional positioning or a shift in market sentiment.
🔸 Trendline Break – Extra Confirmation:
The bullish push came after breaking a clean internal trendline, which acted as diagonal resistance.
Once this trendline broke, price aggressively accelerated upward — this is a classic market maker cycle (MMC) Phase 2 (expansion) move.
📍 Confluence at Next Reversal Zone (149.00 – 150.00)
The green highlighted zone is the next potential area for bearish pressure to return, based on:
Key Supply Zone: Historical area where sellers previously dominated.
Channel Resistance Confluence: Top of the descending channel aligns with this zone.
Psychological Level: 150.00 is a major psychological round number — often attracts profit-taking and institutional activity.
Fibonacci (if plotted): Likely 78.6% – 88.6% retracement from last swing high.
Overextended Rally: Price has rallied strongly since early July with very little correction — it’s approaching exhaustion.
🔄 Market Maker Cycle (MMC) Alignment
This move perfectly reflects the Market Maker Cycle:
Accumulation: During volume contraction phase.
Manipulation: Fakeouts near channel support to trap shorts.
Expansion: Break of structure + trendline, aggressive rally.
Distribution (Next): Likely to occur at the 149–150 zone with a sharp rejection.
🧠 Trader’s Plan – What to Look For
📈 If Bullish:
Targets: 148.80 to 149.80 zone
Hold until rejection signs (bearish candles, volume spikes, divergences)
SL: Below recent swing low/trendline (~146.00)
📉 If Bearish (After Rejection):
Watch for:
Strong bearish engulfing candle or shooting star
RSI/MACD divergence (not shown but suggested)
Break of short-term ascending trendline
Targets: Back toward 145.50 or mid-channel (dynamic)
🔖 Summary
USDJPY is showing clear signs of bullish exhaustion near the upper channel resistance and major structure levels. If price respects this zone (149–150), expect a healthy corrective leg or full reversal. Multiple layers of technical evidence, including structure breaks, trendline breach, and MMC phases, are aligning for a high-probability play.
This is a textbook setup for experienced traders watching key zones with proper confirmations.
XAGUSD Weekly Analysis (MMC) : Bullish Channel Toward Target🧠 1. Trend Shift Confirmed – Silver in Full Bullish Momentum
Silver has officially broken free from its multi-year sideways range and has entered a well-defined ascending channel, pushing toward higher highs week after week. The momentum is strong and supported by a combination of technical elements, structure shifts, and clean retests.
The trend is now clear: bullish, with the price aiming for the Next Reversal Zone between $46 and $48 — a level not seen since mid-2020.
🔷 2. Blue Ray Break – Start of the Rally
The breakout began with a clean move above the Blue Ray trendline, a key structure that had suppressed Silver’s growth for several years.
As the chart notes:
“Blue Ray Always Continue Trend” — until broken.
Once Silver broke above this resistance, it not only confirmed the trend reversal but also triggered the formation of a new bullish market structure, supported by aggressive buying.
🔁 3. SR – Interchange Zone Holding Strong
The SR Interchange zone (around $27 – $30) has played a critical role in this breakout. It acted as:
Resistance during the multi-year range.
Then Support after the breakout, confirming a classic Support-Resistance Flip (SRF).
This zone now serves as a solid demand base, giving the rally a stable foundation to push higher.
🪙 4. QFL Formation – Momentum Confirmation
The breakout also aligns with a QFL (Quick Flip Level) structure — a powerful bullish continuation pattern.
QFL setups form when price breaks above a former base, pulls back slightly, and then quickly resumes the upward trend.
This indicates that buyers are aggressive and unwilling to let price fall too far, fueling a rally.
Combined with the ascending channel, the QFL structure gives extra confidence that Silver is on track to reach the $46–$48 Reversal Zone.
📏 5. Trendline & Channel – Price Structure in Control
Silver is currently moving cleanly within an ascending parallel channel, respecting both upper resistance and lower support trendlines. The inner trendline has been tested multiple times, and price is now riding its upper half.
This shows:
Buyers are in control.
Each correction is shallow.
Market confidence is growing week after week.
Expect volatility to increase as Silver approaches the next target area.
🎯 6. Next Reversal Zone: $46 – $48
The green box at the top marks the Next Reversal Zone, where Silver might:
Stall temporarily and consolidate.
Or face a pullback back toward the mid-channel line or lower support.
This zone corresponds to:
Historical supply area (2020 highs)
Strong psychological resistance
Potential profit-taking by institutions or swing traders
🔭 Trade Scenarios to Watch
✅ Bullish Continuation:
If Silver maintains support above $36 and remains inside the ascending channel, we may see a smooth ride into the reversal zone. Look for:
Break-and-retest of the midline
Bullish candles with long wicks on dips
⚠️ Short-Term Rejection:
If price reaches $46–$48 and shows signs of exhaustion (like long upper wicks, evening star, or bearish engulfing), expect a healthy pullback toward $35–$36 or even $32.
As long as the ascending structure holds, bulls remain in control.
🧩 Key Technical Levels
Element Zone / Level Action
SR Interchange Support $27 – $30 Strong demand zone
Blue Ray Breakout Confirmed Trend reversal signal
QFL Zone Around $36 Retest and rally confirmation
Reversal Zone $46 – $48 High-probability reaction area
Trendline Support Dynamic ($35–$36) Bullish channel continuation
📌 Final Thoughts:
Silver is now playing in the big leagues again. With the Blue Ray broken, QFL confirmed, and price following a disciplined trendline channel, this rally looks both technically sound and fundamentally strong.
Watch the $46–$48 zone carefully. Whether price rejects or breaks through, there will be high-probability setups for both breakout traders and dip buyers.
Stay disciplined, don’t chase, and let price give you confirmation.

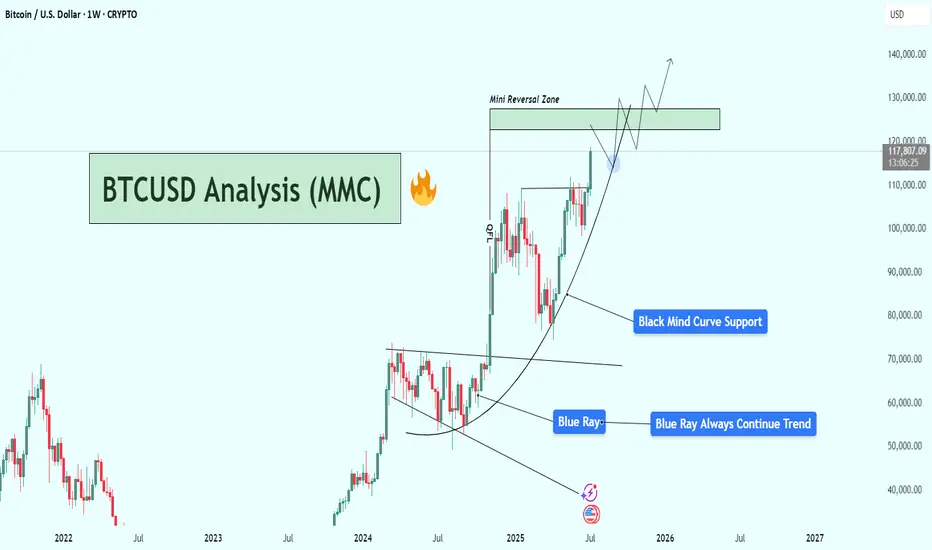
BTCUSD Weekly Analysis : Testing $130K Resistance + Next Target📌 1. Big Picture – Bitcoin is in a Parabolic Uptrend
This chart clearly shows that Bitcoin has shifted from a consolidation phase into a full-blown parabolic rally. That’s not just random growth — it’s an aggressive, momentum-driven market move that usually only happens during major bull cycles.
The curve shown in black — labeled “Black Mind Curve Support” — is your guide here. It's not a simple trendline. It shows how Bitcoin is accelerating upward, and this curve acts as a dynamic support. Every time price dips to it, buyers jump in fast — which shows strong bullish pressure and market confidence.
🔍 2. Blue Ray Broken = Trend Change Confirmed
Earlier, BTC was stuck under the Blue Ray, a long-term resistance trendline. As marked:
“Blue Ray Always Continue Trend”
That means, as long as price stays under it, the market is bearish. But guess what?
BTC broke above it — strongly.
That break confirmed a reversal in long-term structure, and it triggered this massive upward move. This breakout also aligned with a pattern of higher highs and higher lows, further confirming that bulls are now in full control.
🧠 3. Current Situation – Heading Into Mini Reversal Zone
Now BTC is trading around $117,820, and it's approaching the green box labeled Mini Reversal Zone — between $125,000 and $135,000.
Why is this area important?
It’s a psychological zone (big round numbers).
It lines up with historical resistance and previous supply zones.
It’s where smart money might take some profit, so we could see rejection or a short-term pullback here.
🎯 4. Two Scenarios to Watch
✅ Scenario A: Mini Pullback & Retest
BTC hits the Mini Reversal Zone → stalls → pulls back → retests the Black Mind Curve → bounces again.
That’s bullish and normal in a healthy uptrend. If you missed earlier entries, this pullback could be your golden opportunity.
🚀 Scenario B: Breakout of Reversal Zone
If Bitcoin breaks above $135K with strong momentum and closes the weekly candle high, we may see another parabolic rally toward $140K+.
This would mean even stronger buyer interest, possibly driven by FOMO, ETFs, or macro news.
📉 What Could Invalidate the Bullish Move?
Only if BTC:
Breaks below the Black Mind Curve, and
Starts closing weekly candles under $105K–$100K
That would mean the curve is broken, momentum is lost, and we might go into a consolidation or deeper correction.
But for now? No signs of weakness. Trend is strong, volume is rising, and price action is clean.
🧩 Summary of Key Levels
Type Level Notes
Curve Support Dynamic ($105K–$110K) Critical for trend continuation
Mini Reversal Zone $125K – $135K Watch for rejection or breakout
Bullish Target $140K+ If breakout holds above reversal zone
Trend Indicator Black Mind Curve As long as price rides this, bulls are in control
📌 Final Thoughts
This BTC chart isn’t just a random uptrend — it’s a well-structured parabola, powered by strong technical support and clean breakouts. Everything is lining up for a potential monster move, but don’t chase price blindly.
Watch the Mini Reversal Zone closely. If we see rejection, be ready to buy the dip. If we break through with volume — it’s 🚀 time again.
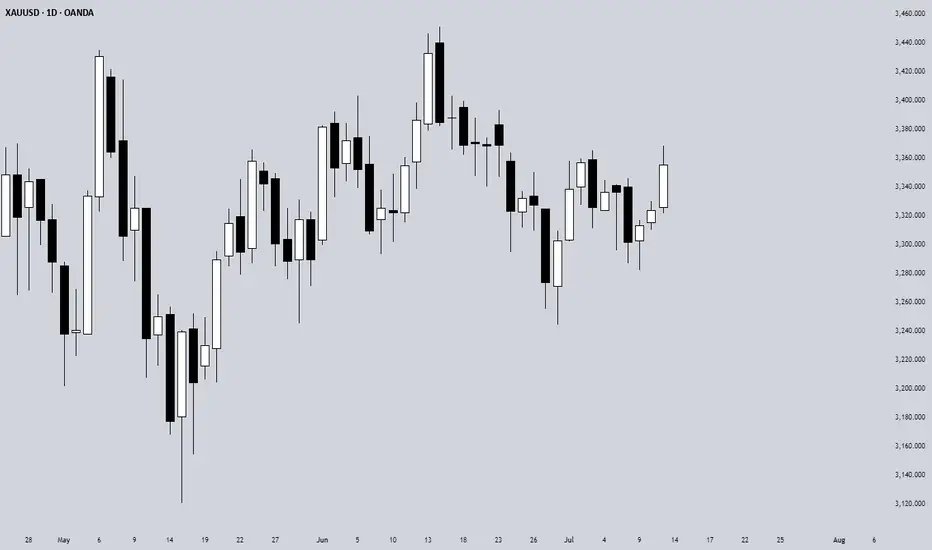
XAUUSD Analysis : Bullish Move Toward Key Resistance + Target🟩 Overview:
Gold is currently showing a clear bullish breakout on the 2-hour timeframe. The market structure has shifted from a downtrend into a bullish phase, with price now approaching a critical Reversal Zone. Let’s break down the key levels, structure shifts, and potential trade opportunities.
🔍 1. Structure Shift – Trendline Break & BOS Signals:
The price previously followed a Blue Ray Descending Trendline, which acted as dynamic resistance and guided the bearish trend.
As highlighted, “Blue Ray Always Continue Trend” – but in this case, we’ve seen a clean Break of Structure (BOS) that invalidated the bearish setup.
A Minor BOS occurred first, which hinted at weakening selling pressure.
Later, a Major BOS confirmed the bullish transition as the price broke above a key resistance level with strong momentum.
This transition was supported by consistent higher lows and a breakout above the descending resistance trendline — a classic reversal signal.
🟩 2. Demand Zone Reaction – Major Support Held Firm:
The Major Support Zone between $3,280 – $3,300 provided a strong base for buyers.
Multiple wick rejections and bullish engulfing patterns near this zone indicated aggressive buyer interest.
This support has now become the foundation for the recent bullish rally.
🎯 3. Next Target & Reversal Zone:
The current price is hovering around $3,358, showing strong bullish momentum.
The next major resistance area is marked between $3,380 – $3,400, identified as the Next Target + Reversal Zone.
This zone is critical — it aligns with a historical supply area and the previous market swing highs.
Traders should be cautious here, as price may react sharply. Reversal patterns (like bearish engulfing, pin bars, or double tops) could signal a potential retracement.
⚠️ 4. Trade Plan:
🟢 Bullish Bias (Short-Term):
If you entered from the support or trendline breakout, continue to hold long positions until price nears the reversal zone.
Trail stop-loss under the most recent higher low to secure profits.
🔴 Bearish Scenario (Near-Term Reversal Play):
Watch for bearish rejection patterns in the $3,380 – $3,400 zone.
If confirmation appears, potential short setups could offer a retracement back to $3,330 – $3,320.
📌 Key Levels Summary:
Major Support Zone: $3,280 – $3,300 ✅
Next Target + Reversal Zone: $3,380 – $3,400 ⚠️
Current Price: $3,358
Major BOS Level: Confirmed
Trendline: Broken with strong bullish pressure
🧠 Final Thoughts:
Gold has officially shifted gears. The bullish breakout is in motion, and the trendline break + BOS combo supports further upside — at least until the reversal zone is tested. However, this is also where the market could exhaust, making it crucial to monitor price action closely.
Stay patient, wait for confirmation, and let the levels guide your next move.

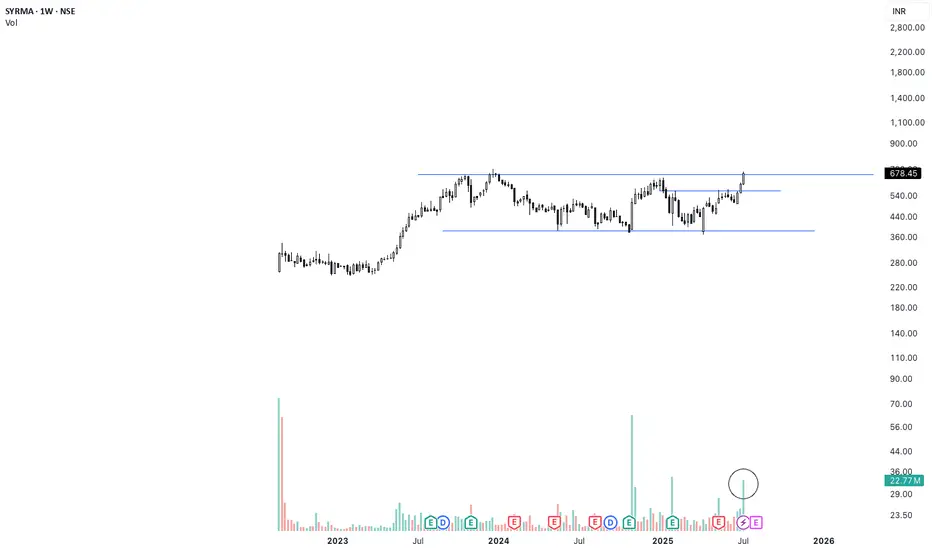
SYRMA Weekly Breakout | High Volume + 1.5-Year Base Structure🚨 Breakout Alert on SYRMA (Weekly)
After 1.5 years of sideways consolidation, SYRMA has finally broken out with strong conviction. The breakout is supported by the highest weekly volume seen in months — signaling smart money accumulation.
📊 Technical Setup:
🔹 1.5-year base formation now broken
🔹 Breakout candle closed above resistance with strength
🔹 Volume spike confirms breakout validity (HVE)
🔹 Structure resembles classic Stage 2 breakout
🟢 Ideal retest zone: ₹670–₹680
🛑 Support zone: ₹635–₹645
Fundamental Snapshot:
✅ Revenue: ₹2,000 Cr → ₹3,800 Cr in 2 years
✅ Net Profit up 50% YoY
✅ EPS (TTM): ₹9.57
✅ Promoter holding: ~46%
✅ Dominant player in EMS & IoT hardware
⚡Macro trend supports domestic electronics manufacturing — still early in the cycle.
LTTS Weekly Trade Setup(14th-18th July 2025) – Parallel ChannelThis week, L&T Technology Services (LTTS) is showing a potential breakout opportunity that requires patience and precision. As the stock approaches a key resistance zone near ₹4445, traders should resist the urge to jump in early and instead wait for a breakout and confirmed re-test before entering any long positions.
Let’s break this down.
1. Why the Breakout is Important
- LTTS has been consolidating within a parallel channel between ₹4280 (support) and ₹4445 (resistance). Breakouts from such structures often trigger significant moves — but only when confirmed.
- A false breakout can trap early traders. Hence, waiting for the price to break above ₹4445 and then re-test this level is critical.
2. The Strategy – Wait and React
📌 Step 1: Watch for Breakout
Monitor price action as it approaches and breaches the ₹4445 resistance.
Look for strong bullish candles with volume to validate the breakout.
📌 Step 2: Wait for Re-test
After breakout, price may pull back to test the previous resistance.
This re-test acts as a confirmation that bulls are defending the breakout.
📌 Step 3: Look for Confirmation
Enter only when you see a bullish candlestick pattern (like a bullish engulfing or hammer) near the re-test level on 15-min or 1-hour charts.
🛡️ Stop Loss:
Place your stop below the swing low of the re-test.
This protects you if the breakout fails.
🎯 Target:
Profit booking zone is near ₹4580–₹4600.
Risk/reward ratio: 1:2, 1:3, 1:4+
3. Why Re-test Entries are Powerful
They allow low-risk entries with a tight stop loss.
You avoid chasing price and reduce emotional trading.
Confirmation helps you filter out false breakouts.
4. Final Words
In trading, discipline often beats speed. This LTTS setup is all about timing and structure.
🔔 Watch for the breakout.
🧘♂️ Wait for the re-test.
🎯 Enter only with confirmation.
If executed properly, this trade offers a clean, high R:R opportunity with a clearly defined setup.

GBPJPY: floating at the top – is a drop being loaded?GBPJPY is hovering around 198.91 after an impressive rally, but now it's trapped between two key zones: 199.85 – a resistance level that keeps rejecting price, and 198.20 – a fragile support below. The price action reveals a tense sideways pattern, like a spring coiling up before release.
What’s concerning is that buyers have attempted to break above the high multiple times and failed – and each failure comes with weaker rebounds. With the Bank of England shifting toward a “pause” stance and the yen gaining mild support from rising risk-off sentiment, the market is starting to lean toward a correction.
If price breaks below 198.20, it could mark the beginning of a deeper slide back toward the lower boundary of the channel. Don’t be fooled by the silence – sometimes, calm is the precursor to a sharp fall.

AUDUSD holds bullish structureAUDUSD is currently trading around 0.6576, maintaining a clear uptrend with higher lows and strong respect for the ascending trendline. A consolidation pattern is forming just below the key resistance zone at 0.6600–0.6617, suggesting a potential breakout if price stays above the support at 0.6546.
On the news front, the Australian dollar is supported by expectations that the RBA will keep interest rates high, while the USD is under slight pressure following weaker U.S. job data this week. Additionally, improving consumer data from China – Australia’s major trading partner – is further boosting AUD sentiment.
If the price breaks above 0.6617, AUDUSD could extend its rally into next week. Buyers are in control – have you planned your entry yet?

GOLD EYES 3,360 BREAKOUT – IS THIS THE BUY SETUP?Gold is currently trading around $3,355, up 18 pips from yesterday. The bullish momentum is fueled by rising trade tensions as Trump imposes 35–50% tariffs on Canada and Brazil, along with a weakening USD and falling U.S. bond yields.
Technically, gold maintains a clear uptrend with higher lows. The $3,360 zone is now a key breakout level — if breached, price could surge toward $3,432. As long as gold holds above $3,250, the bullish structure remains intact.
What’s your move — breakout or pullback?

EURUSD: Detailed Support & Resistance Analysis 🇪🇺🇺🇸
Here is my latest structure analysis and important
supports and resistances for EURUSD for next week.
Consider these structures for pullback/breakout trading.
❤️Please, support my work with like, thank you!❤️
I am part of Trade Nation's Influencer program and receive a monthly fee for using their TradingView charts in my analysis.

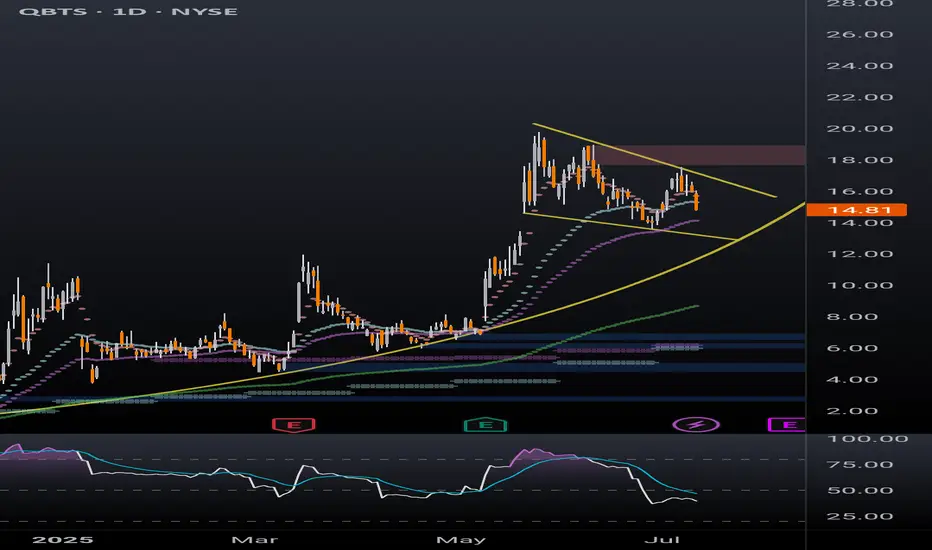
QBTS bull flag dailyBetter look at quantum computing ticker QBTS bull flag on the daily timeframe. Previous post looked at the weekly timeframe to highlight the bullish momentum. Lots of retail money piled into this one in the last few months, a breakout of this bull flag will likely be followed by a parabolic move.
A life-changing SBET long ideaSBET stock presents an amazing long opportunity that has a potential to do over 100x. After the break out of a down trend line, price retraced to the support, with price closing above this support level.
To advantage of this long opportunity, you can buy from the current market price while the exit can be at $1.34 and the targets can be at $123.70, $178.48, $541.22, $1041.90 and the final target at $2155.20.
Confluences for the long opportunity are as follows:
1. Break out of down trendline
2. Retest of the down trendline and support level.
3. Bullish divergence signal from awesome oscillator.
Disclaimer: This is not a financial advice. The outcome maybe different from the projection. Don't take the signal if you're not willing to accept the risk.

GME LONG IDEA UPDATEDIn my previous post regarding the long opportunity on GME stock, I called a long signal after a break out of a downtrend line. However, price had dropped down to the demand zone, giving another long opportunity.
To take advantage of this long opportunity, you can buy at the current market price, while the exit will be at $20.30 and the targets can be at $35.70, $47.90 and the final target at $64.70.
Confluences for the long idea are as follows:
1. Weekly break of structure
2. Valid Inducement
3. Orderflow
4. Price within the discount
5. Price respecting bullish trendline
6. Hammer candlestick confirmation
7. Price at a support level
Disclaimer: This is not a financial advice. The outcome maybe different from the projection. Don't take the signal if you're not willing to accept the risk.

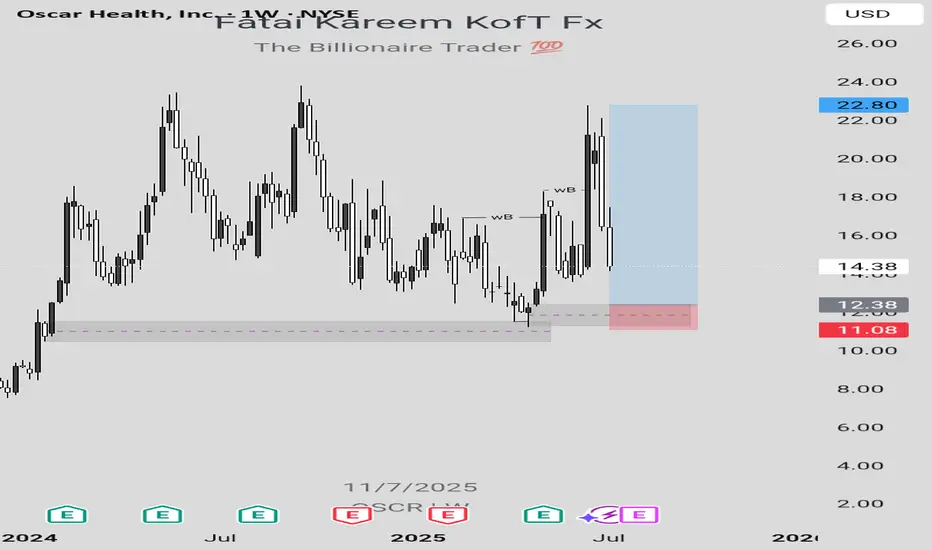
OSCR LONG IDEALooking at the weekly chart of OSCR stock, there's a long opportunity which can be taken advantage of to make some money provided that market follows the projection.
In order to take advantage of this long opportunity, a buy order limit can be placed at $12.38 while the exit can be at $11.09 and the final target can be at $22.80.
Confluences for this long idea are as follows:
1. Weekly break of structure
2. Valid Inducement (structural liquidity)
3. Orderflow
4. Sweep
5. Valid demand zone in the discount level
6. Imbalance
7. Pattern confirmation formed after mitigation of a demand zone indicating that there's a bullish change of trend.
Disclaimer: This is not a financial advice. The outcome maybe different from the projection. Don't take the signal if you're not willing to accept the risk.
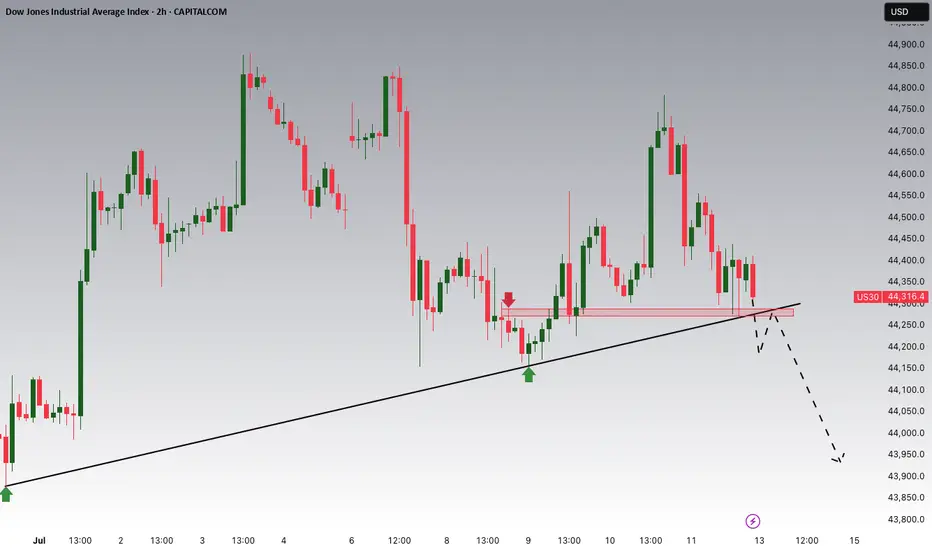
Dow Jones Potential DownsidesHey Traders, in the coming week we are monitoring US30 for a selling opportunity around 44,270 zone, US30 is trading in an uptrend and currently seems to be attempting to break it down, if we get dips below the trend we will be looking for a potential retrace towards further downsides.
Trade safe, Joe.
Overtrading – The Silent Threat to Consistent PerformanceTrader Psychology | Part 1: Overtrading – The Silent Threat to Consistent Performance
In trading, more does not mean better. One of the most common and damaging psychological pitfalls traders fall into is overtrading — executing too many trades, often without clear setups, simply to stay active in the market.
It’s subtle, it feels productive… but it quietly erodes both your capital and your discipline.
💡 What Is Overtrading?
Overtrading occurs when a trader opens excessive positions, often outside of their strategy or plan. It’s driven by emotions rather than logic, and usually shows up in one of the following forms:
Taking trades without confirmation
Trying to "make back" previous losses (revenge trading)
Forcing trades during low-volume market conditions
Trading simply out of boredom or anxiety about missing out
It’s not just about the number of trades — it’s about why you’re taking them.
⚠️ How to Know You're Overtrading
You're entering trades that don’t meet your criteria
You feel uncomfortable not having an active position
You trade aggressively after a loss
You switch strategies frequently
Your trading feels more like activity than decision-making
You’re losing more in fees/spread than on price movement
🧠 Why Overtrading Happens
🔹 The Need to Be "Active"
Traders often equate activity with productivity. But the truth is, patience is a trading skill — doing nothing is sometimes the most profitable move.
🔹 Pressure to Perform Daily
Some traders feel they must generate daily profits. This mindset leads to forcing trades during uncertain or low-probability conditions.
🔹 Overconfidence After Wins
A short winning streak can create the illusion of control, pushing traders to increase frequency and risk — usually without real setups to back it up.
🔻 The Cost of Overtrading
Rapid Drawdowns: Frequent small losses and transaction costs add up quickly
Emotional Fatigue: Decision-making becomes reactive instead of rational
Loss of Trust in Your System: Not because the system failed — but because it wasn’t followed
Increased Costs: Spreads, commissions, and swaps eat into your margin
Overtrading doesn’t just hurt your balance. It damages your confidence, focus, and mental capital.
✅ How to Stop Overtrading – Practical Fixes
1. Set a Daily Trade Limit
Commit to a maximum number of trades per session (e.g., 2–3 trades). This forces you to wait for the best opportunities.
2. Track Your Trades in a Journal
Log each trade: the setup, your reasoning, emotions, and outcome. Over time, this reveals emotional patterns and helps you regain discipline.
3. Trade Only During Key Market Hours
Avoid trading during illiquid sessions. Focus on London and New York overlaps, where structure and volatility are present.
4. Accept That Flat Is a Position
Not being in a trade is often a smart decision. Staying out preserves capital and prepares you for higher-probability setups.
🎯 Final Thoughts
Overtrading is not a technical flaw — it’s a psychological leak.
If you want longevity in this game, you must master more than charts — you must master yourself.
“The market doesn’t reward activity. It rewards patience, precision, and emotional control.”
Next time you feel the urge to trade "just because" — pause, breathe, and ask yourself: Is this trade part of my edge?
📌 Coming Up Next:
Trader Psychology | Part 2: FOMO – Why Fear of Missing Out Can Destroy Good Traders
🔔 Follow this profile to be notified when the next chapter is live.

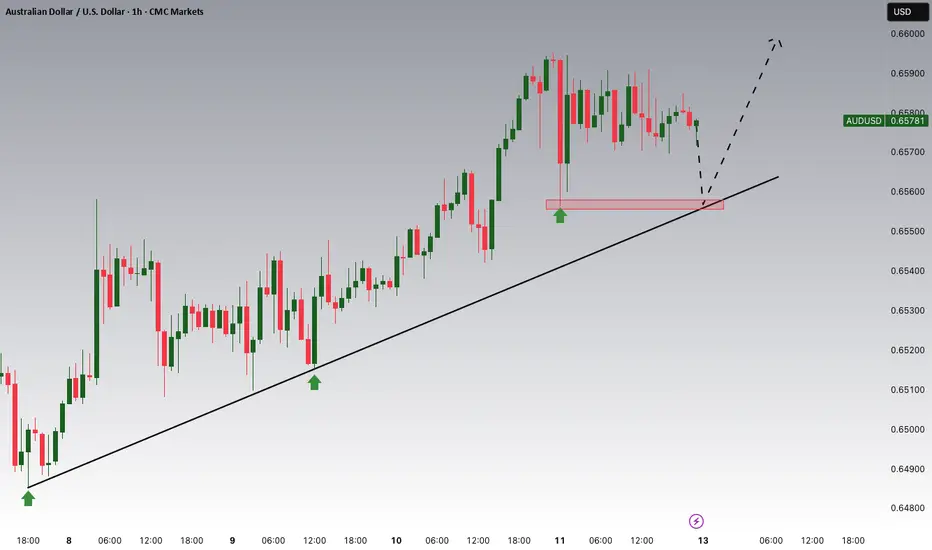
AUDUSD Potential UpsidesHey Traders, in today's trading session we are monitoring AUDUSD for a buying opportunity around 0.65550 zone, AUDUSD is trading in an uptrend and currently is in a correction phase in which it is approaching the trend at 0.65550 support and resistance area.
Trade safe, Joe.
Trend Resumes: Ethereum Breaks Consolidation, Eyes $4050Market Structure Overview:
Markets typically move in two major phases:
🔹 Trend Phase (directional movement)
🔹 Consolidation Phase (sideways movement or accumulation/distribution)
These phases repeat as: Trend → Consolidation → Trend → Consolidation
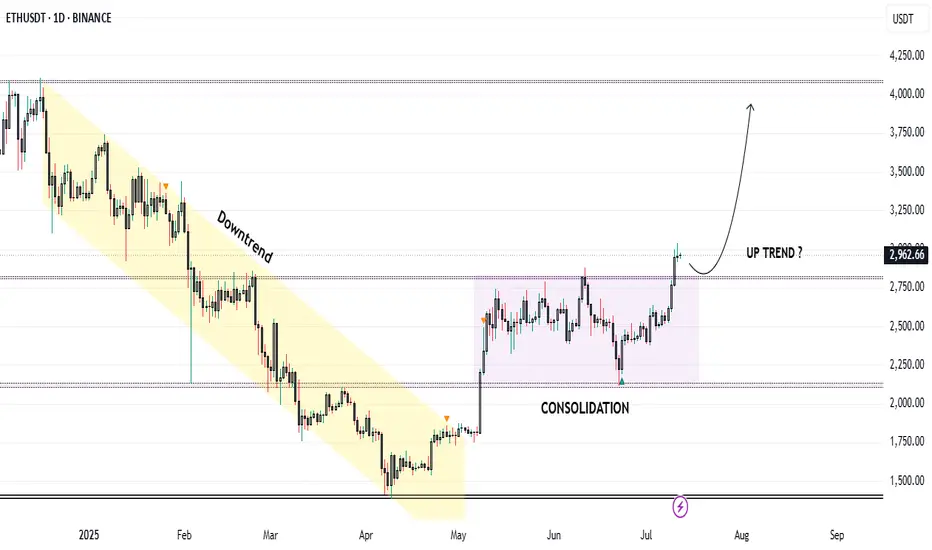
Ethereum Price Action Breakdown (Daily Timeframe):
Mid-December to End-April: Clear downtrend phase.
May to Early July: Entered a consolidation zone, forming a tight range.
Current Status (July):
🔹 Ethereum has broken out of the consolidation range.
🔹 Currently trading around $3000, confirming strength.
🔹 This breakout may potentially signal the start of Altcoin Season.
Trade Setup – Long Position Idea:
Entry (Buy Zone): Around $2850 (retest of breakout resistance).
Target:
🔹 Primary Target: $4050
🔹 This aligns with a major resistance and Fibonacci extension zone.
Stop Loss: $2600 (below key structure support).
Technical Confluences:
* Breakout above multi-week range.
* Retest of resistance turned support at \$2850.
* Psychological round level near \$3000 acting as a magnet.
* Volume confirmation on breakout (optional to mention if on chart).
Risk Note:
⚠️ Caution: The Market may turn volatile due to unexpected geopolitical or macroeconomic news. Always follow risk management and avoid overleveraging.
Conclusion:
Ethereum’s breakout from a multi-month consolidation phase indicates a potential shift in momentum. If retest levels hold, this could be the beginning of a strong upside rally, possibly leading to a broader Altcoin Season. Traders can position themselves accordingly with a well-defined risk-reward setup.
The 3-Method Framework: Simplifying Technical AnalysisMost traders get caught up in complex indicator setups, thinking that more tools equal better results. We rely on moving averages to tell us if prices are trending up or down, and we depend on support and resistance levels to predict market movement. But what if I told you there's a simpler, more powerful way to read the market using pure price action?
Today, I want to share my experience and understanding of bias and expectations for the next candle formation. This approach is refreshingly simple because we don't need to understand every single price movement - we just need to focus on what matters most.
Method 1: Opening Price Comparison
The first method is beautifully straightforward. For a bullish bias, the current opening price should be above the previous opening price. That's it. Sounds almost too simple, right? But simplicity often holds the greatest power in trading.
For Gold yesterday, we simply needed to compare the latest opening price on the Daily timeframe with the previous opening price. It's that simple.
Method 2: Mid-Level Analysis
The second approach involves comparing mid-levels between candles. We compare the mid-level of the previous candle with the mid-level of the candle before that. I know it might sound a bit complicated when explained this way, but once you visualize it on your chart, the concept becomes crystal clear.
Still on Gold, we just compare the 50% or mid-level of the previous candle with the candle two periods back from the latest candle on the daily chart.
Method 3: Expansion Expectations
The third method helps us anticipate expansion in price. Traditional complex methods require analyzing numerous factors, but this simplified approach only needs two candles before the current one. Here's how it works: we use the high and low of the candle two periods back, and the open and close (body) of the previous candle. If the previous candle's body sits within the high-low range of the two-candle-back formation, we can expect price expansion.
The beauty of this method is that we don't care whether the price is bullish or bearish - we simply expect expansion to occur. Think of it like a compressed spring: when price gets squeezed within a previous range, it often seeks to break out in either direction. We're not predicting the direction, just the likelihood of significant movement.
Still on Gold, I randomly selected all inside candles on the Daily timeframe. Remember, the purpose is only to expect expansion, not direction. If you want to use this for directional bias, make sure you apply the additional analysis required.
Remember, there are no guarantees in trading, but this method provides valuable insight into potential market expansion.
Advanced Combinations for Enhanced Analysis
Combining Methods 1 and 2 creates our most accessible approach since you only need two candles. When both the opening price and mid-point from two candles ago indicate bullish conditions, we can expect the current candle to follow an OLHC bullish pattern.
You can see the 3 examples I've provided in the image, and all of these are applicable across all timeframes, both daily and 4-hour.
Combining all three methods offers a more sophisticated analysis, particularly useful for anticipating market reversals. This involves marking the current and previous opening prices, comparing mid-levels from the last two candles, and identifying the high/low range from two to three candles back.
Now I'm adding Inside Candles from 2-3 periods back (My personal rule is maximum 3 candles before the current candle, or this analysis will lead to analysis paralysis).
The Bullish and Bearish Rules
Bullish Rule 1:
Opening price above the previous opening price
Mid-level of the previous candle above the mid-level of the previous candle before that.
Inside candle formation (optional)
Bearish Rule 1:
Opening price below the previous opening price
Mid-level of the previous candle below the mid-level of the previous candle before that.
Inside candle formation (optional)
The Secret Sauce: Timeframe Harmony
Here's where the "devil is in the details" comes into play. You might find perfect bullish conditions on your chart, but the market still reverses. The secret lies in using this method on Daily and 4-hour timeframes simultaneously.
Simply understand it from the chart.
Simply understand it from the chart.
If Rule 1 conditions are met on the daily chart, they must also align on the 4-hour chart. When the 4-hour contradicts the daily, follow the 4-hour signal as it might indicate a "sell on strength" or "buy on weakness" scenario.
The formula is simple: must align with
I've never tested this on 1-hour charts because the Daily and 4-hour combination provides sufficient accuracy for my trading approach.
Enhanced Rules for Precision
Rule 2 makes the inside candle formation mandatory rather than optional. Sometimes you'll encounter mixed signals where the mid-level suggests one direction while the opening price suggests another. The solution? Drop down to a lower timeframe for additional confirmation.
I don't recommend using this method below the 4-hour timeframe, but you can certainly apply it to Monthly or Weekly charts for long-term bias determination. The key is analyzing both Daily AND 4-hour timeframes together, not just one or the other.
When timeframes conflict, often just one key level provides the confirmation you need - typically a previous Monthly or Weekly high or low.
Final Thoughts
Pure price action mastery isn't about having the most sophisticated setup or the most indicators on your chart. It's about understanding the fundamental relationship between opening prices, mid-levels, and candle formations across meaningful timeframes.
This approach has served me well because it cuts through market noise and focuses on what price is actually telling us. Start with these three methods, practice identifying the patterns, and gradually build your confidence in reading pure price action.
Remember, consistent profitability comes from mastering simple, reliable methods rather than chasing complex strategies. Keep practicing, stay disciplined, and let price action guide your trading decisions.
Good Luck! :)