Liquidity Hunt: Crude Oil's Next TargetFenzoFx—Crude Oil remains below the $64.19 resistance level. The Stochastic Oscillator is in overbought territory, and RSI 14 signals bearish divergence, suggesting a possible price dip.
Oil could briefly surpass $64.19 to grab liquidity before facing selling pressure. In this case, a drop toward the $61.72 support level may occur to fill the bullish fair value gap.
However, if Oil stabilizes above $64.19, the bearish outlook becomes invalid.
>>> Trade Crude Oil without swap and low spread at FenzoFx
Technical Analysis

Can Tech Strength Still Drive Markets Amid Trade Tensions?Macro approach:
The Nasdaq 100 (USTEC) began Jun with strong momentum after its best monthly performance since 2023, fueled by robust tech earnings and a brief lull in tariff concerns.
- However, renewed US-China trade tensions resurfaced early in the week, briefly weighing on sentiment before a market rebound restored cautious optimism.
- Nvidia (NVDA) surged due to the continued demand for AI chips. At the same time, Tesla (TSLA) drew investor focus ahead of its 12 Jun robotaxi launch, helping maintain positive momentum in the face of geopolitical uncertainty.
Technical approach:
- USTEC is now testing the previous swing high near 218000, staying above both EMAs, a sign of ongoing bullish strength.
- A clear break above 21800 would likely open the path toward the record-high zone near 22200.
- Failure to do so may trigger a pullback toward the nearest support of around 20700.
Analysis by: Dat Tong, Senior Financial Markets Strategist at Exness

EURCAD's Triangle Hints Drop AheadThe correction looks like a contracting triangle, which is a common pattern in Elliott Wave theory. This kind of triangle usually forms during wave B or wave 4. It includes five smaller waves labeled A, B, C, D, and E, which move within two sloping lines that get closer together. There is also a demand zone marked in red on the chart.
Triangles often show a pause in the market before the price continues in the same direction as before. In this case, the triangle suggests that once wave E is complete, the price may drop again to finish wave C. The expected target area is between 1.54900 and 1.54320. This outlook remains valid as long as the price stays within the correction channel.

#NIFTY Intraday Support and Resistance Levels - 04/06/2025Nifty is opening with a gap-up near the 24700 level, placing it right at a key decision zone. If the index sustains above the 24750–24800 resistance band, it could trigger a bullish breakout with intraday upside targets of 24850, 24900, and 24950+.
However, if Nifty fails to hold this gap-up and slips back below 24700, it could quickly turn into a false breakout. A breakdown below 24700 may invite selling pressure with targets at 24650, 24600, and 24550.
Since the gap-up is near a resistance threshold, early volatility is expected. Wait for confirmation of direction with price-action and volume before taking any directional trade. Use strict stop-loss and consider partial booking around each target zone.

[INTRADAY] #BANKNIFTY PE & CE Levels(04/06/2025)Bank Nifty is expected to open with a gap-up near the 55950 level, which places it at a critical resistance zone. If it sustains above this level, it may extend the bullish momentum toward 55750, 55850, and 55950+, but more importantly, a breakout above 56050 would trigger a fresh upside rally with targets at 56250, 56350, and 56450+.
However, if Bank Nifty fails to hold above 55900–55950 and reverses below this zone, a short trade setup may activate, with potential downside targets of 55750, 55650, and 55550.
Further weakness can be confirmed only if the index slips below the 55550–55600 support zone, exposing it to 55250, 55150, and 55050 levels.

Nightly $SPY / $SPX Scenarios for June 4, 2025🔮 Nightly AMEX:SPY / SP:SPX Scenarios for June 4, 2025 🔮
🌍 Market-Moving News 🌍
🌐 Markets Rally on Chinese PMI Surprise
China’s Caixin Manufacturing PMI unexpectedly climbed to 50.8 in May, signaling expansion in smaller export-focused factories. Asian markets jumped, lifting U.S. equity futures as investors recalibrated global growth expectations .
📉 U.S. Factory Orders Remain Soft
April’s U.S. Factory Orders fell 0.4%, underscoring persistent weakness in industrial demand amid elevated input costs and trade uncertainty. Declines in durable-goods orders weighed on industrial stocks .
🏦 Fed’s Bowman to Speak on Economic Outlook
Fed Governor Michelle Bowman is scheduled to deliver remarks at 2:00 PM ET, likely emphasizing caution on future rate moves given mixed data. Markets will watch for any shifts in tone regarding inflation risks and labor-market resilience .
🛢️ Oil Prices Slip on Rising U.S. Inventories
U.S. crude inventories rose by 3.8 million barrels last week, according to API data, pressuring oil prices lower and dragging energy shares down as supply concerns outweighed strong demand signals .
📊 Key Data Releases 📊
📅 Wednesday, June 4:
2:00 PM ET – Fed Governor Michelle Bowman Speaks
Remarks on economic outlook and monetary policy, watched for any hints on the Fed’s next moves.
⚠️ Disclaimer:
This information is for educational and informational purposes only and should not be construed as financial advice. Always consult a licensed financial advisor before making investment decisions.
📌 #trading #stockmarket #economy #news #trendtao #charting #technicalanalysis

HUGE $5 to $49 today +900% vertical $MCTR told you early!HUGE 🤯 $5 to $49 today +900% vertical 🚀 shared a chart with you early before it went on a power squeeze NASDAQ:MCTR

USDJPY Potential DownsidesHey Traders, in today's trading session we are monitoring USDJPY for a selling opportunity around 143.200 zone, USDJPY is trading in a downtrend and currently is in a correction phase in which it is approaching the trend at 143.200 support and resistance area.
Trade safe, Joe.

Multi-Time Frame Analysis (MTF) — Explained SimplyWant to level up your trading decisions? Mastering Multi-Time Frame Analysis helps you see the market more clearly and align your trades with the bigger picture.
Here’s how to break it down:
🔹 What is MTF Analysis?
It’s the process of analyzing a chart using different time frames to understand market direction and behavior more clearly.
👉 Example: You spot a trade setup on the 15m chart, but you confirm trend and structure using the 1H and Daily charts.
🔹 Why Use It?
✅ Avoids tunnel vision
✅ Aligns your trades with the larger trend
✅ Confirms or filters out weak setups
✅ Helps you find strong support/resistance zones across time frames
🔹 The 3-Level MTF Framework
Use this to structure your chart analysis effectively:
Higher Time Frame (HTF) → Trend Direction & Key Levels
📅 (e.g., Daily or Weekly)
Mid Time Frame (MTF) → Structure & Confirmation
🕐 (e.g., 4H or 1H)
Lower Time Frame (LTF) → Entry Timing
⏱ (e.g., 15m or 5m)
🚀 If you’re not using MTF analysis, you might be missing critical market signals. Start implementing it into your strategy and notice the clarity it brings.
💬 Drop a comment if you want to see live trade examples using this method!

$5 to $19 or +300% vertical! Catching a safe piece of $MCTR$5 to $19 🚀 Catching a safe piece daily from the move like that is all you need to keep the job away 💯 NASDAQ:MCTR

EURUSD - Short Opportunity Ahead EURUSD is currently approaching a key resistance level after a strong upward move. Price action is showing signs of exhaustion, and bearish signals are beginning to emerge. If the pair fails to break above the resistance and confirms a rejection, we may see a short-term pullback or a potential trend reversal.
A clean break below the recent support zone could provide a short opportunity, with possible downside targets near previous lows. As always, proper risk management is essential, especially in high-volatility conditions.
---
Key Technical Points:
Price nearing a strong resistance zone
Bearish candlestick formation / divergence (if applicable)
Wait for confirmation before entering a short position
🔒 This is a trade idea for educational purposes only — not financial advice.

TRUMP Update on a Daily Timeframe.TRUMP is currently forming a symmetrical triangle pattern and is holding above the support trendline at $11. For a bullish confirmation, it needs to break above the blue box zone, which ranges between $12.5 and $15.5.
On the downside, if TRUMP breaks below the support trendline, the next key support lies at $7.3 — and it must hold strong.
Let’s see how this plays out. For now, I’ll be keeping a close eye on it and will update you with the next move.
Until then, trade safely.
Regards,
Dexter

EURUSD: Rise Ahead! 🇪🇺🇺🇸
EURUSD successfully violated a significant horizontal supply area yesterday.
The broken structure and a rising trend line compose a contracting demand zone now.
It will be the area from where I will expect a rise to higher level.
The next strong resistance is 1.151
❤️Please, support my work with like, thank you!❤️
I am part of Trade Nation's Influencer program and receive a monthly fee for using their TradingView charts in my analysis.

USDollar Is Making An Intraday Pullback Within DowntrendGood morning traders! Stocks keep pushing higher along with yields, so it looks like 10Y US Notes could still see lower support levels, and that’s why USdollar is in a bigger intraday correction. What we want to say is that while the 10Y US Notes are still searching for support, the DXY can stay in recovery mode or at least sideways. In the meantime, stocks can easily see even higher levels after NVIDIA surpassed earnings.
Looking at the intraday USDollar Index – DXY chart, we see a leading diagonal formation, so we are tracking now an intraday abc correction before a bearish continuation, thus keep an eye on GAP from May 18 around 101 level that can be filled and may act as a resistance before a bearish continuation.

Waiting for a Short-Term Pullback Before the Next Bullish Leg? NZDUSD – Waiting for a Short-Term Pullback Before the Next Bullish Leg?
As global markets await the upcoming U.S. Non-Farm Payrolls (NFP) report later this week, NZDUSD is showing early signs of short-term weakness following a strong bullish rally from the 0.5905 low. While the broader structure remains bullish, a corrective move may be necessary to shake out weak hands and reload liquidity before a renewed surge.
🌐 Macro & Fundamental Outlook:
New Zealand: Recent economic releases from New Zealand have been lackluster, yet the RBNZ's hawkish policy stance (high interest rates) continues to support the Kiwi. However, pressure from China – New Zealand’s top trading partner – remains a drag.
United States: The U.S. Dollar remains under pressure due to rising expectations that the Fed will start cutting rates by Q3 2025, despite some hawkish tones from FOMC officials. This week’s NFP report will be a decisive factor.
Market Sentiment: After a ~150-pip rally, traders are beginning to take profits. The correction could offer a golden re-entry opportunity.
📊 Technical Analysis:
Trend Bias: The market structure is still in an uptrend, maintaining Higher Highs and Higher Lows.
Fibonacci Retracement: Price is currently pulling back toward the 0.5 – 0.618 Fibo zone (0.5992 – 0.5978), aligning with the H1 89 & 200 EMAs.
EMA Structure (13 – 34 – 89 – 200): Still bullish but currently signaling a short-term pullback.
🔑 Key Price Zones:
Resistance Levels: 0.6014 – 0.6052
Support Levels: 0.5973 – 0.5951 – 0.5932
🧭 Trade Plan
📌 Buy Setup (trend continuation):
BUY ZONE: 0.5951 – 0.5932
SL: 0.5900
TP: 0.5978 → 0.6014 → 0.6052
📌 Expecting a bullish bounce off the 61.8% Fibo + EMA 200 confluence ahead of NFP.
📌 Sell Setup (short-term countertrend scalp):
SELL ZONE: 0.6014 – 0.6025
SL: 0.6060
TP: 0.5978 → 0.5951
📌 Anticipating a reaction at a key resistance zone – ideal for intraday scalpers.
⚠️ Risk Management Notes:
Stay cautious ahead of high-impact U.S. data (ADP, Jobless Claims, NFP).
Favor buying the dip in line with the higher-timeframe trend.
Maintain discipline with tight SLs (30–35 pips max per setup).

GBPUSD – Is the Recovery Losing Steam? GBPUSD – Is the Recovery Losing Steam? Watch for Technical Pullback Ahead of NFP
The GBPUSD pair has recently rebounded impressively from the 1.3427 key support zone, reflecting short-term USD weakness and growing speculation of rate cuts by the Fed. However, after the strong bullish move, the market is now showing signs of exhaustion and potential profit-taking—especially with high-impact US employment data just around the corner.
🔍 Macro & Fundamental Overview:
United States: All eyes are on this week’s JOLTS and Non-Farm Payrolls (NFP) reports. Weak jobs data could strengthen the case for rate cuts by the Fed in Q3, weighing on the US Dollar. On the flip side, a solid print would revive “higher for longer” rate expectations and likely support USD strength.
United Kingdom: Although inflation remains above the Bank of England’s 2% target, political uncertainty ahead of July’s general election may keep GBP on the defensive, especially if BoE signals a dovish turn.
Bond Yield Spread (UK vs US): A widening spread in favor of the USD is exerting downward pressure on GBPUSD in the medium term.
📈 Technical Outlook (H1 Chart):
Structure: Price has formed a double-top pattern at 1.35598 and 1.35322, with multiple rejections—signaling a weakening bullish momentum after a sustained rally.
EMA 13 – 34 – 89 – 200 Setup: Price is currently testing the EMA89 zone (~1.34854). A clean break below this moving average could accelerate the downside correction.
FVG Zone (Liquidity Pool): The 1.3427 – 1.3457 area offers a potential liquidity sweep and may serve as a springboard for the next bullish leg.
📊 Trade Scenarios:
🔻 Short-Term SELL SCALP:
Entry: 1.3532 – 1.3545
Stop Loss: 1.3565
Take Profit: 1.3485 → 1.3457 → 1.3427
→ Ideal if price fails to hold above recent highs and forms bearish rejection candles.
🔵 BUY ZONE Setup:
Entry: 1.3427 – 1.3440
Stop Loss: 1.3400
Take Profit: 1.3475 → 1.3505 → 1.3535 → 1.3555
→ High-probability entry if price reacts positively to the FVG zone and maintains bullish structure.
📌 Final Thoughts:
GBPUSD is currently in a delicate zone where both technical and macro forces are converging. While the broader trend remains bullish, momentum is slowing. With critical US jobs data due, traders should stay cautious and rely on clear confirmations around key price levels. Maintain strict risk management and look for liquidity-driven moves around FVG zones.

EURUSD – Retracement Expected Before Further UpsideEURUSD – Retracement Expected Before Further Upside
The EURUSD pair has seen strong bullish momentum over the past two days, mainly driven by the weakening U.S. dollar. Last week’s softer-than-expected U.S. Core PCE and PMI data fueled speculation that the Federal Reserve may hold rates steady for longer, weighing on USD sentiment.
However, with upcoming speeches from FOMC members and the Non-Farm Payrolls (NFP) data due later this week, traders may look to take profit or step aside, leading to a short-term retracement before any continuation of the bullish trend.
🔍 Macro & Fundamental Overview:
USD remains under pressure amid declining inflation signals and weakening economic data.
ECB is expected to cut rates, but at a slower pace than the Fed, creating a divergence that supports the Euro in the near term.
Political uncertainties in the EU, including upcoming elections, are worth monitoring.
📉 Technical Analysis:
The medium-term trend remains bullish with EMA 13–34–89–200 aligned to the upside.
Price is currently reacting at the 0.0 FIBO level (1.1420), suggesting a potential pullback.
Key support lies between 1.1345 – 1.1317. If this zone holds, it could serve as a solid base for a bullish continuation.
🧭 Suggested Trade Scenarios:
🔵 BUY ZONE: 1.1317 – 1.1345
SL: 1.1285
TP: 1.1370 → 1.1400 → 1.1420 → 1.1450+
🔻 SELL ZONE (Short-term counter-trade): 1.1418 – 1.1425
SL: 1.1450
TP: 1.1385 → 1.1350 → 1.1320

Full trade plan with exact prices laid out ahead of time!After shortsellers forcefully pushed NASDAQ:MODV down from mid $2's I said this will most likely result into powerful squeeze.
I said buy at the dip $2.31 exactly, waited to get filled, double dip to $2.31 happened to get a full position and from there straight up to mid $3's, took profits in 2 parts and sent out messages live as it was happening so everyone that followed along knew what to do.
Solid +30% gain in minutes, taking safest piece of the 200% move the stock made before focus shifted elsewhere.
That's how it's done, in and out at highly predictable levels, then moving on to the next stock because NASDAQ:NIVF NASDAQ:EYEN NASDAQ:REVB are already up and hot this morning, not marrying it and holding & hoping forever.

JPYUSD Technical Breakdown | Inverse Head & Shoulders + Target🔍 Pattern Breakdown: Inverse Head & Shoulders (H&S)
We’ve identified a textbook Inverse Head & Shoulders pattern, a classic bullish reversal formation that often appears at the end of a downtrend. Here's how the structure played out:
Left Shoulder:
The initial drop formed a local low, followed by a short recovery, creating the first "shoulder" on the left.
Head:
A deeper push down formed the lowest point of the pattern, indicating a possible trap for sellers or exhaustion in bearish momentum. This is the "head" and the key anchor of the pattern.
Right Shoulder:
A higher low forms, showing buyers stepping in earlier and with more strength. This symmetry confirms the structure and signals a potential reversal in trend.
Neckline:
Drawn across the highs between the shoulders, this key resistance line was broken decisively, confirming the bullish pattern and triggering an upward breakout.
📌 Trendline + Retest Zone = Confluence Support
After the breakout above the neckline:
Price surged strongly, showing confidence in the reversal.
It pulled back gently to retest the neckline, which now acts as support.
This retest also aligns with the upward trendline, adding confluence — a strong signal in technical trading that increases the probability of a successful continuation move.
This zone is labeled on the chart as:
🟦 “Like a Retesting Zone After Boom” — a perfect description of what’s occurring.
🎯 Target and Resistance Zones
The price is now moving toward a major resistance zone marked between 0.007020 – 0.007060, with a target zone slightly above at 0.007080.
These zones represent historical selling pressure or supply areas. A breakout above this region would open doors to even higher levels, signaling strong bullish continuation.
📈 Why This Setup Matters (MMC Strategy Applied)
Using the Market Mapping Concept (MMC) approach, this trade idea combines:
Market structure (Inverse H&S pattern)
Momentum confirmation (strong bullish move after breakout)
Zone mapping (support/resistance confluence)
Trendline validation (clean structure with pullback respect)
This creates a well-defined trade setup with clear entry and exit logic, excellent risk-to-reward potential, and technical confirmation.
✅ Summary: Bullish Outlook With Managed Risk
Bias: Bullish continuation as long as price holds above the neckline/trendline zone.
Confirmation: Inverse H&S pattern + successful retest.
Target: 0.007060–0.007080 resistance zone.
Invalidation: Break below 0.006980 and close under trendline support.
💬 Minds Post Caption (Extended)
🔥 JPYUSD Ready to Fly? Inverse Head & Shoulders Breakout Spotted!
Clean reversal pattern (H&S) just completed with a strong neckline breakout and a perfect retest at trendline confluence. MMC analysis suggests bullish continuation toward the 0.007060+ resistance zone. Classic "retest after boom" move. Watching price action closely! 🚀📊

XAGUSD Analysis – Market Mapping Concept (MMC) + Target🧭 Overview:
Today's Silver price action presents a textbook example of how MMC can guide traders through:
Identifying the smart money accumulation phase.
Anticipating breakout momentum .
Locating key reversal areas based on previous liquidity maps and structural shifts.
We are currently observing Silver in the early stages of a structural retest after a breakout from consolidation. This gives rise to two powerful scenarios: either a bullish continuation after structure confirmation or a deeper retracement if the structure fails.
🔍 Detailed Chart Explanation:
🔷 1. Volume Contraction Phase
The market spent multiple sessions forming a symmetrical wedge, visible by narrowing price movement and consistent lower highs and higher lows.
This was accompanied by declining volume, signaling accumulation/distribution by institutional players.
The wedge served as a liquidity trap, drawing in both early shorts and longs before the true direction was revealed.
✅ MMC Principle: Volume contraction often precedes major breakouts as market makers build positions quietly.
🔷 2. SR Interchange – Breakout Confirmation
Price finally broke above the upper trendline, triggering a bullish impulse and confirming SR interchange (resistance turned support).
This move was backed by a strong bullish candle, showing aggressive participation and institutional involvement.
📌 This breakout candle set the tone for a structural shift—transforming from sideways to upward momentum.
🔷 3. Rapid Expansion Toward Previous Target Zone
After the breakout, price accelerated directly into a previous high (target) zone marked in blue.
According to MMC, this zone often acts as a liquidity magnet, where late buyers enter and professional traders take profits.
A rejection wick formed right after touching this zone—classic smart money behavior, catching retail traders chasing the move.
✅ MMC Principle: Prior highs/lows are not just resistance—they're engineered targets for liquidity collection.
🔷 4. Target + Reversal Area
After the rejection, price declined back into the Target + Reversal Zone. This area aligns with MMC’s ideal structure for potential buy-side re-accumulation.
This zone is where previous volume imbalances occurred, meaning it is likely to act as support if the bullish trend is to continue.
📊 Current price is consolidating within this zone, suggesting a possible bullish continuation if structure holds.
🔷 5. Structure Mapping – The Key to MMC
The most recent price reaction highlights the importance of structure mapping: identifying areas where market logic aligns with trader behavior.
The bearish pullback into the structure zone may complete a retest, and traders are watching closely for bullish confirmation.
⚙️ Technical Summary:
Key Zone Description
Volume Contraction Signals accumulation before breakout.
SR Interchange Breakout level where resistance turned to support.
Previous Target Zone Liquidity pool, ideal for institutional exits or reversal.
Target + Reversal Zone Demand zone where the trend may resume if confirmed.
Structure Mapping Current phase; price is aligning into new bullish structure or preparing for drop.
🧭 What to Watch Next:
🔹 Scenario A – Bullish Case:
Price holds within the Target + Reversal Zone.
Confirmation via bullish engulfing candle or breakout of lower high.
Target: retest of 34.80+, then potential extension to 35.20.
🔹 Scenario B – Bearish Case:
Breakdown below structure base at 33.85–34.00.
Could lead to a deeper correction toward 33.40 or 32.80 (previous volume node).
📌 Volume + Structure = Decision Point. Next few candles are crucial for validating direction.
🛠 Strategy & Execution:
Approach: Wait for confirmation candles before entering. Avoid reacting impulsively within the structure zone.
Entry Idea:
Buy on bullish confirmation in the reversal zone.
Place stop below structure invalidation.
Target the top of the previous target zone or higher.
Risk Management: Use tight SLs below 33.85 and scale in only on confirmation.
📅 Timeframe: 1H
🔭 Sentiment: Cautiously Bullish
🎯 Technique: MMC Structure Mapping + Volume-Based Targeting
🧠 Final Thoughts:
This XAGUSD chart showcases the predictive power of MMC when applied correctly. By understanding where smart money operates, traders can improve accuracy, timing, and risk control.
📌 If you found this analysis helpful, like and follow for daily insights. Drop your thoughts in the comments—do you trade MMC-style setups?

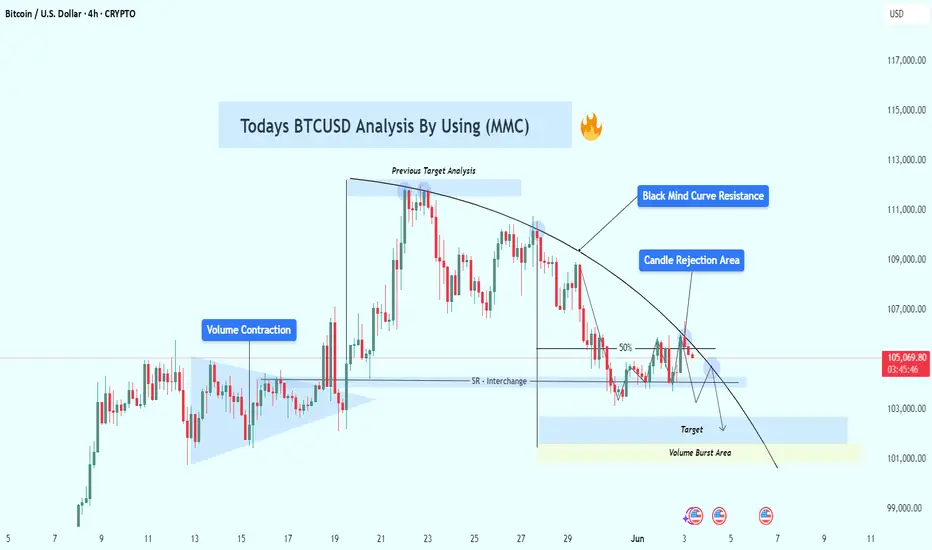
BTCUSD Analysis Using MMC – Bearish Rejection & Target🔷 Introduction:
Bitcoin is showing classic Market Maker manipulation at work—volume compression, false breakouts, support-resistance flips, and a fading rally under a well-defined descending curve.
This post offers a deep dive into the true intentions of smart money behind recent price actions, helping traders avoid traps and align with institutional moves.
🔎 Detailed Breakdown of Chart Structure:
🧱 1. Volume Contraction Zone – The Calm Before the Storm
📅 Period: May 13–18
Price consolidates within a symmetrical triangle pattern.
Volume steadily decreases as price tightens – a sign that market makers are accumulating positions while keeping volatility low.
This low-volume phase creates uncertainty for retail traders, shaking out weak hands and building a base for a deceptive breakout.
🔍 MMC Insight: Market Makers reduce volatility to absorb liquidity without alerting the market to their accumulation. This builds energy for a manipulated move.
📌 2. False Breakout to Previous Target Zone (~$110,000)
📅 May 20–23
A sudden bullish impulse takes price to the previous target zone, marked as a key area of historical liquidity.
Retail traders enter late long positions at this stage, anticipating further breakout.
🎯 But instead:
Price swiftly rejects from this level, forming long upper wicks and bearish engulfing candles.
This move is a liquidity sweep, where smart money offloads positions to late buyers.
🔍 MMC Insight: Institutions engineer a breakout to bait traders, only to dump into the momentum they create.
🔁 3. SR Interchange (Support Flips to Resistance)
📅 May 27–June 2
Former support around $104,000 – $105,000 is broken and then retested from below.
Price attempts to reclaim it, but fails—each touch results in rejection.
This confirms the area has flipped to resistance, aligning with MMC’s SR Interchange Rule.
📉 Significance: This zone now acts as a control point where market makers defend short positions.
🚫 4. Candle Rejection Area – Curved Trendline Resistance
A visually defined curved resistance line caps each rally, suggesting consistent seller presence.
Recent candles show clear rejection wicks and small-bodied candles at this level—classic distribution behavior.
Market is compressing under this trendline, hinting at an imminent breakdown.
🔍 MMC Insight: Curved trendlines show passive sell pressure where institutions repeatedly cap price in preparation for a drive lower.
📉 5. Next Target & Volume Burst Area: $101,000 – $102,000
This zone is crucial due to:
Presence of imbalance (inefficiency) left from previous bullish moves.
Likely stop loss clusters from retail long traders.
Historical high-volume node suggesting pending revisit for order rebalancing.
🟨 Yellow Zone = Volume Burst Area: Expected to act as a magnet for price due to liquidity concentration.
🧠 Psychology of the Trap:
📈 Retail Bias: “Bullish triangle breakout means more upside.”
🧠 Institutional Plan: “Use that belief to create exit liquidity, then reverse.”
This is textbook MMC manipulation:
Contract volume to build positions.
Break out to bait liquidity.
Reverse at supply.
Sell into rejection zones.
Trap traders at SR flips.
Drive price to reclaim liquidity at lower targets.
📊 Strategy Plan:
🔻 Bearish Bias Setup:
Entry Zone: $105,200 – $106,000 (candle rejection area)
SL: Above $106,800 (above supply curve)
TP1: $103,000
TP2: $101,000
TP3 (optional): $99,000 for deeper flush
🔁 Flip Bullish if:
Price reclaims $107,000 with momentum and closes above the curve.
Watch for volume confirmation and bullish SMC patterns (e.g., BOS + FVG fill).
⚠️ Risk Management & Notes:
Trade with 1–2% max risk per position.
Let confirmations play out (don't preempt rejection).
Watch U.S. data releases this week (highlighted on chart) – potential volatility triggers.
📌 Conclusion:
Bitcoin’s current behavior is a masterclass in market structure manipulation. Understanding MMC lets us:
Avoid false breakouts
Align with institutional intentions
Trade with probability, not emotion
Expect lower prices unless $106,800 is cleanly broken. The path of least resistance currently points downward toward liquidity zones.
WAVE 3 PEAK OR SETUP FOR A NEW RALLY? XAUUSD PLAN – JUNE 3RD | WAVE 3 PEAK OR SETUP FOR A NEW RALLY?
After a massive $100 rally at the start of the week, gold has begun to pull back — dropping over $30 during the Asia session today. This is likely the end of Wave 3 (the strongest impulse in a 5-wave Elliott structure), as investors lock in profits and await key macro events.
🌍 MACRO & FUNDAMENTAL CONTEXT
A high-stakes call between Trump and Xi Jinping is expected this week, which could reshape short-term trade sentiment.
Investors are moving into cash positions, taking profits after Monday’s surge, and waiting for direction from the upcoming US-China negotiations.
Macro themes remain supportive for volatility: tariff risks, inflation worries, and geopolitical uncertainty.
📉 TECHNICAL OUTLOOK – H2 / H4 / D1
On the higher timeframes (H4 and D1), gold maintains a bullish structure, with EMAs aligned for upside continuation.
On intraday charts (M30–H1), we’re seeing a clean correction, likely to fill the Fair Value Gap (FVG) zone below.
The key BUY zone at 3320–3310 will decide direction:
If it holds: strong long setups.
If it breaks: possible structure shift and deeper downside.
🔑 KEY LEVELS TO WATCH
🟢 BUY ZONE: 3320 – 3318
SL: 3314
TP: 3324 → 3328 → 3332 → 3336 → 3340 → 3344 → 3350 → 3360 → ???
🔴 SELL ZONE: 3388 – 3390
SL: 3394
TP: 3384 → 3380 → 3376 → 3370 → 3366 → 3360 → 3350
📌 FINAL THOUGHTS
“Gold is in a healthy correction after a massive surge. The 3310–3320 zone is crucial. Hold it, and bulls may take over again — break it, and we may see a deeper pullback."
⚠️ Stay cautious ahead of political headlines. Any remarks from the Trump–Xi call could spark aggressive price action.

ECB Signals More Action as Eurozone Outlook WaversECB Signals More Action as Eurozone Outlook Wavers
EUR/USD rebounded to near 1.1370 in Monday’s Asian session as the US Dollar weakened after legal shifts in tariff rulings. On Thursday, the US Court of Appeals backed Trump’s tariff policy, overturning Wednesday’s lower court decision that had declared his April 2 executive orders unlawful.
Trade tensions escalated as Trump announced plans to double tariffs on steel and aluminum imports to 50%. In response, the European Commission warned it would retaliate, despite both sides agreeing to accelerate talks after extending the EU tariff deadline to July 9.
Meanwhile, Eurozone economic concerns persist. ECB’s Klaas Knot cited inflation uncertainty, while François Villeroy de Galhau said policy normalization is likely not finished, suggesting more action ahead.
The key resistance is located at 1.1460 and the first support stands at 1.1300.
