USD/CHF Bearish Rejection Setup – Short Opportunity1. Market Context & Structure
The USD/CHF currency pair is currently exhibiting a bearish market structure on the 1-hour chart. After a sharp decline from the 0.8360+ level, the price has attempted to recover but remains in a corrective phase. This recovery appears to be forming lower highs and is approaching a key resistance zone. The overall structure shows a series of sharp drops followed by weaker upward retracements, a classic sign of sellers still being in control. The current rise toward the 0.8300–0.8310 level is likely a corrective move, not a reversal, and could act as an ideal zone for a fresh bearish entry.
2. Key Technical Zones
Three key price zones define this setup. The first is the resistance zone between 0.8300 and 0.8310, marked with a red box. This area has previously acted as a strong supply zone where price faced heavy selling pressure, and it is likely to be respected again. The second important area is the intermediate support between 0.8210 and 0.8225, which could serve as a partial target for profit booking or re-entry on bounce. Finally, the major demand zone lies around 0.8160 to 0.8175, a level where price previously paused before resuming upward correction. These zones collectively provide logical stop loss and target levels for managing the trade with discipline.
3. Trading Plan (Sell Setup)
The trade idea here is to initiate a short position as the price enters the 0.8300–0.8310 resistance zone. This level aligns with the previous high and the edge of a well-defined supply area. A stop loss should be placed slightly above the resistance zone—around 0.8330—to avoid getting stopped out by minor spikes or false breakouts. For targets, the first take-profit can be at 0.8225, near the intermediate support zone. If bearish momentum continues, the next logical target is at 0.8175, which aligns with previous price rejections. This plan offers a clean setup with a favorable risk-to-reward ratio of at least 1:2 or higher, depending on the exact entry and target levels.
4. Confluences Supporting the Trade
Several technical factors strengthen the case for a short position at the identified level. First, the price is moving within a downtrend, confirmed by the lower highs and lower lows. The approach toward the resistance zone appears to be a corrective wave, not a breakout. Second, the chart shows a potential M-pattern formation, where the second peak aligns closely with the previous one, indicating a likely double-top scenario. Moreover, price previously reversed sharply from this resistance zone, and similar rejection candles could appear again. This confluence of trend, price action patterns, and zone-based analysis strongly supports the bearish outlook.
5. Expected Move
Based on the current structure, once price reaches the resistance at 0.8300–0.8310, a rejection is expected. This could lead to a pullback first to the 0.8225 support area. If this level is broken with momentum, a continued decline toward the 0.8175–0.8160 zone is highly probable. This move aligns with the overall bearish trend and would complete the projected wave structure shown in the chart. Traders should watch for signs of reversal (bearish engulfing, rejection wicks) at resistance to confirm entry.
6. Trade Management
Proper trade management is key to success with this setup. Once the position is live, it's recommended to book partial profits around the 0.8225 level to secure gains. The stop loss can then be moved to breakeven or entry price to make the trade risk-free. If price bounces from this level, re-entry opportunities can be evaluated with tighter stop-losses. If the move continues beyond 0.8225, the position should be held toward the 0.8175 target with trailing stop-loss adjustments. Also, traders should be cautious around high-impact USD or CHF news events, which can cause volatility and invalidate technical levels.
===================================================================
Disclosure: I am part of Trade Nation's Influencer program and receive a monthly fee for using their TradingView charts in my analysis.
Technical Analysis

#NIFTY Intraday Support and Resistance Levels - 28/05/2025Today, Nifty is expected to open flat near the 24800–24850 zone. If it sustains above 24800–24750, a bullish move is possible toward 24850, 24900, and 24950+.
Further momentum may be seen if Nifty breaks and holds above 25000, targeting 25150, 25200, and 25250+.
On the downside, if Nifty fails to hold above 24950–24900 and starts slipping below this zone, short trades can be considered with targets of 24850, 24800, and 24750.
A breakdown below 24700 may accelerate selling pressure, leading to extended downside targets of 24650, 24600, and 24550.
Expect choppy moves near key levels — trade with a defined stop loss and lock in profits at each stage.

Nightly $SPY / $SPX Scenarios for May 28, 2025🔮 Nightly AMEX:SPY / SP:SPX Scenarios for May 28, 2025 🔮
🌍 Market-Moving News 🌍
🏭 Trump’s Tax Bill Threatens Clean-Energy Boom President Trump’s proposed budget aims to accelerate the expiry of key clean-energy tax credits, jeopardizing over $321 billion in investments and forcing manufacturers to pause expansion—risking a slowdown in solar and wind growth.
🛢️ Oil Flat as OPEC+ Output Hike Looms Brent and WTI held steady amid expectations that OPEC+ will announce a 411K bpd production increase for July at today’s ministerial meeting—balancing tighter U.S. supply and easing trade-tension pressures.
💻 Nvidia Earnings Eye Export-Curbs Impact Ahead of Q1 results, analysts warn U.S. chip-export restrictions to China could shave $5.5 billion from Nvidia’s ( NASDAQ:NVDA ) sales this quarter, testing AI-led growth optimism.
📈 Wall Street Climbs on Tariff Reprieve U.S. futures jumped after Trump delayed planned EU tariffs until July 9, lifting risk appetite across megacaps—Nvidia led gains with a 2.7% pre-market rise.
📊 Key Data Releases 📊
📅 Wednesday, May 28:
9:00 AM ET: Case-Shiller Home Price Index Measures month-over-month changes in home values across 20 major U.S. cities—a key gauge of housing-market trends.
10:00 AM ET: Consumer Confidence Index Tracks consumer sentiment on current business and labor-market conditions and expectations for the next six months.
2:00 PM ET: FOMC Minutes (May 6–7 Meeting) Detailed readout of policymakers’ economic outlook and voting rationale—critically watched for hints on future rate policy.
⚠️ Disclaimer: This information is for educational and informational purposes only and should not be construed as financial advice. Always consult a licensed financial advisor before making investment decisions.
📌 #trading #stockmarket #economy #news #trendtao #charting #technicalanalysis

PEPE/USDT Potential UpsidesHey Traders, in today's trading session we are monitoring PEPE/USDT for a buying opportunity around 0.00001360 zone, PEPE/USDT is trading in an uptrend and currently is in a correction phase in which it is approaching the trend at 0.00001360 support and resistance area.
Trade safe, Joe.

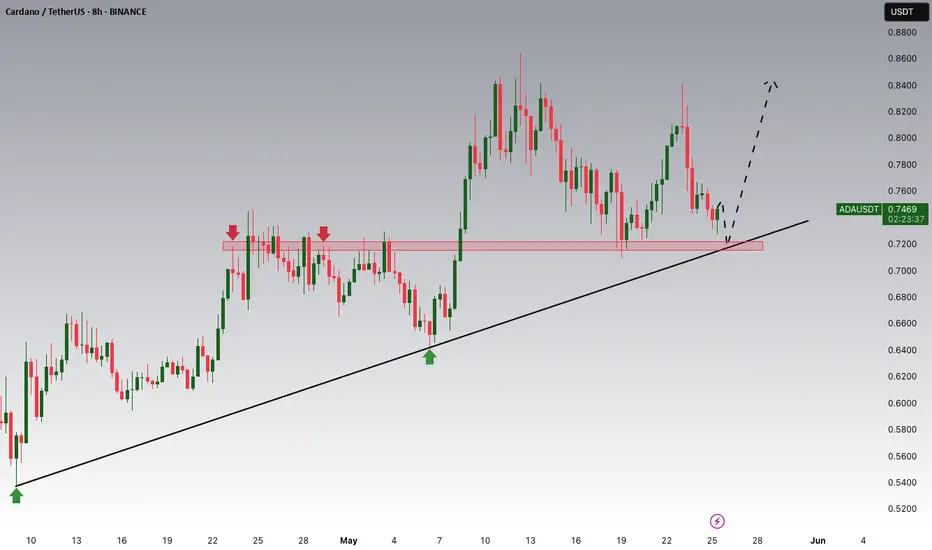
Cardano Potential UpsidesHey Traders, in today's trading session we are monitoring ADA/USDT for a buying opportunity around 0.7200 zone, Cardano is trading in an uptrend and currently is in a correction phase in which it is approaching the trend at 0.72000 support and resistance area.
Trade safe, Joe.
Ethereum Is Nearing an Important SupportHey Traders, in today's trading session we are monitoring ETH/USDT for a buying opportunity around 2,435 zone, Ethereum is trading in an uptrend and currently is in a correction phase in which it is approaching the trend at 2,435 support and resistance area.
Trade safe, Joe.

OSCR 1W — When the Chart Speaks Before the FundamentalsThe Oscar Health chart is currently forming a textbook cup and handle — a long-term reversal structure that has completed its base and is now breaking out of the consolidation zone. The bullish structure is confirmed through price action, volume, and positioning relative to key moving averages.
The price has broken through the upper boundary of the handle, shaped as a descending wedge. The breakout is accompanied by increased volume — a clear sign of capital rotation out of accumulation. All major moving averages (EMA, MA50, MA200, WMA) are trending upward, and the price is holding above them all, confirming the bullish momentum.
According to Fibonacci extension levels, drawn from the historical low of $1.50 to the peak near $23.26, the first wave target stands at $36.71 (1.618 level), with an extended target at $45.02 (2.0 level).
Structurally, the setup suggests a medium-term scenario pointing from current levels toward the $36–45 range, with the potential to repeat the kind of explosive move seen during the 2023 phase, when the price increased more than sixfold.
On the fundamental side, Oscar Health is actively recovering: in 2024, revenue grew by more than 50%, net losses were cut nearly in half, and the client base continued to expand. The company is strengthening its share in the digital insurance market and gaining support from institutional investors, including Morgan Stanley and Capital Group. The latest quarterly report was positively received.
The breakout is technically clean and fundamentally supported. The immediate pullback zones sit at $14.95 and $13.40. Below that, moving averages may act as control zones for reaction.

XAU/USD Bounces Off Strong Support Zone – Bullish MomentumGold (XAU/USD) has shown a strong bounce from the clearly defined support zone around the 3280–3290 level on the 1-hour timeframe. This zone has held multiple times in the past, confirming its significance. Additionally, the 200 EMA (red) is aligned with this horizontal support, creating a strong confluence area. Price action has respected this level, forming a bullish reversal candle setup, indicating potential for upside movement.
Based on this structure, a long (buy) trade can be considered around the 3300–3305 range, ideally after a bullish confirmation candle or price holding above the EMAs. This entry provides an opportunity to ride the next wave upward while maintaining a favorable risk-to-reward ratio.
The stop loss for this trade should be placed just below the support zone—around 3275 USD. Placing the stop slightly below this area protects against fakeouts while still maintaining good risk control. This is a logical level where the setup would be invalidated if breached.
For targets, the first potential resistance and partial profit booking zone is near 3335–3340 USD. This zone acted as resistance during previous price swings. If momentum sustains, the second target zone is around 3360–3370 USD, which marks a previous swing high and a likely destination for bullish continuation. For extended upside potential, traders can aim for 3385+ USD, especially if the price action is supported by volume and broader market sentiment.
This setup offers a clean technical play with a risk-reward ratio of approximately 1:2.5 or higher. Traders can also trail their stop-loss once the price crosses above the first target to protect gains while riding further upside.
=================================================================
Disclosure: I am part of Trade Nation's Influencer program and receive a monthly fee for using their TradingView charts in my analysis.

WTI Crude Oil Testing Make-or-Break Support ZoneWTI crude is grinding into a pivotal horizontal support near 6,020 after another sharp rejection near the 50-day SMA:
Support at Risk: Price is pressing into the horizontal support zone formed by May’s lows (~6,020). A clean break below would shift momentum back decisively to the downside.
Bearish Structure: Price remains well below both the 50- and 200-day SMAs, which are angled downward—consistent with a medium-term downtrend.
Momentum Fading: MACD is negative and turning lower again, while RSI is stuck near 45 and showing no bullish divergence.
Next Support: If support fails, next downside level is likely around the YTD low near 5,400.
As it stands, bears remain in control unless bulls can defend this floor and drive a breakout back above the 50-day SMA.
-MW

USD/CAD Defends Support but Bears Still LurkingUSD/CAD is clinging to key horizontal support around 1.3780 after a recent sharp decline:
Support Retest: Price briefly dipped below the 1.3780 area before buyers stepped in, forming a potential short-term base.
Downtrend Intact: Price remains well below both the 50- and 200-day SMAs, which are beginning to fan out—an increasingly bearish configuration.
Momentum Weak: MACD is negative and RSI is hovering just above oversold territory (~38), suggesting continued bearish pressure despite the bounce.
Critical Levels: A break below 1.3780 could open the door to 1.3420 (October support), while upside recovery would need a move above the 200-day (~1.40) to shift the broader tone.
The bounce may offer a short-term reprieve, but unless bulls reclaim trend-defining moving averages, the bears remain in control.
-MW

Bitcoin Clears Key Resistance as Bulls Maintain Grip on UptrendBitcoin (BTC/USD) has officially broken above the psychologically and technically significant 108,500 zone, confirming bullish continuation:
Trendline Support Holds: The rising trendline from March remains intact and continues to guide the advance.
Breakout Confirmation: Price is now comfortably above previous resistance at 108,500, turning it into new support.
Momentum Strong: MACD remains firmly in bullish territory, while RSI is pushing into overbought levels—suggesting strong upside but warranting caution.
Next Resistance: Little stands in the way until 115,000 and potentially 120,000 if momentum persists.
Watch for Retest: Short-term consolidation or a retest of the 108,500 zone could provide a healthier base for further gains.
Bitcoin remains in bulls' control unless we see a decisive drop back below trendline support.
-MW

Bitcoin Hits New All-Time Highs — Rally Targets $130K+Bullish Momentum Accelerates:
Bitcoin has reached new all-time highs, confirming a strongly bullish technical outlook. Accelerating upside momentum and growing investor confidence are driving the current rally.
Breakout Confirmation:
A decisive breakout from a broadening wedge pattern has unlocked potential targets in the $130,000–$135,000 range, signaling a likely continuation of the uptrend.
Key Support Levels:
With Bitcoin now trading well above $106,000, the previous resistance at $108,000 is expected to act as strong support during any pullbacks — providing a clear risk threshold for traders.
Favorable Risk-Reward Setup:
This alignment of:
Strong momentum
Completed consolidation
Successful breakout
...creates a compelling risk-reward scenario and reinforces the case for continued upside in the current bull cycle.
Bitcoin may just be getting started on its next leg higher. 🚀🔥
#Bitcoin #BTC #AllTimeHigh #Crypto #TechnicalAnalysis #Bullish #Breakout #MarketMomentum #CryptoTrading #CryptoMarket

ETH ANALYSIS🔴 #ETH Analysis : ❓❓
🔮There is a formation of "Bullish Pennant Pattern" in #ETH in 4HR time frame. We can expect around $2800 bullish move if the price break the pattern.📈
⚡️What to do ?
👀Keep an eye on #ETH price action. We can trade according to the chart and make some profits. ⚡️⚡️
#ETH #Cryptocurrency #Breakout #DYOR

USDCAD: Strong Bearish Confirmation ?! 🇺🇸🇨🇦
I see an important sign of strength of the sellers on USDCAD
on an hourly time frame after a release of the today's US fundamentals.
The price violated a support line of a horizontal range and is retesting
that at the moment.
I believe that the price may drop at least to1.374 level soon.
❤️Please, support my work with like, thank you!❤️
I am part of Trade Nation's Influencer program and receive a monthly fee for using their TradingView charts in my analysis.

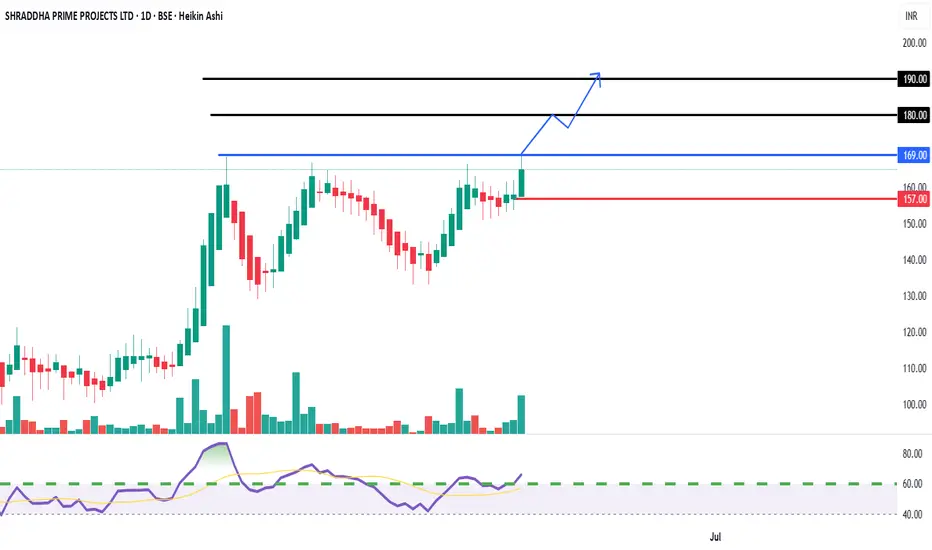
On the Cusp of a Breakout - Short-Term Buy OpportunityEntry Price:
Aggressive Entry: Around CMP (₹165.00) with a strict stop loss, anticipating the breakout.
Conservative Entry: On a confirmed breakout and close above ₹170 on a daily basis.
Target Price 1 (T1): ₹180
Target Price 2 (T2): ₹190
Stop Loss (SL): ₹157 (Closing basis below immediate support)
DISCLAIMER
This report is prepared for informational purposes only and is not intended as a solicitation or an offer to buy or sell any securities. The information contained herein is based on technical analysis and publicly available data, which are believed to be reliable, but no guarantee is made as to their accuracy or completeness. Investing in equities involves risks, and investors should conduct their own due diligence and consult with a financial advisor before making any investment decisions. Past performance is not indicative of future results.
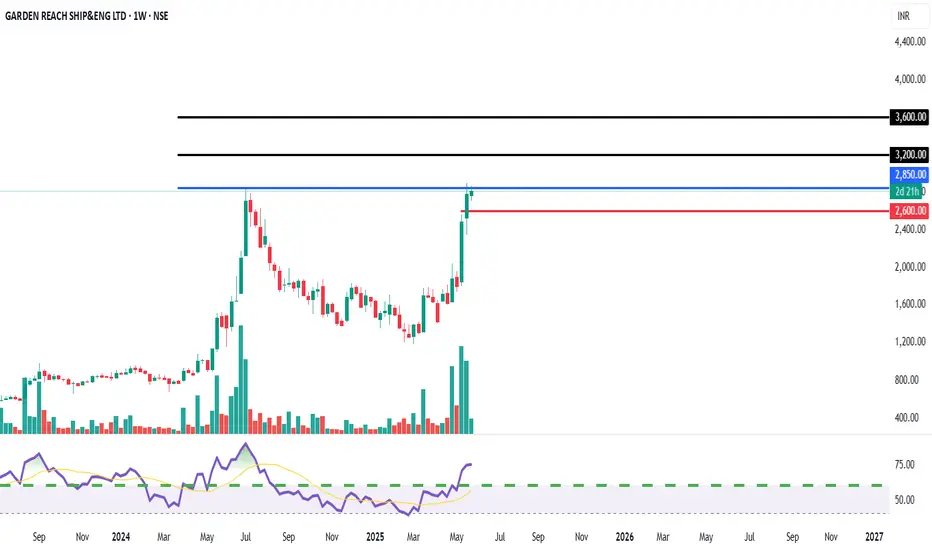
GARDEN REACH SHIPBUILDERS: Breakout Potential - Watch for EntryEntry Price:
Aggressive / Risk-Takers: Await a clear weekly close above ₹2,850, with sustained high volumes. Entry around ₹2,850-₹2,900.
Target Price 1 (T1): ₹3,200 (Based on previous highs and extension)
Target Price 2 (T2): ₹3,600 (Based on Fibonacci extensions and chart patterns)
Stop Loss (SL): ₹2,600 (Closing basis below immediate support, previous resistance)
DISCLAIMER
This report is prepared for informational purposes only and is not intended as a solicitation or an offer to buy or sell any securities. The information contained herein is based on technical analysis and publicly available data, which are believed to be reliable, but no guarantee is made as to their accuracy or completeness. Investing in equities involves risks, and investors should conduct their own due diligence and consult with a financial advisor before making any investment decisions. Past performance is not indicative of future results.
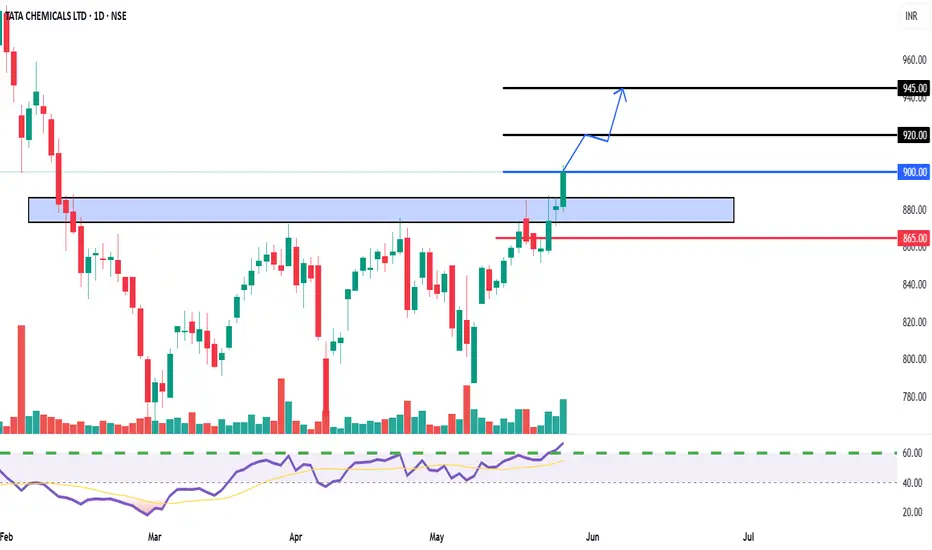
TATA CHEMICALS Breakout Confirmed - Buy on MomentumEntry Price:
Aggressive Entry: Around CMP (₹900-₹905)
Conservative Entry: On a retest of the breakout zone (₹875-₹885), if the opportunity arises.
Target Price 1 (T1): ₹920
Target Price 2 (T2): ₹945
Stop Loss (SL): ₹865 (Closing basis below the breakout zone and previous support)
Double Top Alert: Key Resistance at 1.3570 Before US PCE DataGBPUSD PLAN – MAY 27 | Double Top Alert: Key Resistance at 1.3570 Before US PCE Data
GBPUSD is currently testing a critical resistance zone near 1.3570, forming a potential Double Top pattern. As markets await this week’s US Core PCE inflation release, the pair may be at risk of a short-term pullback.
🌍 MACRO FUNDAMENTALS
USD Rebounds Slightly ahead of April’s PCE inflation report – a key Fed inflation gauge due this Friday.
GBP Under Pressure as dovish tones from Bank of England (BoE) officials signal a potential pause in rate hikes.
UK Political Uncertainty and sluggish EU-UK trade talks continue to dampen investor confidence in the pound.
📊 TECHNICAL ANALYSIS
Price Structure: GBPUSD surged from 1.3446 support but is now facing resistance near 1.3570, where a Double Top formation is emerging.
Key Levels:
Resistance: 1.3570 – 1.3580 (previous high and psychological barrier)
Support 1: 1.3496 (confluence of EMA89 and 38.2% Fibonacci retracement)
Support 2: 1.3446
Indicators:
EMA13, EMA34 show early signs of bearish crossover on the 30-minute chart.
RSI approaches overbought territory, hinting at potential bearish divergence.
🎯 TRADE SETUP (IF PRICE REJECTS 1.3570)
🔻 SELL SETUP
Entry: 1.3570 – 1.3550
Stop-Loss: 1.3595
Take-Profit Targets:
TP1: 1.3496
TP2: 1.3446
📌 A bullish breakout only becomes valid if price closes strongly above 1.3590 on the H1 chart.
🧠 STRATEGIC NOTES
Wait for a clear reaction or bearish confirmation near 1.3570 before entering trades.
Avoid chasing trades mid-range; focus on clean breakouts or rejections.
PCE data may trigger volatility — manage risk tightly and prepare for directional momentum.
👉 What do you think of this Double Top scenario? Will GBPUSD reject or break through resistance? Drop your analysis below and follow for daily structured plans!

Ripple Potential UpsidesHey Traders, in today's trading session we are monitoring XRP/USDT for a buying opportunity around 2.23 zone, Ripple is trading in an uptrend and currently is in a correction phase in which it is approaching the trend at 2.23 support and resistance area.
Trade safe, Joe.

RBNZ rate decision coming upKeep your eyes on the rate cut tomorrow by the RBNZ and on the NZD reaction to all of it. We have an interesting technical set up building on FX_IDC:NZDUSD . Let's dig in...
MARKETSCOM:NZDUSD
Let us know what you think in the comments below.
Thank you.
77.3% of retail investor accounts lose money when trading CFDs with this provider. You should consider whether you understand how CFDs work and whether you can afford to take the high risk of losing your money. Past performance is not necessarily indicative of future results. The value of investments may fall as well as rise and the investor may not get back the amount initially invested. This content is not intended for nor applicable to residents of the UK. Cryptocurrency CFDs and spread bets are restricted in the UK for all retail clients.

JPY/USD – Clean Rejection from Mini Resistance | Bearish Move🔻 1. Major & Mini Resistance Zones
Mini Resistance Zone: This is a key supply area that aligns with previous highs and recent structure points. As the price approaches this level, it tends to react due to unfilled sell orders and trapped buyers.
The chart shows a rejection from this mini resistance zone — visible through strong bearish candles. This suggests institutional selling pressure has entered the market.
Major Resistance is still untouched above, which becomes a clear invalidation level for any short bias. If price breaks and sustains above it, the bearish idea would be invalidated.
🔄 2. MMC (Mirror Market Concepts) at Work
The MMC idea is clearly illustrated. The price movement after the last major drop is mirrored on the right side:
Strong rally > Formation of lower highs > Resistance retest > Sharp decline
These mirrored behaviors often hint at psychological repetition in the market, driven by trader memory and order placement.
The bearish movement after retesting the mini resistance looks nearly identical to the previous leg on the left — reinforcing the idea that we may see a similar downside structure repeat.
🌀 3. Central Zone Area – Liquidity Trap and Reaction Point
The Central Zone Area is labeled where a previous sharp bounce occurred. This zone is critical for several reasons:
It acted as support multiple times.
It’s also where a liquidity grab occurred — shown with a long wick — before a reversal rally.
In current price action, this zone may again act as a magnet for price, as institutions seek liquidity to fuel further moves. Once price reaches it, expect a temporary bounce or reaction.
📐 4. 50% Fibonacci Retracement Confluence
The projected target sits right on the 50% retracement level of the previous bullish leg.
Institutions frequently target the 50%–61.8% Fibonacci zones to rebalance orders and create continuation moves.
This target zone is marked in purple and is aligned with historical support, adding confluence.
📉 5. Sharp Bearish Reversal from Structure
You can observe a very clear shift in momentum:
The uptrend was broken with a strong bearish engulfing candle.
That move wiped out several minor bullish structures — a sign of structure collapse.
This breakdown, combined with the resistance rejection and MMC mirroring, strongly supports a bearish continuation bias.
📊 6. Previous Targets and Structure Memory
The previous targets and historical swing points are not just annotations — they represent real zones of order flow memory.
When price revisits these levels, you often see reactions (reversals, consolidations, or continuation).
🎯 Trade Plan (Based on Chart):
Bias: Bearish
Entry Zone: After rejection confirmation at mini resistance
Target Zone: 0.00675 area (50% retracement)
Invalidation: Close above 0.00715 (Major Resistance)
✅ Conclusion:
This JPY/USD 4H chart beautifully showcases the power of technical structure, Mirror Market Concepts, and liquidity-focused trading. With a clean rejection from mini resistance, a history of mirrored bearish setups, and a confluence target at the 50% zone, this chart suggests a high-probability short opportunity for disciplined traders.

Cautiously Bullish - Approaching Long-Term Resistance.Entry Zone: We recommend initiating a BUY position in TCGSRAAC only upon a decisive and sustained breakout above the major descending trendline (around ₹115 - ₹118). A daily close above this level with good volumes would be a strong confirmation.
Target 1 (T1): ₹125
Target 2 (T2): ₹132
Target 3 (T3): ₹140+ (If momentum sustains significantly post-breakout)
Stop Loss (SL): ₹105 (Strictly on a daily closing basis, for a breakout entry)
Rationale:
Long-Term Resistance Test: The stock is currently testing a significant descending trendline that has been acting as a major resistance for over several months. A successful breakout would signal a substantial shift in the long-term trend.
Support from Accumulation Zone: The stock has recently bounced from a strong demand zone around ₹80 - ₹88 (highlighted in blue), indicating underlying buying interest.
RSI Rising: The Relative Strength Index (RSI) has recently crossed above the 50-mark and is trending upwards, suggesting a buildup of bullish momentum as the price approaches resistance.
Volume Activity: While recent volumes are moderate, a significant surge in volume on the day of the potential breakout would be crucial for confirmation.
Risk-Reward: A breakout offers a good risk-reward setup for short-term traders, targeting the next set of resistance levels.
Key Risk: Failure to break above the major descending trendline could lead to a reversal and a fall back towards the ₹95 - ₹100 levels. A sustained daily close below ₹105 would invalidate the bullish breakout attempt.
Disclaimer: This report is for informational purposes only and does not constitute financial advice. Investors should conduct their own due diligence and consult with a qualified financial advisor before making any investment decisions. Equity investments are subject to market risks.
For Education Purposes Only

BTCUSD Curve Breakout & MMC Structure | Targeting $111KIn this idea, we apply Mirror Market Concepts (MMC), a method of analyzing symmetrical price behavior to forecast key market moves. This BTC/USD 15-minute chart showcases a beautiful execution of MMC principles, blending curved structure analysis, SR interchange, and trendline dynamics to capture a compelling bullish opportunity.
🧩 Chart Structure Analysis (Detailed Breakdown):
🔸 1. Curve Line Formation & Mirror Market Concepts (MMC):
The centerpiece of this analysis is the curved market structure, which resembles a cup-like formation. Using MMC, the market is seen as reacting in mirrored patterns — left side = right side. In this context, the curve mimics the balance of supply and demand over time, providing a visual roadmap of potential price behavior.
Curve Line Resistance: The upper black arc served as dynamic resistance.
Curve Line Support: The lower arc acted as dynamic support.
Once price broke above the curved resistance, it confirmed a bullish market structure shift, triggering a key breakout signal.
🔸 2. Breakout & Retest Pattern:
Following the curve line resistance breakout, price pulled back for a retest, validating the structure. This is a high-probability continuation setup where:
The breakout confirms bullish interest.
The retest confirms that former resistance is now support.
This retest occurred exactly near the intersection of:
Curve Line Support
SR Interchange Zone (gray shaded area)
Trendline Support
This confluence adds strength to the bullish outlook.
🔸 3. SR Interchange Zone (Support/Resistance Flip):
The horizontal SR Interchange area is a key pivot zone, where price previously faced resistance. After the breakout, price came back to this level and found strong buying interest, flipping it into support.
This acts as a reaccumulation zone.
Price rejected from this zone with a clean bullish impulse.
🔸 4. Trendline Support Validation:
After the retest, price formed a new ascending trendline, respected multiple times by price. This ascending trendline acts as a guide for trailing stop placements or re-entry zones. Price remained above this trendline, reinforcing bullish structure integrity.
🔸 5. Central Zone & Liquidity Sweep:
The Central Zone marked a midpoint in the curve, which:
Acts as a balance point between the mirrored halves.
Is often used as a liquidity grab area before direction continuation.
Price dipped into this zone, likely collecting stop orders or liquidity before reversing higher — a classic MMC behavior.
🔸 6. 50% Retracement Level:
A horizontal marker near the 50% retracement level serves as a psychological and technical barrier. As of the last candle:
Price is hovering around this midpoint.
A breakout above this level would trigger further bullish movement toward the target zone.
Traders often look for volume expansion at this point to confirm conviction.
🔸 7. Target Zone (Projected via Curve Symmetry & Range Extension):
The target zone is marked near $111,600, based on:
Mirror projection of the curve's depth (height symmetry).
Range extension from the curve’s breakout.
Potential measured move based on pre- and post-breakout range.
This level represents a logical exit or partial TP zone for long positions.
📈 Trading Plan Summary:
Entry Zone: After breakout and retest around the SR Interchange/Curve Support/Trendline Confluence.
Support Confirmation: Trendline holding and bullish structure above central zone.
Mid-Target: 50% retracement breakout ($110,400).
Main Target: $111,600+ target zone based on curve projection.
Invalidation: Clear break below trendline and loss of SR flip zone.
🔍 Educational Takeaways:
Mirror Market Concepts (MMC) are highly effective in anticipating symmetrical price behavior.
Confluence of curved breakout, SR flip, and trendline validation provides high confidence in trade setups.
Market symmetry helps define logical targets, entries, and risk zones.
Always look for a pullback to structure — the best trades often come after the breakout and confirmation.
🚨 Risk Management Reminder:
As always, proper risk management is crucial. Wait for confirmation before entering, and use stop-losses below structural levels (such as the trendline or SR Interchange zone) to limit downside risk.
