Silver Slips to $33.31 on Profit-TakingSilver eased to $33.31 per ounce, pulling back slightly as investors booked profits after recent gains. The retreat came even as the dollar remained weak and geopolitical tensions, including the conflict in Ukraine, persisted. While momentum slowed, physical demand, especially from Asia, continues to provide a firm base for silver.
Support is at $32.30, with resistance at $33.80. Additional levels include $34.20 and $34.90 above, and $31.40 and $30.20 below.
Technical Analysis

Gold Holds Near $3,340 on Trade HopesGold remained steady at nearly $3,340 per ounce on Tuesday, with demand easing slightly due to renewed trade optimism after Trump pushed back EU tariffs to July 9. The EU pledged to speed up negotiations, lifting risk sentiment. However, worries over U.S. fiscal health, global trade dynamics, and geopolitical tensions kept markets cautious. Investors now await the FOMC minutes and PCE inflation data for policy cues.
Support is seen at $3,270, while resistance is located at $3,370. Further levels include $3,150 and $3,025 below, and $3,440 and $3,500 above.

Pound Tops $1.357 on Solid DataGBP/USD advanced above $1.357, hitting its highest level since February 2022, as Trump’s delay of the 50% EU tariff boosted global sentiment. The pound also gained from promising April data, with retail sales rising 1.2%, marking the fourth monthly gain. Inflation stayed high at 3.5%, adding uncertainty over the BoE’s next move. Markets now price in a 50% chance of a rate cut by August, with another possible by year-end.
Support lies at 1.3425, with resistance at 1.3600. Other key levels are 1.3850 and 1.3750 above, and 1.3165 and 1.2890 below.

Euro Nears $1.14 as Dollar is PressuredEUR/USD climbed to $1.1395, approaching a one-month high as the dollar softened amid mounting U.S. fiscal concerns and uncertainty over Trump’s tax-and-spending bill. Risk sentiment improved after Trump delayed a planned 50% tariff on EU goods, easing fears of a transatlantic trade clash. The euro also gained from ECB President Lagarde’s remarks that it could strengthen as a global currency if EU institutions were reinforced.
Resistance is at 1.1425, with additional levels at 1.1460 and 1.1580. Support begins at 1.1260, followed by 1.1100 and 1.1050.

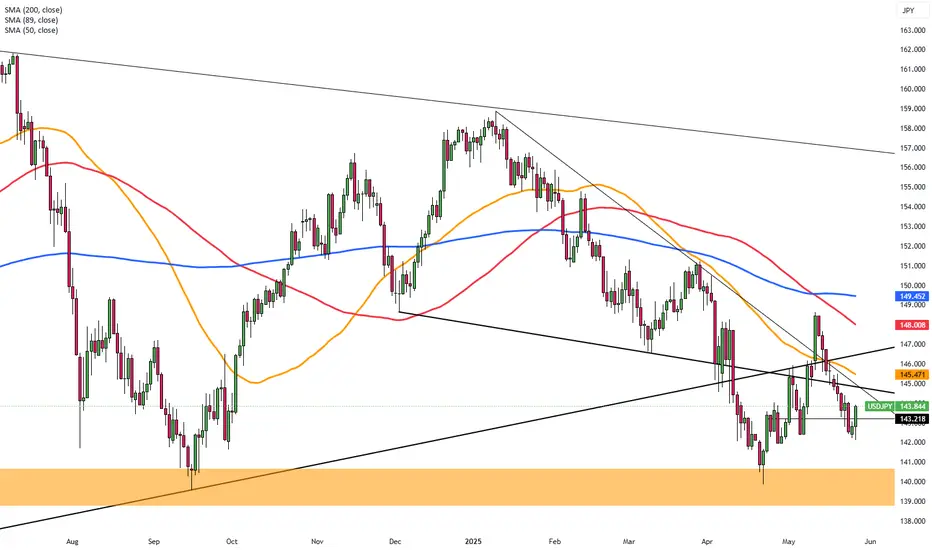
Yen Reaches Highest Level in a MonthThe Japanese yen strengthened toward 142 per dollar on Tuesday, its highest in four weeks, driven by safe-haven inflows and weak dollar sentiment tied to Trump’s fiscal plan. Worries over a widening U.S. deficit weighed on the greenback, while speculation of a 25% iPhone tariff added to trade conflicts. Domestically, expectations for more BoJ tightening rose after core inflation surprised at 3.5%, a two-year high.
Resistance stands at 148.60, with further levels at 149.80 and 151.20. Support is found at 139.70, then 137.00 and 135.00.
Gold Price Action Analysis – Using MMC (Mirror Market Concepts) 🔍 Overview:
In this idea, we dive deep into XAU/USD's (Gold) short-term bearish move using a blend of Mirror Market Concepts (MMC) and Smart Money Concepts (SMC). The 15-minute chart provides an excellent visual of market psychology shifting, with CHoCHs, supply-demand zones, SR flips, and the Black Mind Curve highlighting the story of price.
🧩 Market Structure Breakdown:
🔵 1. Major Resistance Zone Formed
Price pushed aggressively upward but met strong rejection near the major resistance zone.
This zone acts as a ceiling for the bullish momentum—setting the first signal for a possible reversal.
🔵 2. Black Mind Curve Activated
A descending Black Mind Curve was plotted to reflect the psychological shift from bullish to bearish.
Price failed multiple times to break above this curve, highlighting strong internal weakness.
The Black Mind Curve visually reinforces the bearish tone and offers a roadmap for probable lower highs.
🔵 3. Minor Resistance + SR Interchange
As price dropped, it created a minor resistance.
When price returned to this area and rejected it, this confirmed an SR Flip (Support-Resistance Interchange)—a classic MMC feature.
Mirror Market Concepts suggest that old demand often mirrors into new supply. That's exactly what happens here.
🔵 4. Major CHoCH: Change of Character
A decisive break of the bullish structure signaled a Major CHoCH, confirming bearish order flow.
This is the moment smart money starts repositioning for shorts—liquidity has been grabbed above previous highs, and the direction shifts.
🔵 5. 50% Retracement
After the impulsive drop, price retraced nearly 50%—a key area of interest for MMC traders.
This level often acts as a decision point. In this case, price rejects the retracement, creating an ideal zone for re-entries.
🔵 6. Targeting the Demand Zone
The projected target lies in a prior demand zone, which mirrors earlier supply structure.
This aligns with MMC’s principle of "market reflection"—what was resistance becomes support again, and vice versa.
🎯 Trade Bias: Bearish
Entry Confirmation: After CHoCH + rejection from 50% level + re-alignment with Black Mind Curve.
SL: Just above the 50% retracement or last minor high.
TP: At the marked target zone near historical demand.
🧠 Why MMC Works Here:
MMC helps you see the market in reverse—where previous zones mirror and reflect. Combined with smart money triggers like CHoCHs, BOS, liquidity sweeps, and SR flips, this makes for a precise trading model that goes beyond basic support and resistance.
The beauty of MMC is that it reveals where the crowd is wrong and where the real momentum lies.
🔑 Key Takeaways for Traders:
The Black Mind Curve helps visualize hidden resistance paths.
CHoCHs are crucial in understanding market intent.
MMC allows traders to anticipate instead of react.
High probability setups form where multiple MMC/SMC elements converge.
Always wait for confirmation, not assumption.

MarketBreakdown | USDJPY, US100, BITCOIN, GBPJPY
Here are the updates & outlook for multiple instruments in my watch list.
1️⃣ #USDJPY 4H time frame 🇺🇸🇯🇵
I see a strong bullish reaction to a key daily/intraday horizontal support.
A formation of a high momentum bullish candle and a violation of a resistance line
of a bullish flag indicate a highly probable rise to higher levels.
2️⃣ #US100 #NASDAQ Index 4H time frame
I spotted one more bullish flag on US100.
Its resistance was violated yesterday and we already see
a strong buying interest.
I think that the market will rise more, at least to a current local high.
3️⃣ #BITCOIN #BTCUSD daily time frame
The price nicely respected a confluence zone based on
a rising trend line and a recently broken horizontal structure.
Probabilities will be high that the market will continue rising from that.
4️⃣ #GBPJPY daily time frame 🇬🇧🇯🇵
The price nicely respected a solid rising trend line.
I see a breakout attempt of a minor daily horizontal resistance.
IF a daily candle closes above that, it will provide a strong bullish confirmation.
Do you agree with my market breakdown?
❤️Please, support my work with like, thank you!❤️
I am part of Trade Nation's Influencer program and receive a monthly fee for using their TradingView charts in my analysis.

EURUSD – Bouncing on trendline amid EU optimismEURUSD continues to hold a strong upward momentum within a short-term ascending channel. After retesting the channel bottom around the 1.1360 zone, price is showing signs of rebounding, and a "small double bottom" pattern appears to be forming. If confirmed, EURUSD may rally toward the resistance area at 1.1447.
Factors supporting the bullish trend:
Trump temporarily postponed the 50% tariff on EU goods until July 9 → Trade tensions ease, supporting the euro.
Germany's Q1 GDP grew by 0.4% – above expectations → Boosts confidence in Eurozone recovery.
The ECB aims to elevate the euro’s global role (digital euro, cross-border payment improvements).
Potential scenario:
If the 1.1360 zone holds (channel bottom + EMA support), there is a high chance that price will retest and break above the 1.1447 resistance.

GBPUSD SHORT IDEAGBPUSD has been rally up for a while. Currently, there's a divergence signal from the awesome oscillator on the daily timeframe. Switching to 4 hours timeframe, there's a clearer view of what's going on. Based on the 4 hours chart, rising wedge has been formed and there's also a bearish divergence signal from the awesome oscillator. In addition to these, price has mitigated a daily supply zone after taking out a significant high as a liquidity. Then, a bearish engulfing candlestick was formed, signifying potential reversal. On 1 hour timeframe, price has broken out of a rising wedge and retested it.
As a retail trader, one can enter a short position after the bearish engulfing candlestick confirmation. This aligns with the 1 hour breakout and retest. While one can wait for price to break out of the 4 hours rising wedge.
As a smart money trader, one can wait for a change of character and break of structure on the 4 hours timeframe to confirm that price has really changed its trend ready for a reversal.
Either way, one can take advantage of the potential short opportunity on GBPUSD.
Confluences for the short signal:
1. Bearish divergence signal from awesome oscillator on daily and 4 hours timeframe.
2. Rising wedge on 4 hours timeframe.
3. Price mitigating daily supply zone.
4. Price has taken out a significant high as a liquidity.
5. Bearish engulfing candlestick formation on 4 hours timeframe.
Disclaimer: This is not a financial advice. The outcome maybe different from the projection. If you can't accept the risk, don't take the signal.

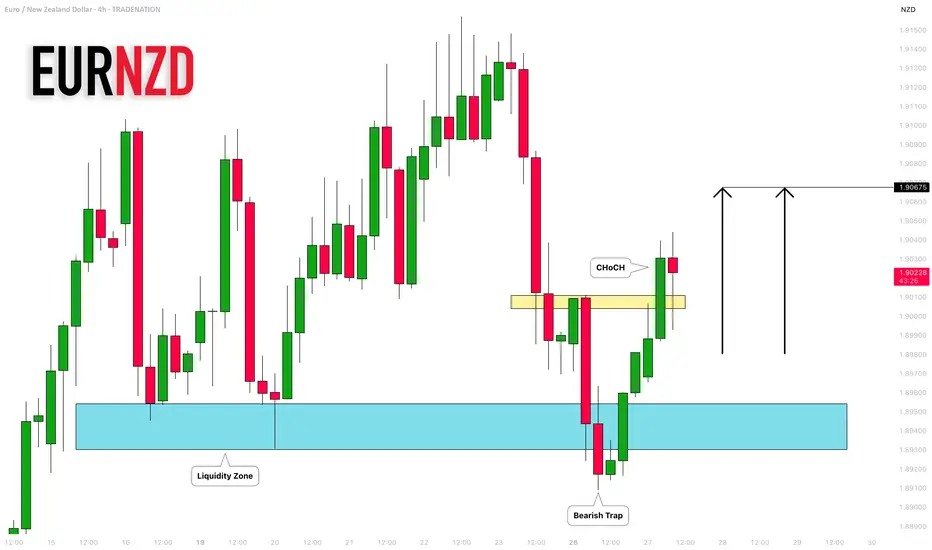
EURNZD: False Breakout & Bullish Movement 🇪🇺🇳🇿
I think that EURNZD may rise today after
a confirmed bearish trap and a bullish CHoCH.
Next resistance - 1.90675
❤️Please, support my work with like, thank you!❤️
I am part of Trade Nation's Influencer program and receive a monthly fee for using their TradingView charts in my analysis.
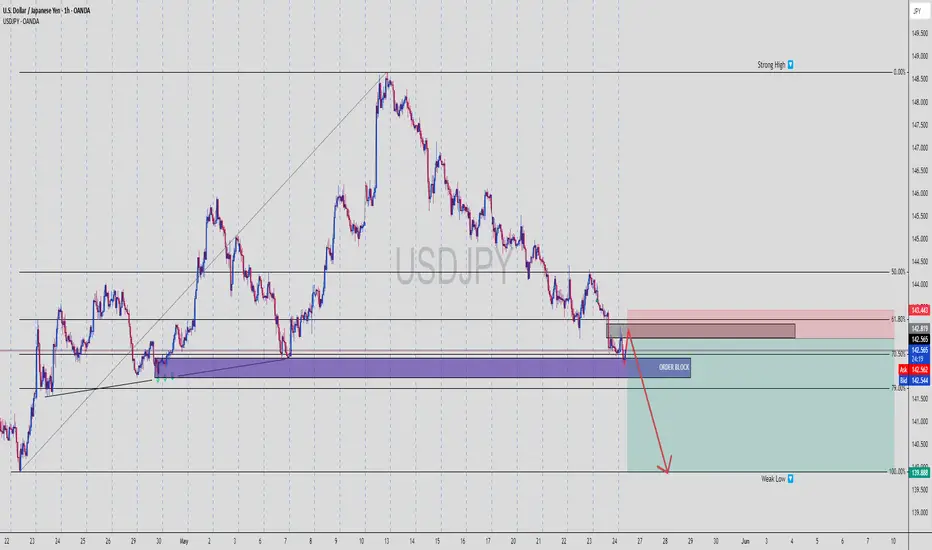
USDJPY | FVG + OB + Weak Low Target = Textbook SMC Setup📊 USDJPY | 1H Bearish Play – Smart Money In Control
We’re seeing a classic setup where price retraces into a bearish zone of confluence and prepares for a selloff toward internal liquidity. Check the breakdown:
🔻 1. Structure Shift Confirmed
Price broke structure on the downside after forming a lower high
Current move is a retracement into discount OB zone
Clear rejection is forming, signaling short momentum incoming
🟪 2. Zone Confluence
📌 Order Block (OB): Sitting just under the 61.8% Fib
📌 Fair Value Gap (FVG): Mitigated perfectly
📌 Fib Retracement: Price reacts between 61.8% and 70.5% — classic Smart Money play
📌 Previous Demand Turned Supply: This level is now acting as a rejection zone
This is stacked confluence — just how Smart Money likes to move.
💣 3. Entry Strategy
Entry Zone: 142.55 (midpoint of the OB reaction area)
Stop Loss: Above 143.443 (above OB + liquidity wick)
Take Profit: 139.888 (weak low, previous liquidity resting point)
⚖️ 4. Risk-to-Reward Ratio (RRR)
🎯 TP = 139.888
📍 Entry = 142.550
🔐 SL = 143.443
✅ RRR ≈ 1:3.5
A great example of high-probability short setup using pure Smart Money logic.
📉 5. Why This Works
Retail traders will try to long at this zone hoping for a breakout
Smart Money uses this zone to engineer liquidity
They tap into the FVG/OB, then target internal liquidity and weak lows
Clean, controlled sell-off expected down to 139.888
🧠 SMC Insights
This chart is all about liquidity engineering:
Push up into OB
Reject at premium pricing
Drive down to weak low to collect stops
Possibly reverse or continue trend from there
💬 Comment “FVG TAP + OB = 🔥” if you spotted this setup early
💾 Save it before the drop happens
📤 Share with a fellow SMC trader who needs this breakdown
How to use advanced candlestick anatomy in trading: CADJPYEvery candlestick on the chart is made up of different or multiple candles on the lower timeframe. For example, a weekly candle is made up of seven daily candles. While a 4 hours candle is made up of four 1 hour candles. Understanding how these candles contribute to the formation of a single or more candlesticks will go a long way in improving our performance.
Candlestick anatomy has to do with the formation of candlestick on the chart and the implication of such candlestick. Conventionally, common candlesticks are engulfing candlestick, doji, evening star, hammer, pin bar and the rest. Some signify continuation while others are meant for reversal. The formation of these candlesticks at key levels provide an helpful insights into understanding the next market move. Hence, they can serve as confluence and confirmation for our trading decision.
Taking this further a bit, by examining these candlesticks, one can get to understand better a precise point for entry and exit. This may be new to a retail trader who trades just the candlestick while it will provide more insights for anyone looking for ways to optimize his performance.
As a case study, I had a sell setup on CADJPY and it gave a bearish engulfing candlestick on 1 hour timeframe as a confirmation for selling. Instead of entering the trade after the bearish candle closed, I changed to 5 minutes timeframe to examine the anatomy of the candlestick. Then, I discovered that there was sweep and change of character. Based on the price narrative on 5 minutes timeframe, then trading decision was made using the 5 minutes timeframe, targeting 3 RR. If 1 hour timeframe had been used for taking the trade, one is likely to have lost the profit by now.
Candlestick anatomy will help you to optimize your performance and returns.
I hope you've learnt something helpful from this post.
Thanks.
Fatai Kareem, Kof T Fx.

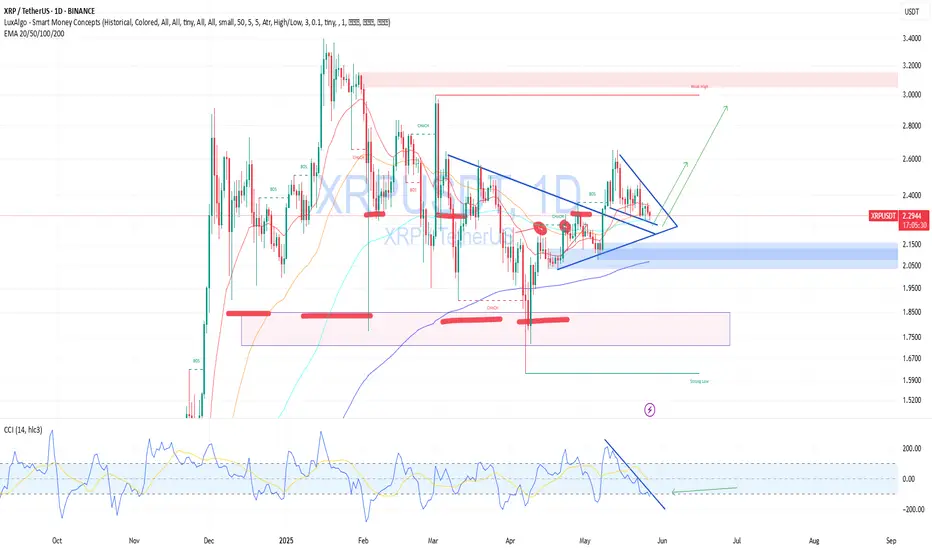
XRPUSDT — Buy From Support, Waiting for Triangle BreakoutOn the 4H chart, XRP is consolidating inside a symmetrical triangle and holding above an ascending trendline — a key support zone that has held multiple times.
🧠 Fundamentally:
Ripple continues expanding partnerships with fintech and banks.
The SEC lawsuit has lost its grip on price action.
A potential Fed rate cut could push crypto sentiment up again.
📌 I’m entering positions near $2.31, gradually accumulating. A breakout above the triangle could trigger a strong move.
🎯 Targets:
$2.50 — initial resistance
$2.65+ — if breakout is confirmed with strong momentum
🔽 If price breaks below $2.20, I’m looking to buy confidently near $1.80, where major demand sits. I don't expect such a dip, but markets can surprise.
Weekly $SPY / $SPX Scenarios for May 27–30, 2025🔮 Weekly AMEX:SPY / SP:SPX Scenarios for May 27–30, 2025 🔮
🌍 Market-Moving News 🌍
🇺🇸 Tax-and-Debt Debate Rattles Markets
Washington’s push to advance a massive tax-cut and spending bill—projected to add $3.8 trillion to an already $36.2 trillion debt—has investors questioning U.S. fiscal discipline. The dollar weakened further, while Treasury yields remain elevated on credit-rating concerns and deficit fears
⚖️ Trump Delays EU Tariffs, Lifts Sentiment
President Trump pushed back 50% tariffs on EU goods from June 1 to July 9 after talks with EU leaders. U.S. futures jumped, and global markets breathed easier despite lingering trade-policy uncertainty
📈 Bond Yields Spike, Then Stabilize
Both 20- and 30-year Treasury yields jumped above 5.1% before easing slightly as auction demand picked up. Fed officials signaled they expect to hold rates steady for the next two meetings, putting a floor under yields
📊 Key Data Releases 📊
📅 Tuesday, May 28:
9:00 AM ET: Case-Shiller Home Price Index
10:00 AM ET: Consumer Confidence (May)
📅 Wednesday, May 29:
8:30 AM ET: Advance Q1 GDP
8:30 AM ET: Personal Income & Spending (April)
📅 Thursday, May 30:
8:30 AM ET: PCE Price Index (April)
10:00 AM ET: Pending Home Sales (April)
⚠️ Disclaimer:
This information is for educational and informational purposes only and should not be construed as financial advice. Always consult a licensed financial advisor before making investment decisions.
📌 #trading #stockmarket #economy #news #trendtao #charting #technicalanalysis

[INTRADAY] #BANKNIFTY PE & CE Levels(27/05/2025)Today, Bank Nifty is expected to open flat near the 55550 level. If it sustains above 55550, we may see further bullish momentum with upside targets of 55750, 55850, and 55950+. This breakout level may trigger strong buying interest.
On the downside, if Bank Nifty fails to hold above 55550 and drops below the 55460–55400 zone, then a bearish move may be seen toward 55250, 55150, and 55050 levels.
If it slips further below 55100, another buying opportunity may come near the 55050–55100 zone for a possible bounce targeting 55250, 55350, and 55450+.

#NIFTY Intraday Support and Resistance Levels - 27/05/2025Today, Nifty is expected to open flat near the 25000 level. If it sustains above 25000, we may see bullish momentum toward 25150, 25200, and 25250+. This level is a key breakout zone for further upside.
However, if Nifty fails to hold above 25000 and starts trading below the 24950–24900 zone, a short trade setup may trigger with downside targets of 24850, 24800, and 24750.
Further weakness will be confirmed only if Nifty breaks below 24750–24700, possibly extending the downside to 24600 and 24550.

Trump Eases Tariff Pressure, Gold Awaits Fed SignalsOn May 26, U.S. President Donald Trump decided to extend the deadline for the 50% tariff on goods from the European Union until July 9. This move temporarily eased trade tensions and slightly reduced the demand for gold as a safe haven.
Gold is currently trading near a long-term descending trendline that has previously rejected three bullish attempts. After a strong recent rebound, the price is now pausing and risks retracing toward the support zone around 3,241.4 – a confluence area with both the EMA 34 and EMA 89.
If this support holds, gold may bounce back and attempt a breakout above the trendline, targeting the 3,439.5 level. However, if selling pressure continues to dominate, a deeper correction remains a real possibility.
This week, investors will closely watch the FOMC meeting minutes and the U.S. Consumer Confidence Index for May. These data releases are expected to shed light on the Federal Reserve’s outlook on inflation and interest rate policy, which could significantly impact the strength of the USD and gold prices.

GBPAUD ANALYSIS Based on technical analysis GA is in a bullish trend and we should only be looking for buys.
Expect a pullback near the fibs tool reversal zone for a buy entry.
Risk Reward- 1% : 3 or your TP can be the 4H HH zone.
Keep your trading plan simple and only take quality trades in the direction of the trend. The trend is your soulmate.

NEM SHORT IDEANEM Insurance stock is ready to have a drop. There's a bearish divergence signal from the awesome oscillator showing that there's a high tendency for the price of the stock to drop as much as to 11.65 and below that value. Any value below 11.50 is the discount level where there can be a potential for the next long opportunity.
Looking at the past data, some patterns were revealed. In September 2016, there was a bearish divergence signal and the price dropped from around 3.71 to around around 1.51. Likewise, in September 2022, there was a bearish divergence and the price dropped from around 5.65 to around 3.71. Similar pattern is what is repeating itself showing that there's a higher probability that the price dropped into the discount level. For an investor holding this stock, this maybe a signal to sell and wait for another long opportunity. For a trader, it's an opportunity to short the stock, targeting the discount price around 11.65.
Confluences for the short signal:
1. Price is showing higher high while awesome oscillator is showing lower high indicating bearish divergence.
2. When similar patterns occured in the past, price dropped into the discount level.
3. A bearish engulfing candlestick had been formed showing that price is likely going to drop further.
Disclaimer: This is not a financial advice. The outcome maybe different from the projection. If you can't accept the risk, don't take the signal.

NASCON LONG IDEA CONTINUATIONNASCON stock reached its all time high value of around 77 in January 2024. This happened after a bearish divergence signal from the awesome oscillator. Then, it dropped into the discount level. After which a bullish divergence signal was given, followed by a breakout. Since that breakout, price has been going up and rally for the all-time-high value. The first long opportunity could have been in November 2024 when the price was around 30. The next opportunity was when the price was around 44. Then the next opportunity was when price was around 54. Joining the rally now is not too late since the stock has a potential to hit 77.
Confluences for the long idea
1. Price was coming from the discount level.
2. Price broke out of a down trend line.
3. Price has been rally after a bullish divergence signal given by the awesome oscillator.
4. Bullish engulfing candlestick was formed recently after breaking a key level.
Disclaimer: this is not a financial advice. The outcome maybe different from the projection. If you can't accept the risk, don't take the signal.

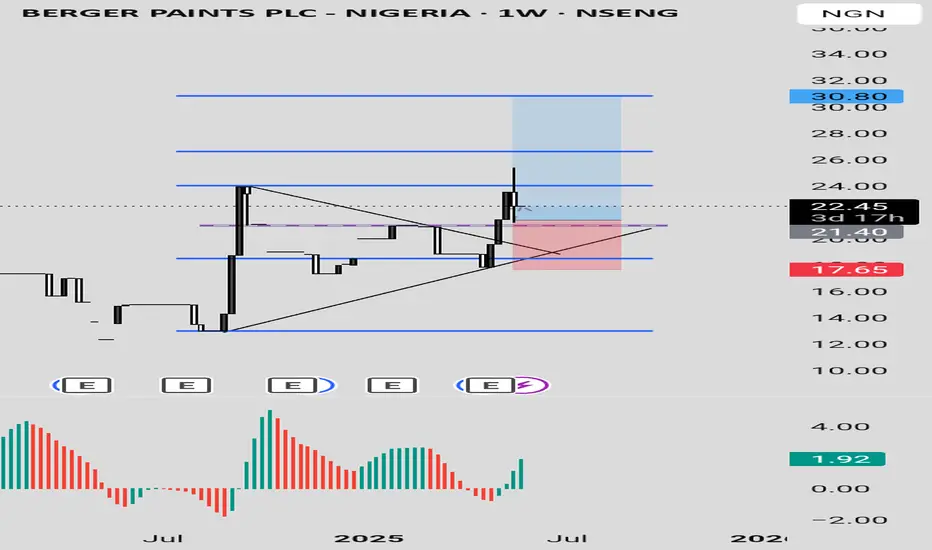
Berger Paints PLC Berger Paints PLC stock is showing a bullish signal for appreciating in value. The price dropped into a discount level and broke a down trend line with a strong bullish candle, closing above the trendline. This happened when the price was also in an oversold region as indicated by Awesome Oscillator.
Currently, there has been a pull back with a rejection, showing more confidence in the bullish move. The stock can be bought at the current price while targeting 24, 26.60 and 30.80 as the final target based on the Fibonacci level.
Confluences for the long signal:
1. Price is coming from a discount level
2. Price was in oversold level before and it is showing more bullish signal
3. Price had broken out of a down trend line with a strong bullish candle
4. There was a strong rejection from last week candle.
Disclaimer: this is not a financial advice. The outcome maybe different from the projection. Don't take the signal if you don't accept the risk.
RT BRISCOE PLC LONG IDEART BRISCOE PLC stock, after reaching its all time high, dropped to discount level. Currently, it has broken out of down trend line with a strong weekly bullish candle closing above a the down trend line and resistance level. The awesome oscillator is also in the oversold region with a bullish signal. An aggressive trader or investor can buy at the current price while a conservative trader or investor may wait for a drop to around 2.20 and 2.30 to place a buy. While you can also so spread your risk by buying at the current market price and add more positions when price drop towards the resistance turned support.
The entry is at the current market price or buy at 2.20 while the stop can be at 1.73 and the target can be around 2.90 and 4.30.
Confluences for the long signal:
1. Price is in discount level
2. Price broke out of a down trend line and resistance level with a strong bullish candle.
3. Awesome oscillator is in oversold region and showing bullish signal.
Disclaimer: this is not a financial advice. The outcome maybe different from the projection. If you can't accept the risk, don't take the signal.

TradeCityPro | ADAUSDT Is It Time to Buy Cardano?👋 Welcome to TradeCityPro Channel!
Let’s dive in and analyze one of the market’s favorite coins, Cardano (ADA), which is in a strong position compared to most altcoins and is holding at higher resistance levels.
🌐 Overview Bitcoin
Before starting the analysis, I want to remind you again that we moved the Bitcoin analysis section from the analysis section to a separate analysis at your request, so that we can discuss the status of Bitcoin in more detail every day and analyze its charts and dominances together.
This is the general analysis of Bitcoin dominance, which we promised you in the analysis to analyze separately and analyze it for you in longer time frames.
Bitcoin Chart
📊 Weekly Timeframe
On the weekly time frame, ADA, like SOL, SUI, XRP, and most of the top ten coins in the market, is still in a better situation, with the price fluctuating at higher levels.
After being rejected at 1.1983 and losing support at 0.7959, we experienced a sharp drop to 0.50, driven by panic in the market due to Trump and U.S. tariffs on other countries.
Currently, in the weekly time frame, we’re still at higher levels compared to most of the market, and we can expect a strong move going forward. It’s worth noting that breaking 1.1988 will provide the best trigger for a buy.
📈 Daily Timeframe
Interesting things are happening on the daily time frame, and we’re clearly still at higher levels than other altcoins. If the market itself undergoes a trend change, we can be ready for a long trigger sooner.
After breaking 0.8204 and losing the 0.236 Fibonacci level, we experienced a sharp decline that also saw high volume. I expected that after this volume, we’d transition from volatility to forming a range box, and that’s exactly what’s happening. We’re forming a box between 0.6777 and 0.8204, but if today’s daily candle closes as it is, the downtrend will continue!
Additionally, after this event, we had a break of the support floor that turned out to be a fakeout, leading us to establish a new support level. Currently, our most important support is 0.6090, and we’re moving along a daily trendline. If we bounce from this trendline and break the 0.8419 resistance, it will be the best trigger for a buy. On the other hand, if the support breaks and we lose the 0.7417 low, we can go for a short position.
📝 Final Thoughts
Stay calm, trade wisely, and let's capture the market's best opportunities!
This analysis reflects our opinions and is not financial advice.
Share your thoughts in the comments, and don’t forget to share this analysis with your friends! ❤️
