EURUSD Trendline Breakout – Bullish Target Ahead
EURUSD has successfully broken out of a strong descending trendline, which was acting as dynamic resistance for weeks. The breakout is backed by strong bullish candles and clear higher lows forming.
After the breakout, the price also reclaimed a key horizontal support zone around 1.12573, turning it into a solid base for further upside.
🎯 Bullish Target (Expected):
First major bullish target at 1.13864 based on the 1.618 Fibonacci extension from the last swing move.
📌 Support: 1.12573
📌 Breakout Confirmation: Valid as long as price holds above the trendline and support.
📈 Outlook:
The momentum looks strong for further bullish continuation. If the price holds above the breakout zone, we expect a move toward 1.13864 in the coming sessions.
Technical Analysis

XAUUSD – Signs of Weakness at the Pressure ZoneToday’s market has low trading volume as both the UK and the US are on holiday. This makes price action more prone to “choppy” movements within a narrow range, and technical signals tend to become more reliable.
Gold is approaching a strong resistance zone around 3,420 – a level that previously triggered a sharp drop in early May. Based on the current technical structure, it’s clear that gold is entering a “pressure zone,” as upward momentum slows down and recent candles start to show hesitation.
The most likely scenario is a rejection at 3,420, followed by a pullback toward the 3,250 support area – where EMA 34 and prior accumulation volume converge. If this zone fails to hold, the next target could be around 3,170.
We don’t always have to “call the top,” but this is definitely a time to dial back bullish expectations and closely monitor price action in this sensitive area.

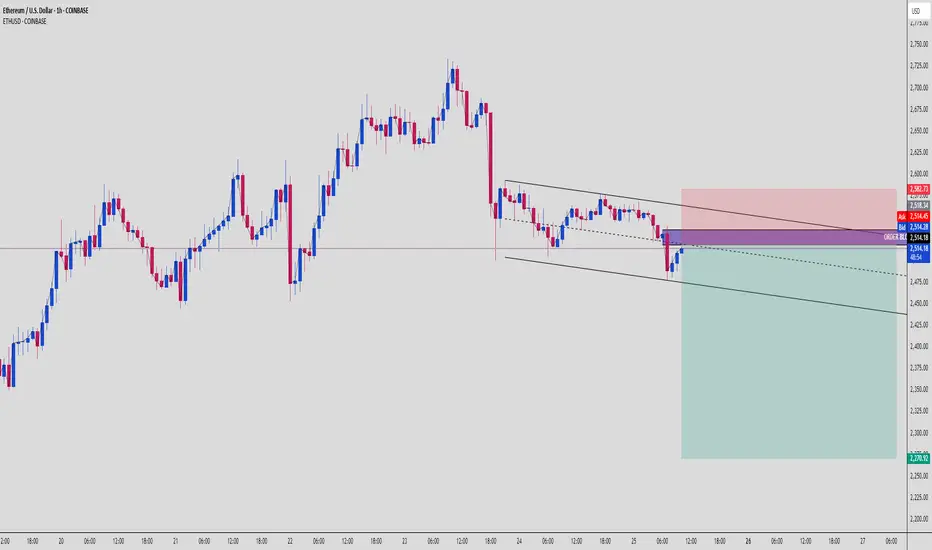
ETH Trap & Drop Setup – OB Rejection + Bearish Channel📉 Ethereum (ETHUSD) | 1H SMC Breakdown | Bearish Setup Explained
Another clean setup for the SMC gang. ETH just gave us a beautiful opportunity, respecting market structure, reacting to Order Block supply, and aiming to clean up sell-side liquidity. Let’s dive in 👇
🧱 1. Structure: Bearish Channel Formation
ETH has been moving in a tight bearish channel, producing:
Lower highs (confirmed supply zones)
Lower lows (liquidity grabs + structure breaks)
This shows consistent bearish pressure.
🧊 2. Premium OB Tap + Rejection Zone
Price just retraced into a Bearish Order Block sitting in the Premium zone, right around $2,514.
💥 OB zone is aligned with:
Upper channel resistance
Supply rejection
Clean inefficiency fill
Price wicked inside and immediately rejected = Smart Money active.
🧠 3. Retail Psychology Trap
Retail likely:
Longing support bounce
Placing stops under structure lows
Not respecting OB/imbalance narrative
Meanwhile, Smart Money:
Enters short from OB
Targets imbalanced zones
Eyes the $2,270 weak low
🎯 4. Liquidity Pool & Final Target
🔻 Target Zone: $2,270
This level is:
A weak low (high chance of being swept)
Sits at lower channel boundary
Acts as a liquidity magnet
Expect price to accelerate as it approaches this zone.
⚔️ 5. Trade Plan (Short Setup)
📍 Entry: $2,514 OB Zone
🔐 Stop Loss: Above $2,582 (structure break + OB invalidation)
🎯 Targets:
TP1: $2,460
TP2: $2,400
TP3: $2,270
⚖️ RRR: ~1:4+ – high precision trade
🧠 Key Concepts in Play:
Order Block Rejection
Premium Pricing Sell Setup
Bearish Channel Continuation
Liquidity Sweep Targeting
📌 Chart Summary:
"Don’t chase candles – follow the narrative. OB tells the story, liquidity gives the profit."
📚 Study the OB zone reaction. These setups repeat every week across assets if you know what to look for.
💬 Drop “ETH OB SNIPER” in the comments if this is your kind of entry.
📈 Tag a trader who needs to stop fading Smart Money moves!
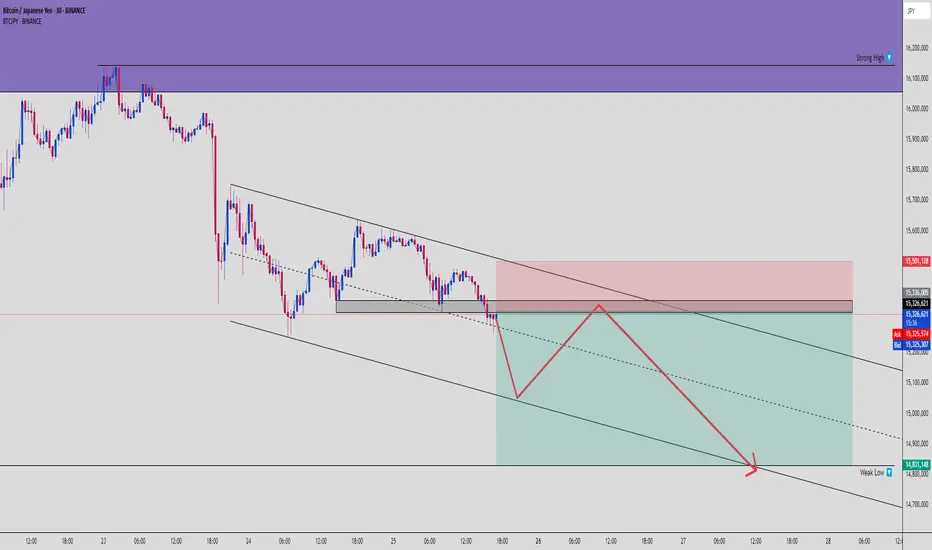
BTCJPY Bearish Channel Setup – OB Rejection to Weak Low Sweep🧠 Bitcoin vs Yen (BTCJPY) | 30M Smart Money Breakdown
BTCJPY is painting the same story we’ve seen before: liquidity builds → OB rejection → channel continuation → weak low sweep. This is how the markets bleed slow then drop fast. Let’s break it down.
🧱 1. Bearish Channel Structure
We’re inside a clear descending channel, where price:
Forms consistent lower highs (supply zones)
Prints lower lows (liquidity grabs)
Shows rejections at channel tops = perfect confluence
This structure supports a continuation downward move.
🧊 2. Order Block + Supply Rejection
Price recently tapped into a clean Bearish Order Block (OB) within the premium zone just under 15.5M.
OB was respected with a sharp reaction
Immediate sell pressure confirms Smart Money entry
Red zone = OB + supply + channel midline
No candle closes above OB = bias confirmed bearish.
🧲 3. Smart Money Flow vs Retail
Retail likely went long on the mini bounce.
Smart Money waited for:
Price to tap into the OB
Retail to stack longs
Opportunity to fill imbalance and dump
This gives us an ideal Sell-to-Buy-to-Sell structure forming.
🕯️ 4. Projected Move: Weak Low Sweep
🧨 Target = 14,831,148
Why?
That’s a marked Weak Low
It aligns with channel support
It’s a known liquidity magnet
Expect acceleration into this zone.
⚔️ 5. Trade Plan (Short Setup)
📍 Entry Zone: 15.315M – 15.33M
🔐 Stop Loss: Above OB → ~15.50M
🎯 Targets:
TP1: 15.200M
TP2: 15.000M
TP3: 14.831M
⚖️ RRR: ~1:4+ depending on execution precision
🧠 Summary:
This chart screams:
“Trap the liquidity, respect the OB, ride the channel.”
These setups repeat. Same pattern, different chart, every week.
📣 Engage Call:
💬 Comment “BTCJPY SHORT SNIPER” if you caught this one
👥 Tag your trading partner – don’t let them miss this play
🔄 Save this chart to study the OB entry mechanics
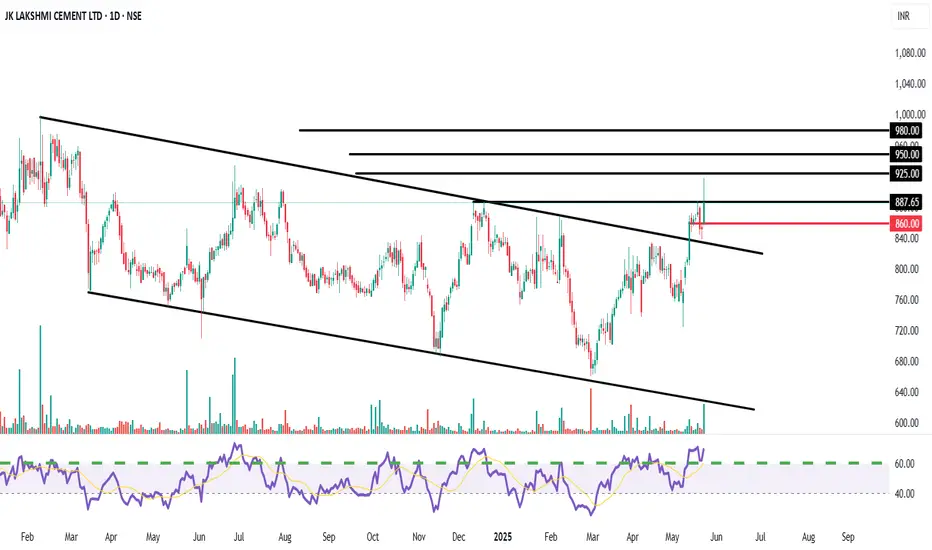
Potential Breakout from a Symmetrical Triangl Descending ChannelEntry Zone: We recommend initiating a BUY position in JK Lakshmi Cement around the current levels, ideally between ₹880 - ₹890. This considers the strong closing above the resistance trendline.
Target 1 (T1): ₹925
Target 2 (T2): ₹950
Target 3 (T3): ₹980 (If momentum sustains above T2)
Stop Loss (SL): ₹860 (Strictly on a closing basis)
Channel Breakout: The stock has decisively broken out of a multi-month descending channel/symmetrical triangle pattern, indicating a potential strong reversal from a corrective phase. This breakout appears to be supported by a noticeable pickup in volumes.
Key Resistance Breach: The stock has also managed to close above a significant horizontal resistance level around ₹880-885, which has acted as a hurdle multiple times in the past. A sustained move above this level confirms bullish intent.
RSI Strength: The Relative Strength Index (RSI) is showing strength, trading well above the 50-mark and moving towards the overbought zone, confirming increasing buying momentum.
Positive Price Action: The overall structure suggests accumulation at lower levels, and the current breakout could initiate the next leg of the uptrend.
Favorable Risk-Reward: The setup offers a compelling risk-reward profile for a short-term trade, with significant upside potential compared to the defined stop-loss.
Key Risk: A failure to sustain above the ₹880 level or a close below the ₹860 stop-loss would invalidate the bullish view and could lead to renewed selling pressure.
EUR JPY TECHHello dear traders :) It's time to share my new tech!
As we see here we have many reasons to think its ok position to open Long EURJPY
We got a strong uptrend here. We have 16 days LONG strong up channel in this pair. also a nice support point inside.
Our trades price target is near +60 pips (Take Profit).
If you have any Questions? Ask me!
FxCROWN :)
Thank you

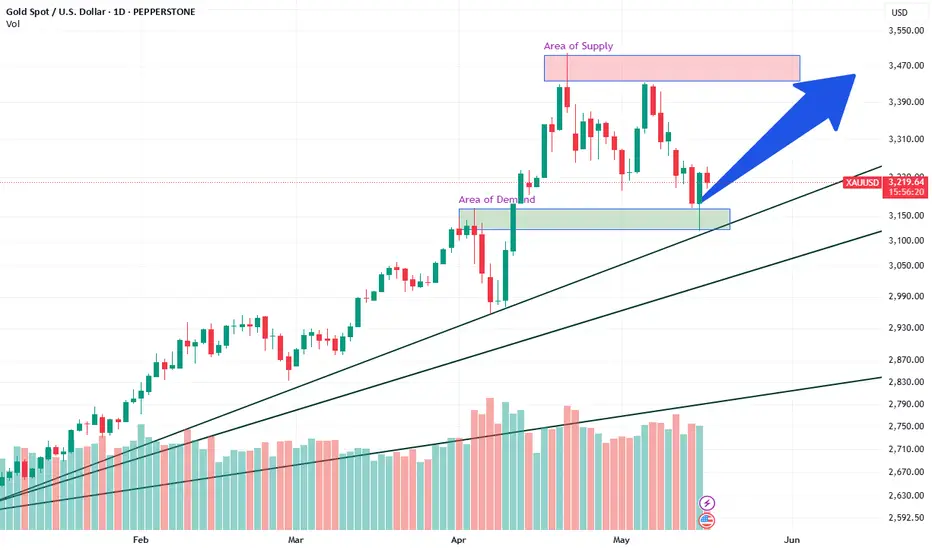
Golds Correction Is Over!Gold corrected itself all the way down to 3120 yesterday which is a significant demand level by institutions. Price then rebounded and closed at 3150. If it creates a confirmed HL by the end of Friday, the odds and probability XAUUSD will go back to its supply area at 3500 is highly probable. Price will also depend on macro fundamentals. The weekly shows a strong uptrend and so as the monthly chart. Institutions started buying back and increased their long positions.
EURUSD: Support & Resistance Analysis For Next Week 🇪🇺🇺🇸
Here is my latest structure analysis
and important supports & resistances for EURUSD for next week.
Consider these structures for pullback/breakout trading.
❤️Please, support my work with like, thank you!❤️
I am part of Trade Nation's Influencer program and receive a monthly fee for using their TradingView charts in my analysis.

Bitcoin Potential UpsidesHey Traders, in today's trading session we are monitoring BTCUSDT for a buying opportunity around 105,000 zone, Bitcoin is trading in an uptrend and currently is in a correction phase in which it is approaching the trend at 105,000 support and resistance area.
Trade safe, Joe.

Bullish - Breakout observed from a descending channelEntry Zone: We recommend accumulating FSL in the zone of ₹375 - ₹385.
Target 1 (T1): ₹405
Target 2 (T2): ₹420
Target 3 (T3): ₹450 (If momentum sustains above T2)
Stop Loss (SL): ₹360 (Closing basis)
Rationale:
Channel Breakout: The stock has successfully broken out of a prominent descending channel, indicating a potential shift in momentum from bearish to bullish. This breakout is supported by decent volumes on the breakout candle.
RSI Confirmation: The Relative Strength Index (RSI) has shown a strong move above the 50-mark and is trending upwards, suggesting increasing buying interest and underlying strength.
Support from Previous Levels: The breakout retests appear to hold the previous resistance now acting as support, which is a classic bullish reversal pattern.
Risk-Reward: The current setup offers a favorable risk-to-reward ratio for short-term traders.
Key Risk: A close below ₹360 would negate the current bullish view and could lead to further downside. Traders should adhere strictly to the stop-loss.
Disclaimer: This report is for informational purposes only and does not constitute financial advice. Investors should conduct their own due diligence and consult with a qualified financial advisor before making any investment decisions. Equity investments are subject to market risks.

BTCUSDT – Hitting resistance, is selling pressure returning?Bitcoin is showing signs of losing momentum after touching the resistance zone around 111,669. On the H4 timeframe, the previous bullish structure has stalled with a series of red candles and a clear pullback, bringing price back to test the EMA 34 zone.
In terms of news, although the market remains excited due to expectations surrounding a Bitcoin spot ETF, many large investors are starting to take profits after the recent sharp rally. This is causing selling pressure to slightly outweigh buying in the short term.
The most likely scenario now is that BTC could make a mild upward move to retest the 111,600 area – but if it fails to break above, a reversal back toward the support zone at 105,800 is highly probable. This area aligns with the EMA 89 and a previous accumulation zone.
Current strategy: don’t get caught in a false breakout. Instead, watch the 111,600 area and wait for a clear signal. If a reversal candlestick pattern appears, short-term sell entries may be considered with a target near the lower support.

EURUSD – Testing Key Resistance, Signs of a Pullback EmergingEURUSD is gradually approaching the strong resistance zone around 1.142 – a level that has rejected price at least twice in the past. The recent bullish momentum is clear, but the current move is nearing a major barrier, increasing the likelihood of a short-term pullback.
If the price fails to break this zone and rejection signals appear, a drop back toward the support area around 1.125 is highly possible – this level aligns with the EMA 89 and recent swing lows. It will be a key area to watch where the market might “take a breath” before deciding the next direction.
The current strategy is to patiently observe price action at this resistance zone. If confirmation appears, this could offer an opportunity for short-term sell setups. However, if the price decisively breaks above 1.142, the bearish scenario would be invalidated.

XAUUSD holds the trend – Will it break through 3,440?Gold continues to maintain a strong uptrend on the daily timeframe, supported by a rising trendline and upward-sloping EMA 34 and EMA 89. The price is now approaching the key resistance zone at 3,440 – a level that has been rejected twice in the past – making a slight pullback entirely possible.
However, the market structure shows no signs of reversal, and any dip toward the support area around 3,210 could present a “buy on dip” opportunity. As long as the price remains above the ascending trendline, the primary trend is still upward.
Traders are advised to patiently wait for clear signals near support rather than FOMO at resistance. If the 3,440 barrier is broken successfully, bullish momentum may accelerate toward higher targets.

BTCUSD MMC Breakdown – Curve Collapse & H&S Sell-Off Loading🔍 Chart Overview – BTC/USD (1H Timeframe)
This setup uses Mirror Market Concepts (MMC) to forecast Bitcoin’s next potential major move, blending institutional-level curve analysis, pattern recognition, and structure shifts.
We are currently seeing a Head & Shoulders (H&S) pattern develop under a Black Mind Curve Resistance, supported by a sloping neckline and a clear zone of structure breaks and retests. Price is positioned for a significant bearish continuation if confirmation hits.
📐 Breakdown of Key Components:
🧠 1. Mirror Market Concepts (MMC)
MMC focuses on the symmetry and memory of market behavior. When certain price structures mirror past reactions (support, resistance, or rejection points), we gain an edge in anticipating where big moves will happen.
Here, the curve structure and neckline level align to mirror prior bearish reactions.
👤 2. Head & Shoulders Pattern
Left Shoulder: Formed with rising volume and strong bullish momentum.
Head: A sharp move upward forming a new high, but eventually fails to sustain above the curve.
Right Shoulder: A weaker bullish attempt, indicating exhaustion and imbalance.
The neckline is clearly marked — a break below it validates the reversal pattern.
🟠 3. Black Mind Curve Resistance
This is an institutional resistance arc — an MMC dynamic level that mirrors prior selling patterns. Price reacted strongly under this curve, confirming its relevance.
It acted as a ceiling for the head formation, capping bullish continuation and turning price downward.
🔵 4. Black Mind Curve Support
Drawn beneath the price action, this dynamic support is about to be tested again. A clean break below the curve and neckline would likely result in a strong drop.
⚠️ 5. Major CHoCH & BOS Zones
CHoCH (Change of Character): Price failed to form new highs and showed early bearish shift.
BOS (Break of Structure): Confirmed when neckline is broken.
These are vital MMC confirmation points that strengthen the short idea.
🔁 6. Retest & Boom (Bearish Version)
Price could retest the neckline or the broken trendline (shown by the blue arrows), offering a perfect "sell on retest" opportunity before dropping to the target.
This is a classic MMC play — breakdown ➝ retest ➝ continuation.
🎯 7. Target Zone
Projected based on:
Height of the H&S pattern.
Previous key structure zone.
MMC symmetry principles.
Expected target: near $101,700 – $102,000.
🧨 Trade Idea:
✅ Bearish Setup (Preferred Bias)
Wait for a clean neckline break and candle close.
Look for retest of neckline or curve (lower timeframes).
Sell with target near $101,700, SL above right shoulder.
🚫 Invalidation:
Price closes back above right shoulder and curve.
Invalidates the bearish structure.

Gold 4H VIP Move – MMC Curve Break or Bounce?📈 Market: XAUUSD – 4H Timeframe
This setup is based on Mirror Market Concepts (MMC), a method that reflects the idea of market symmetry, key structural levels, and curve dynamics (institutional behavior). We’re looking at how price interacts with historically significant zones, demand transfers, and resistance curves.
🔍 Full Chart Analysis Breakdown:
1. ⚙️ Mirror Market Concepts (MMC)
MMC focuses on how past price actions "mirror" into the future. If a zone caused a strong move before, it can likely do it again — either by rejecting price or acting as a magnet for liquidity. You can see how historical supply and demand zones still influence price today.
2. 🧱 Major Resistance Zone (Top Blue Zone: ~$3,470 – $3,520)
This is a historical supply area where sellers were previously dominant.
Every time price enters this zone, it reacts with strong selling pressure.
Watch closely: a clean breakout + retest above this zone could open the door to higher time frame bullish continuation.
3. 🚧 Black Mind Curve Resistance (Orange Arc)
A dynamic resistance level based on institutional selling behavior over time.
This curve aligns with historical highs and retracements, suggesting smart money is actively defending this region.
Price is now testing this curve — either it gets rejected and drops, or breaks above for a breakout boom.
4. 🟦 Mini Reversal Zone (Around $3,400)
This zone sits right under the curve and major resistance, making it a critical decision point.
A strong reaction here could mean a short-term selloff, but if broken, this zone could flip into support, validating the breakout.
5. 📉 Trending Support Line (Upward Diagonal)
Acting as short-term bullish support.
As price pulls back, this trendline could catch the dip, causing a bounce toward the reversal or major resistance zone.
You can also call this the "retest and boom" line, as seen in your chart’s annotation.
6. 🧊 Demand Transferred (Mid-Zone Shift)
Shows where institutional demand entered and was then shifted upward to support the rally.
This is a powerful MMC concept — demand didn’t disappear, it just migrated up, forming new support levels.
7. 🔄 SR Interchange Zone (~$3,160 – $3,200)
Classic support/resistance flip zone.
If the trendline and mid-zone fail, price might drop here to collect liquidity and trigger new buy orders.
This is your “last stand” zone for bulls.
8. 🧱 Break of Structure (BOS) Confirmation
BOS already occurred earlier on the chart — this confirms bullish shift in structure.
Now, price is looking to retest the previous high or break it entirely.
🎯 Trade Scenarios
✅ Bullish Setup (Base Case):
Price continues to hold above the trending support.
Breaks mini reversal zone + Black Curve Resistance.
Retests the zone (validation).
Pushes toward the Major Resistance Zone ($3,470 – $3,520).
⚠️ Bearish Setup (If Rejected):
Price hits the curve and mini reversal zone and gets rejected hard.
Drops back to trending support, possibly breaks it.
Targets SR Interchange Zone (~$3,160 – $3,200) as the next buy zone.
💬 Mind / Trading Wisdom:
“Price doesn’t lie. It reacts. Let it show you the intention — breakout or rejection. Follow MMC structure, respect the curve resistance, and let price action guide your entries.”
📌 Summary for Traders:
Concepts Used: Mirror Market Concepts (MMC), Curve Resistance, SR Flip, Demand Transfer, BOS.
Current Price Action: Testing reversal zone + curve.
Bias: Bullish but cautiously watching for rejection.
Next Levels: Watch $3,400 – $3,520 for decision. Retest = entry. Rejection = liquidity hunt.

BTCUSD | IntradayAlthough we have a buy direction on the daily time frame, there is a small correction in it, and we can try to take advantage of its movement!
Feel free to discuss

XAU/USD Outlook: Will Gold Open with a Bullish Gap?XAU/USD Outlook: Will Gold Open with a Bullish Gap?
Date Range: 26th – 30th May 2025
Timeframe: H4 (4-hour chart)
Market Bias: Short-term bullish
🔍 Fundamental Analysis
US–China Trade Tensions:
China halting imports of US goods puts pressure on the dollar (gold tends to move inversely).
Escalating tensions support gold as a safe-haven asset.
Tariff Threats to the EU:
Trump proposes 50% tariffs on EU products → potential retaliatory measures raise global uncertainty.
Risk-averse sentiment may push capital into gold.
Physical Gold Demand:
High seasonal demand from India and China ahead of festivals.
Inflation fears globally increase gold's appeal.
🌍 Macro Overview
Monetary Policy:
The Fed may face pressure to cut rates if trade tensions weaken the economy → bearish for USD, bullish for gold.
PBOC could devalue the yuan in response to trade friction, boosting gold prices in USD terms.
Market Sentiment:
A potential rise in the VIX (fear index) may drive investors towards safe havens like gold.
Strong demand for physical gold and ETFs, particularly in Asia, continues to support price.
Key Events This Week:
US Core PCE (inflation indicator)
US Consumer Confidence
EU and China responses to recent US trade policy
📊 Technical Analysis (H4)
Trend: Clear ascending channel
Current Price: 3,407.554
Key Resistance Levels:
3,407 – 3,444 (major resistance zone)
3,444.436 = potential all-time high
Support Zones:
3,361.648 (channel midpoint)
3,325.347 (lower channel boundary)
Fair Value Gaps (FVG):
FVG 1: 3,361 – 3,407
FVG 2: 3,325 – 3,340
Price Action Note:
A doji candle near resistance suggests a possible short-term pullback before continuation
🔄 Possible Scenarios
🔼 Bullish Scenario (60% probability):
Break above 3,444 with momentum could trigger a bullish gap and extend toward 3,500
Strong fundamental and technical support for upside
🔽 Bearish Scenario:
Rejection from 3,444 may lead to a pullback toward 3,361 or even 3,325 for buy setups
💡 Trade Plan
✅ Long Setup:
Entry: 3,361 – 3,370 (pullback into FVG or mid-channel support)
Take Profit: 3,444 (TP1), 3,500 (TP2)
Stop Loss: Below 3,325
❌ Short Setup (only on confirmed rejection):
Entry: On clear rejection at 3,444 (e.g. bearish engulfing or head & shoulders pattern)
Take Profit: 3,361
Stop Loss: Above 3,444
⏰ Optimal Trading Times
Monitor market open (Sunday, 26th May) for confirmation of a potential bullish gap
Best liquidity during London and New York sessions
📝 Summary:
Gold is well-positioned for a bullish move amid escalating trade tensions and USD weakness.
Watch closely for a breakout above 3,444 or a retracement to 3,361 as a strategic buy zone.
Stay updated on US inflation data and trade policy developments to adjust accordingly.

SILVER 1DA possible scenario for silver on the daily timeframe involves buying from the levels of 30.90-31.00 with further targets at 33.02, 34.8291 and the expected completion of the rounding pattern with a subsequent movement to the zone 40.0251
Everything is clearly depicted on the graph!
Have a good day!

EURUSD Direction | Daily Timeframe OutlookThese are the points we can take from the daily time frame :
1.EURUSD has broken through quite strong resistance, and we have not seen any wicks on any time frame, this indicates that EURUSD is still strong for buying
2.After finishing its uptrend, Eurusd fell to the weekly support that I marked,
3.After completing the correction phase, this week there was a fairly strong closing in the market structure shift (MSS) area
4.The conclusion is, eurusd will continue its upward trend, this is useful for daily traders as a direction to determine which trading positions are profitable

Bitcoin Daily Timeframe TargetAs we can see at Daily Timeframe :
1. As we have learned about market structure, bitcoin has finished its correction phase, and now in daily view, as the initial target bitcoin will touch the level that I have determined
2.Daily view will lead us to buy trade direction, this means the probability of buy is greater than sell, whoever takes sell trade will be eaten by whales

TradeCityPro | CFXUSDT A Wild Week of Volatility Ahead?👋 Welcome to TradeCityPro Channel!
Let’s dive in and analyze another altcoin in the market, CFX, which is likely to experience a highly volatile week ahead, offering great trading opportunities.
🌐 Overview Bitcoin
Before starting the analysis, I want to remind you again that we moved the Bitcoin analysis section from the analysis section to a separate analysis at your request, so that we can discuss the status of Bitcoin in more detail every day and analyze its charts and dominances together.
This is the general analysis of Bitcoin dominance, which we promised you in the analysis to analyze separately and analyze it for you in longer time frames.
🕒 Weekly Time Frame
CFX stands out as an older coin with prior bull-run experience. It’s trading above last year’s lows and hasn’t experienced steep declines.
Yesterday, we analyzed this coin briefly, but today, we’ll go into more detail. Unlike most altcoins that began their bullish moves from their lowest levels, CFX has already started its upward trajectory from 0.1219.
Fibonacci analysis shows that 0.1219 aligns with the 50% retracement level—a significant support both in Fibonacci terms and Dow Theory. After forming a range around this level and breaking the 0.1810 trigger, the coin moved toward its first target at 0.2596.
However, we were rejected at 0.2596 and even lost the critical support at 0.1087, dropping to the next support at 0.0647. Currently, it appears we’re pulling back to the key 0.1087 level.
📊 Daily Time Frame
On the daily chart, CFX was in a ranging box, forming higher lows. A breakout above 0.1851 was accompanied by a strong entry candle with buyer momentum, an RSI entry signal, and volume confirmation. Stop-loss was set at the daily low of 0.14.
If you followed this trigger, you’re likely in profit despite the current red daily candle. This correction is healthy, as an uptrend without pullbacks or red candles is often unsustainable.
After breaking the daily box between 0.1046 and 0.1230 and losing its support with an engulfing candle, we experienced a downward move to 0.0647. From there, sellers effectively exited the market, and buyers showed strength. After breaking 0.0823, we formed higher highs and lows. Now, after breaking 0.1046, we can consider buying for spot, with the main trigger being a break of 0.1230.
✍️ Final Thoughts
Stay level headed, trade with precision, and let’s capitalize on the market’s top opportunities!
This is our analysis, not financial advice always do your own research.
What do you think? Share your ideas below and pass this along to friends! ❤️

EURAUD – Bullish Breakout from Inverse Head & Shoulders + Target🔍 Pattern Insight: Inverse Head & Shoulders – A Powerful Reversal Formation
On the weekly timeframe, EURAUD has completed and broken out of a textbook Inverse Head & Shoulders (IHS) pattern — a highly regarded bullish reversal setup that often signals the end of a downtrend and the beginning of a sustainable uptrend.
Let’s break it down:
Left Shoulder: Formed in mid-2021 after a strong downtrend, price found support and rebounded, forming the initial shoulder low.
Head: A lower low was established around early 2022, marking the deepest point of the pattern. This represents the last dominant push by sellers before exhaustion.
Right Shoulder: In late 2022 to early 2023, bulls stepped in earlier than before, establishing a higher low — a strong sign of decreasing bearish momentum and accumulation.
Neckline : A descending resistance trendline connecting the peaks between the shoulders and the head. Once broken, it confirms the IHS breakout and trend reversal.
This multi-year formation reflects a major psychological shift: sellers lost control at the head, and buyers gradually regained dominance at the right shoulder, eventually breaking resistance.
📉 Retest in Progress – High Probability Entry Zone
Post-breakout, price action has pulled back for a technical retest of the neckline and curve line support — a dynamic trendline representing growing bullish momentum. This retest is essential for validating the breakout and building the base for a continuation rally.
The convergence of support zones (neckline + curve line) around the 1.70–1.72 area provides a strong confluence zone where buyers may step in again. This is often viewed as a second-chance entry for traders who missed the breakout.
🎯 Measured Target Projection & Resistance Levels
The IHS pattern gives us a clear measured move:
Measured Move Target: Distance from the head to neckline (~2,800+ pips) projected from the breakout point.
Target Zone: 1.92 – 1.95, just above the major resistance zone.
Resistance Zone: 1.85 – 1.87 is a historically significant supply area and may act as interim resistance.
Break and close above the resistance zone would further validate the bullish trajectory and open the door for higher targets.
📌 Risk Management – Defined Parameters
To manage risk effectively, consider:
Stop Loss: Below the recent retest low and curve line support, ideally placed at 1.63848, protecting against a false breakout.
Entry Idea: If bullish confirmation (e.g., bullish engulfing candle, higher low on lower timeframe) appears at retest zone, initiate a long position.
Risk-to-Reward (RR): Targeting 1.92 from an entry around 1.72 offers a 4:1 RR or better — highly attractive for swing and position traders.
🧠 Psychological and Structural Significance
This pattern is not just technical — it represents behavioral change in the market:
The head shows capitulation — a final wave of bearish pressure.
The right shoulder indicates growing confidence in bulls and waning selling interest.
The neckline breakout is where sentiment flips — traders recognize the change and enter long positions, fueling the breakout.
The current retest phase is crucial. Many professional traders wait for this moment to confirm that support holds before fully committing.
🔎 Final Thoughts & Strategy
Trend has shifted bullish on the weekly chart after years of consolidation and decline.
We’re seeing a classic breakout–retest–continuation setup.
A breakout above 1.85 would likely trigger momentum traders and institutions, driving price swiftly toward the 1.92–1.95 range.
Invalidation: Break below 1.63848 would invalidate the pattern and shift sentiment back to neutral or bearish.
📈 Trade Plan Summary:
Pattern: Inverse Head & Shoulders (weekly)
Bias: Bullish
Entry Zone: 1.70 – 1.73 (retest area)
Target: 1.92+
Stop Loss: Below 1.63848
Risk Level: Medium (weekly setup, but long-term play)

XAUUSD Bullish Flag Breakout – $4,300 Target in SightGold (XAU/USD) continues its strong bullish momentum in 2025, and the current price structure reveals a classic bullish flag pattern on the daily chart, suggesting further upside. This setup presents a potential continuation of the prevailing uptrend, possibly leading to new all-time highs in the coming months.
🟢 1. Clear Bullish Trend Foundation
Gold has been in a strong uptrend since late 2024, supported by:
Global inflationary pressures.
Geopolitical instability.
Central bank gold purchases and dollar weakness.
This uptrend is visually supported by a well-defined rising structure, with higher highs and higher lows.
📐 2. Bullish Flag Pattern Formation
The current price action has formed a bullish flag, a bullish continuation pattern that appears after a sharp rally. The flag represents a period of consolidation or pullback before the next impulsive move up.
The flagpole is the sharp rally that took place from mid-February to April 2025.
The flag itself is a downward-sloping channel or wedge, indicating temporary profit-taking or market indecision.
Volume typically decreases during the flag formation, then surges on breakout—confirming trend continuation.
This pattern is now showing signs of a breakout to the upside, suggesting the bulls are regaining control.
🔍 3. Key Technical Levels
🔹 Major Resistance Zone (~3,500–3,600):
This zone has acted as a supply region in the past.
Price is now testing this level and attempting a breakout.
A successful retest of this zone as new support will confirm the breakout.
🎯 Projected Target: $4,300+
Measured move target based on the flagpole’s height.
Clean projection points to the 4,300–4,350 area as the next major upside objective.
🛑 Support & Stop-Loss :
Strong support exists around $3,125, aligning with the flag base.
This area is a logical stop-loss zone for traders entering on the breakout.
🔁 4. Expected Price Behavior
Breakout: Price is expected to break above the flag resistance and the horizontal supply zone.
Retest Phase: A pullback toward the breakout zone (~3,600) could occur before the next impulsive move. This would offer a prime buy-on-dip opportunity.
Final Impulse: A sharp rally could follow, targeting the 4,300+ region.
💡 5. Trading Psychology Behind the Setup
During the flag formation, short-term traders take profit, and new buyers hesitate due to perceived overbought conditions.
However, the overall market sentiment remains bullish, with larger players accumulating during dips.
Once the resistance breaks, fear of missing out (FOMO) often drives prices sharply higher.
⚠️ 6. Risk Factors to Watch
Sudden USD strength or rising real yields.
Geopolitical de-escalation that reduces safe-haven demand.
FOMC rate surprises or unexpected hawkish policy shifts.
✅ Conclusion: Bullish Breakout Setup in Play
Gold is poised for another leg up after completing a textbook bullish flag pattern. With macroeconomic tailwinds and a solid technical base, this setup offers a high-probability long opportunity targeting the $4,300 zone. Watch for a confirmed breakout and possible retest to load long positions with solid risk-reward.
