Nightly $SPY / $SPX Scenarios for July 2, 2025🔮 Nightly AMEX:SPY / SP:SPX Scenarios for July 2, 2025 🔮
🌍 Market-Moving News 🌍
🏭 U.S. Manufacturing Remains Under Pressure
The ISM Manufacturing PMI for June rose slightly to 49.0 from 48.5 in May—still in contraction territory. Tariff-induced uncertainty and rising input costs continue to weigh on factory activity, with new orders still weak and employment contracting
📈 Global Factory Rebound Led by India & Europe
While U.S. factories struggle, India hit a 14-month high in its manufacturing PMI at 58.4, and euro‑zone factory orders stabilized at 49.5—the first sign of recovery in over three years. Asia-Europe divergence may shift global capital flows .
🏦 Powell Says Tariffs Are Delaying Rate Cuts
Fed Chair Powell warned at the ECB forum in Sintra that elevated inflation—driven in part by Trump-era tariffs—has postponed the timeline for U.S. rate cuts. The Fed’s dot-plot now indicates only two cuts for 2025, with markets adjusting accordingly
💵 Dollar Nears 3½-Year Lows
The U.S. dollar weakened further, trading near a three-and-a-half-year low amid soft PMI data, a dovish Fed tilt, and renewed optimism over U.S.–Canada trade talks
📊 Key Data Releases & Events 📊
📅 Wednesday, July 2:
(No major scheduled U.S. economic data)
Market focus shifts to upcoming Nonfarm Payrolls on July 3, Powell's remarks, and trade-talk headlines.
⚠️ Disclaimer:
This information is for educational and informational purposes only and should not be construed as financial advice. Always consult a licensed financial advisor before making investment decisions.
📌 #trading #stockmarket #economy #manufacturing #Fed #inflation #charting #technicalanalysis
Technical Analysis

Gold Breakout and Potential RetraceHey Traders, in today's trading session we are monitoring XAUUSD for a buying opportunity around 3,330 zone, Gold was trading in a downtrend and successfully managed to break it out. Currently is in a correction phase in which it is approaching the retrace area at 3,330 support and resistance area.
Trade safe, Joe.

EURUSD Potential UpsidesHey Traders, in today's trading session we are monitoring EURUSD for a buying opportunity around 1.17600 zone, EURUSD is trading in an uptrend and currently is in a correction phase in which it is approaching the trend at 1.17600 support and resistance area.
Trade safe, Joe.

HUGE +979% day $4 to $46 on 100M shares traded $BMNR🚀 HUGE +979% day $4 to $46 BMNR on 100M shares traded 🤯
Shortsellers were trying all kinds of manipulations during the day but at the end got squeezed after hours
#stockmarket #stocktrading #trader #daytrading #chart #10X

AUDJPY: Bullish Move From Support 🇦🇺🇯🇵
There is a high chance that AUDJPY will bounce
from the underlined horizontal support.
The price formed a bullish imbalance candle after its test.
I expect a rise to 94.49 level.
❤️Please, support my work with like, thank you!❤️
I am part of Trade Nation's Influencer program and receive a monthly fee for using their TradingView charts in my analysis.

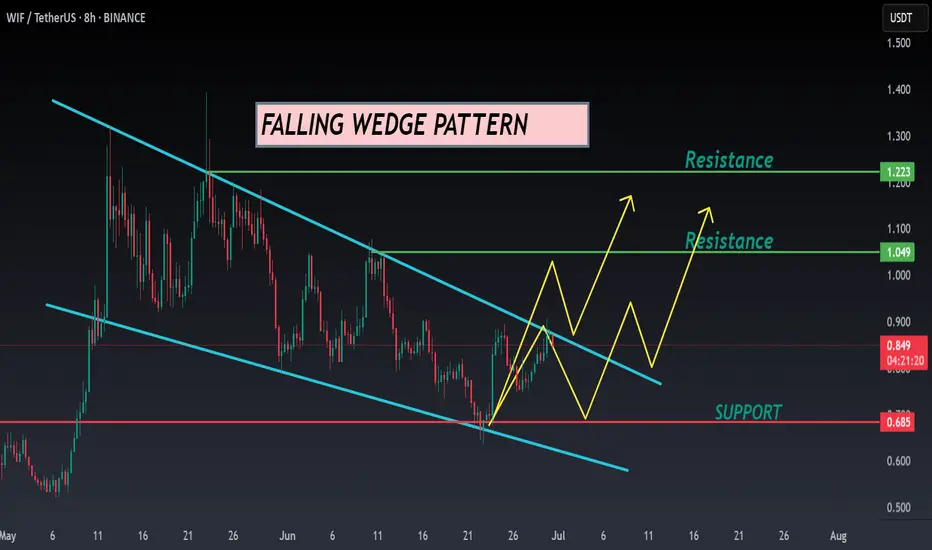
WIF ANALYSIS🔮 #WIF Analysis - Update 🚀🚀
💲 We can see that there is a formation of Falling Wedge Wedge Pattern in #WIF and we can see a bullish movement after a good breakout. Before that we would see a little retest and and then a bullish movement.
💸Current Price -- $0.848
📈Target Price -- $1.049
⁉️ What to do?
- We have marked crucial levels in the chart . We can trade according to the chart and make some profits. 🚀💸
#WIF #Cryptocurrency #Breakout #DYOR
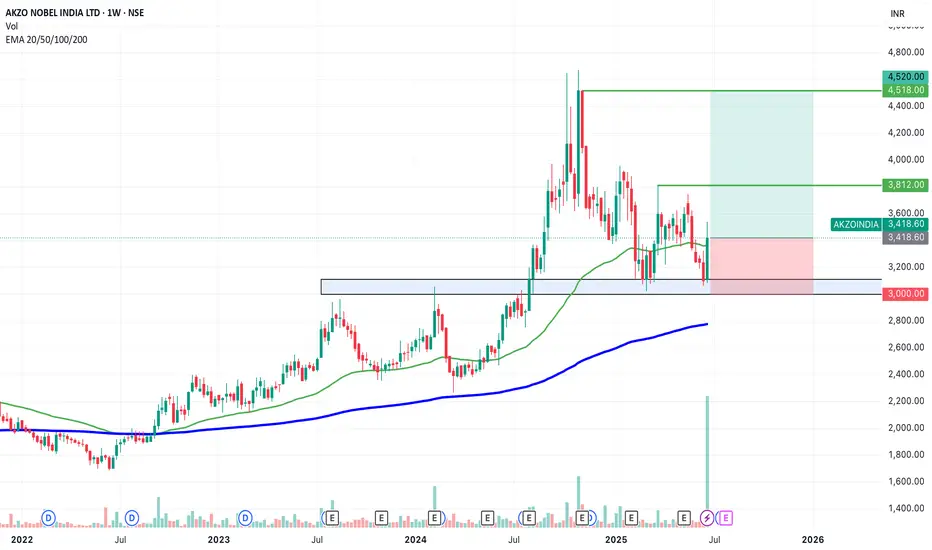
SWING IDEA - AKZO NOBEL INDIA Akzo Nobel India , a subsidiary of the global paints and coatings giant AkzoNobel N.V., is a leading player in India’s decorative and industrial paints market. Known for its premium brand Dulux , the company has strong brand recall, a wide distribution network, and consistent profitability.A strong brand, steady margins, and a bullish chart make this a candidate to watch for a short- to medium-term swing trade.
Reasons are listed below :
Bullish engulfing candle spotted on the weekly timeframe, signaling a potential trend reversal.
Accompanied by the highest-ever volume spike, adding strong conviction to the move.
Price is bouncing off the golden Fibonacci support (0.618), a classic retracement zone where strong reversals often occur.
The level of 3100 acted as a solid support.
The stock is trading above its 50 & 200 EMA on the weekly chart — a sign of long-term strength.
Target - 3812 // 4520
Stoploss - weekly close below 3000
DISCLAIMER -
Decisions to buy, sell, hold or trade in securities, commodities and other investments involve risk and are best made based on the advice of qualified financial professionals. Any trading in securities or other investments involves a risk of substantial losses. The practice of "Day Trading" involves particularly high risks and can cause you to lose substantial sums of money. Before undertaking any trading program, you should consult a qualified financial professional. Please consider carefully whether such trading is suitable for you in light of your financial condition and ability to bear financial risks. Under no circumstances shall we be liable for any loss or damage you or anyone else incurs as a result of any trading or investment activity that you or anyone else engages in based on any information or material you receive through TradingView or our services.
@visionary.growth.insights
Master the Trio => to Level Up Your Trading🧠Most traders obsess over chart patterns and price action—but lasting success comes from mastering three pillars together:
Technical Analysis. Risk Management. Trading Psychology.
Miss one, and the structure collapses.
Let’s dive into each one, and see how they work together like a high-performance trading engine:
📈 1. Technical Analysis – Think in Layers, Not Lines
Most traders draw lines. Great traders read behavior.
Instead of asking “Is this support holding?”, ask “Why would smart money defend this level?”
Markets aren’t driven by lines—they’re driven by liquidity, trapped traders, and imbalances. That’s why:
A fakeout isn’t failure—it’s often a feature.
A breakout isn’t a buy signal—it’s bait.
Trendlines aren’t magic—they’re just visualizations of collective bias.
🔍 Advanced tip: When analyzing a chart, map out:
Where liquidity is resting (above equal highs/lows, tight consolidations)
Who’s likely trapped (late buyers at resistance, early sellers during accumulation)
Where the market must not go if your bias is correct (invalidations)
The real edge? Seeing the chart as a battle of intentions, not just candles.
🛡️ 2. Risk Management – Your License to Play the Game
Every trade is a bet. But without proper risk, it’s a gamble.
Risk management isn’t just about stop losses—it’s about position sizing, asymmetry, and survival.
I risk no more than 1% per trade , regardless of conviction.
I aim for 2R minimum —because even with a 50% win rate, I still grow.
I define my invalidation before I enter, never after.
You can’t control the outcome, but you can control your exposure. That’s professional.
🧠 3. Trading Psychology – Where Most Traders Break
You can have the perfect setup and smart risk, but still sabotage yourself.
Why? Because emotion overrides logic —especially when money is on the line.
Ever moved your stop? Chased a candle? Closed a trade too early, only to see it hit your TP later?
That’s not lack of skill—it’s lack of emotional discipline.
What works for me:
Journaling every trade—not just the result, but how I felt
Practicing “sit tight” discipline after entries
Reminding myself that no single trade matters—only the process does
You don’t trade the chart—you trade your beliefs about the chart. Master yourself first.
🔄 Final Thoughts
Trading isn’t just about entries.
It’s a mental game played on financial charts, where edge lies in understanding market mechanics, protecting capital, and staying emotionally grounded.
TA shows you the “what”
Risk shows you the “how much”
Psychology decides the “how well”
Master all three—and you’ll separate yourself from 95% of traders.
💬 Which of the three is your strongest? And which one needs more work?
Let’s grow together—drop your thoughts in the comments 👇
All Strategies Are Good; If Managed Properly!
~Richard Nasr

AUDUSD: Bullish Continuation After Breakout 🇦🇺🇺🇸
AUDUSD is going to rise more following a bullish breakout
of a key daily/intraday horizontal resistance.
Next goal - 0.66
❤️Please, support my work with like, thank you!❤️
I am part of Trade Nation's Influencer program and receive a monthly fee for using their TradingView charts in my analysis.

XAUUSD Analysis – 01/07: Gold Sees a Rebound Amid USD WeaknessXAUUSD Analysis – 01/07: Gold Sees a Rebound Amid USD Weakness – Is a Recovery on the Cards?
As we enter the new month, gold prices are showing signs of recovery after a significant drop, primarily driven by the weakening of the US Dollar. However, despite some positive momentum, the path to sustained growth remains uncertain.
💵 USD Weakness Fuels Gold's Potential Rebound
Recent US economic data shows a slight decrease in consumer spending, which has led to speculation that the Federal Reserve may ease interest rate hikes in the near future.
This, in turn, has contributed to a weaker USD, providing an opportunity for gold to recover slightly.
⚖️ The Federal Reserve's Role Remains Critical
The markets are awaiting further clues on the Federal Reserve's next moves, especially with the ongoing debate about the potential direction of interest rates.
While the recent economic data isn't weak enough to force a policy reversal, it hasn't been strong enough to give the Fed the confidence to continue its hawkish stance either.
🧠 What Does This Mean for Traders?
Gold is responding to macroeconomic factors but still lacks a clear, strong trend.
Volatility remains high, with sharp price fluctuations occurring after key economic and political announcements. This uncertainty suggests gold might not yet have the momentum for a definitive break-out or trend reversal.
🔶 Summary:
Gold is starting to recover after a tough month but the outlook remains cautious.
Buyers are hoping for a Fed rate cut, while sellers are banking on the USD's strength.
Traders should stay vigilant, waiting for clear confirmation before making major moves.
📊 Key Levels to Watch:
Resistance Levels: 3358 – 3360 – 3364 – 3375 – 3380
Support Levels: 3300 – 3290 – 3280 – 3275
🎯 Trading Strategy:
🔵 Buy Zone:
Entry: 3310 – 3315
SL: 3300
TP: 3320 – 3330 – 3340 – 3350 – 3360
🔴 Sell Zone:
Entry: 3370 – 3375
SL: 3380
TP: 3360 – 3350 – 3340 – 3325
⚠️ Final Thoughts:
With USD weakness persisting, gold may continue its rebound, but the market remains uncertain.
Keep an eye on macroeconomic data and geopolitical events, as they will likely shape gold's next move.

EURGBP: Strong Bullish Confirmation 🇪🇺🇬🇧
EURGBP is going to continue rising in an uptrend
that the pair established at the end of May.
A completion of a consolidation and a formation of a new local Higher High
indicate a highly probable bullish continuation soon.
Next resistance - 0.8605
❤️Please, support my work with like, thank you!❤️
I am part of Trade Nation's Influencer program and receive a monthly fee for using their TradingView charts in my analysis.

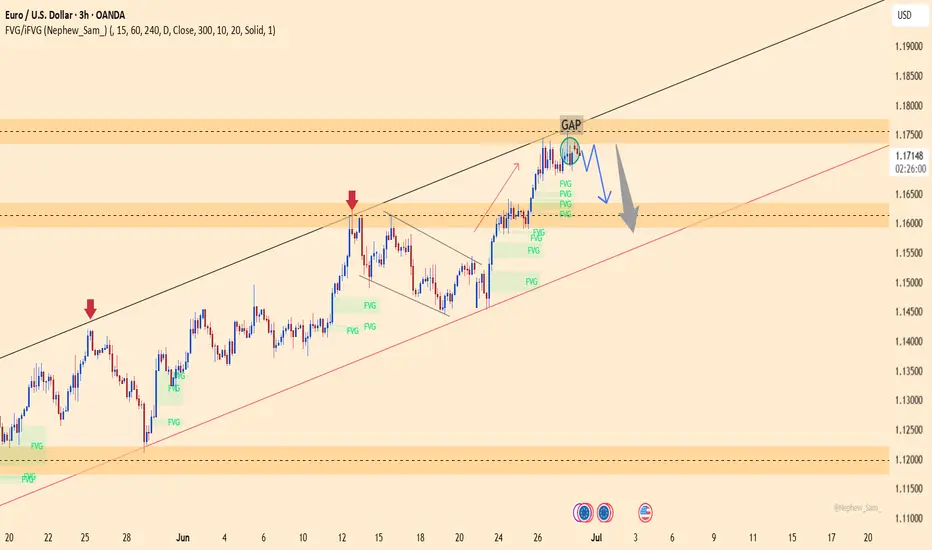
EURUSD – Bearish Pressure IntensifiesEURUSD is currently facing rejection at the GAP resistance area near 1.17350, combined with a lower high structure forming within the ascending channel. Price action shows clear signs of weakness after filling the GAP, and the aligned FVG zones below suggest a potential for deeper downside.
If the price remains capped below 1.17350, there is a high probability of a pullback toward the 1.16300 support area — which aligns with the long-term ascending trendline. A break below this level could extend the bearish move toward the deeper region near 1.14500.
Supporting Fundamentals:
Strong US Core PCE → reinforces expectations that the Fed will keep rates higher for longer.
Weak EU manufacturing PMI → puts pressure on the euro.
FOMC minutes and NFP — if hawkish — could strengthen the USD and weigh further on EURUSD.
XAUUSD 15min – Bearish Setup | Short Trade Plan Below 3328Price action on Gold (XAUUSD) is showing signs of exhaustion near the 3,328 resistance zone, where we anticipate potential bearish rejection. A short opportunity may unfold once confirmation occurs below the key structural level of 3316.
Sell Trade Setup:
🔹 Primary Entry (Sell Entry 1):
📍 Zone: Around 3,328.29
📌 Reaction expected near major supply & resistance zone.
🔹 Confirmation Entry (Sell Entry 2):
📍 Below 3,316
📌 Break below structure may trigger bearish momentum.
Targets:
🎯 TP 1: 3,296.97 (Initial reaction zone)
🎯 TP 2: 3,276.64 (Mid support/EMA cross zone)
🎯 TP 3: 3,259.88 (Key structural support)
🎯 Extended TP:
3,243.94 (Re-entry confirmation level)
3,225.53 (Prior base structure)
3,202.45 (Final target if strong momentum follows)
3,159.31 (Ultimate low if sellers dominate trend)
Re-Entry Plan:
🔄 If price retraces after TP 3, watch for rejection at 3,243.94 to re-enter short toward the next levels.
Confluence Factors:
✔ 45° TPC angle supports bearish path
✔ Structure break expected below 3316
✔ EMA resistance and trendline rejection from upper zone
✔ Volatility cluster observed near 3,328 – ideal for trap setup
Bias:
Bearish below 3,316 – Expecting a downward continuation if structure confirms breakdown.
Author:
📅 1 July 2025
📊 Chart: XAUUSD – 15min
🧠 Shared by: @THEPATELCRYPTO

[INTRADAY] #BANKNIFTY PE & CE Levels(01/07/2025)Bank Nifty is expected to open slightly gap up near the 57,450 level, which lies close to an important resistance zone. If the index manages to sustain above this level, a further upside movement may be seen toward 57,750, 57,850, and 57,950. Strength above 57,500 could indicate bullish momentum continuation and may attract fresh buying interest.
On the flip side, if Bank Nifty fails to hold above the 57,450–57,400 zone and shows signs of reversal, a decline toward 57,250, 57,150, and 57,050 is possible. A breakdown below 56,950 will likely trigger further downside levels toward 56,750, 56,650, and 56,550. It is advised to observe price action around the 57,450–57,500 level for directional clarity in today’s session.

XAUUSD – Technical pullback before a breakout?On the 4H chart, gold is consolidating just below the descending trendline after a correction from $3,389 to the support zone at $3,252. The current price structure suggests continued range-bound movement between $3,252 and $3,318 before a potential breakout. If price breaks above the trendline, the next target could be the resistance zone at $3,389.
From a news perspective, the easing of Iran–Israel tensions has slightly reduced safe-haven demand, putting short-term pressure on gold. However, the US dollar remains at a 3-year low, and concerns over the US government’s $3.3–3.9 trillion tax reform package are fueling fears of a widening deficit—both of which support a bullish outlook for gold.
In summary, watch how price reacts to the trendline. A confirmed breakout could send gold surging toward the $3,389 zone.

Nightly $SPY / $SPX Scenarios for July 1, 2025 🔮 Nightly AMEX:SPY / SP:SPX Scenarios for July 1, 2025 🔮
🌍 Market-Moving News 🌍
📊 Core Inflation Edges Higher
May’s core inflation rose unexpectedly to 2.7% year-over-year, up from 2.6%, casting uncertainty over the Fed’s timeline for rate cuts. While headline CPI sits at 2.3%, the resilience in underlying prices complicates policymakers’ projections for later this year
💵 Weak Dollar, Rising Rate-Cut Bets
Markets are reacting to “summertime data”—like the core CPI uptick—with renewed optimism. Traders now see up to 75 bps in Fed rate cuts later this year, while the dollar remains near 3½-year lows on concerns about Powell’s independence and trade developments
🇨🇦 U.S.–Canada Trade Talks Resume
Trade talks between the U.S. and Canada restarted today, following Ottawa’s suspension of its digital-services tax. Progress toward a broader agreement could reduce tariff risk and offer further relief to risk assets
📊 Key Data Releases & Events 📊
📅 Tuesday, July 1:
All Day – U.S.–Canada Trade Talks
Markets will watch for updates on tariff resolution and broader trade deals. Any breakthrough could notably boost equities and improve trade sentiment.
10:00 AM ET – ISM Manufacturing PMI (June)
A below-50 reading again would reinforce the narrative of industrial weakness. A rebound could support equities and temper recession concerns
10:00 AM ET – JOLTS Job Openings (May)
Still at elevated levels (~7.39 million in April), this metric assesses labor-market resilience. A decline could shift rate-cut expectations.
⚠️ Disclaimer:
This is for educational and informational purposes only. It does not constitute financial advice. Consult a licensed financial advisor before investing.
📌 #trading #stockmarket #economy #news #trendtao #charting #technicalanalysis

Gold Bounces Off Trendline as Bulls Defend Structure Ahead of $3Gold (XAU/USD) has rebounded sharply from its rising trendline support and 50-day SMA (around $3,221), suggesting that the broader bullish trend remains intact despite recent consolidation below the $3,430 resistance.
The uptrend from the December 2024 lows continues to hold, anchored by a sequence of higher lows and a clear ascending trendline. The recent dip toward the trendline was met with firm buying, resulting in a strong bullish candle on the daily chart. Price action now sets up a potential retest of the $3,430 horizontal resistance — a key level that has capped multiple rallies over the past few months.
Momentum indicators paint a mixed but improving picture. The RSI has bounced from just below 40 to 46.64, avoiding oversold territory and hinting at a potential momentum recovery. Meanwhile, the MACD remains in negative territory but is beginning to flatten, signaling a possible shift in short-term momentum.
A confirmed breakout above $3,430 would mark a resumption of the broader bullish leg and expose gold to new highs. However, a breakdown below trendline support would invalidate the current structure and shift focus toward the 200-day SMA near $2,924.
For now, the trendline bounce gives bulls the upper hand, keeping the upside scenario in play.
-MW

AUD/USD Approaches Key Resistance with Bullish Momentum IntactAUD/USD has extended its steady climb and is now challenging the 61.8% Fibonacci retracement level (0.6558) from the July–October 2023 decline. The pair is trading within a rising channel structure and has cleared both the 50-day (0.6457) and 200-day (0.6422) SMAs, confirming a medium-term bullish shift.
Price action remains constructive, with higher lows and rising support from the channel base suggesting consistent demand. A sustained break above the 0.6558 level could open the door toward the 78.6% Fib retracement at 0.6730, a level that also aligns with prior resistance from September 2023.
Momentum indicators support the advance. The RSI is at 61.77 and rising, but still comfortably below overbought levels, implying room for further upside. The MACD is marginally positive and could accelerate higher if price confirms a breakout above the 61.8% Fib barrier.
Traders will be watching whether the pair can hold above the confluence of the SMAs and the lower trendline of the channel. A failure here could expose downside toward 0.6420–0.6450. Otherwise, the bullish structure remains intact, with scope for a continuation higher into July.
-MW

EUR/USD Breakout Eyes 1.18 as Bullish Momentum BuildsEUR/USD has punched through the 78.6% Fibonacci retracement level (1.1744) of the July 2023–October 2023 decline, signaling strong bullish continuation. The breakout above the recent swing high near 1.1576 confirms the uptrend is gaining traction, supported by rising moving averages.
The 50-day SMA has crossed well above the 200-day SMA, maintaining a strong golden cross structure, reinforcing the bullish bias. Momentum indicators support the advance, with the RSI entering overbought territory at 73.79, and the MACD maintaining a positive spread above the signal line — a classic sign of trend strength rather than imminent reversal.
However, the overbought RSI suggests the pair could face some short-term consolidation or a shallow pullback before targeting the psychological 1.18 handle. Bulls would likely view any dip toward the breakout level (1.1576) as a potential buying opportunity.
As long as EUR/USD holds above that support, the path of least resistance remains to the upside, potentially paving the way for a full retracement toward the 1.19–1.20 zone seen last year.
-MW

EUR/AUD Falling Channel Reversal SetupThe EUR/AUD pair is currently trading inside a well-respected falling channel structure on the 15-minute timeframe. Price action has been bouncing between a descending resistance trendline and a sloping support zone, confirming the integrity of the pattern. The pair recently rebounded from the lower boundary of the channel, indicating potential short-term bullish momentum ahead.
This setup highlights a typical channel reversal bounce, offering a high-probability trading opportunity if the pair maintains upward pressure.
📈 Bullish Scenario – Intraday Channel Rebound
The price has touched the support line near 1.7885 and is now climbing higher.
Based on previous cycles, price tends to move from support to resistance within this channel.
A bounce from this level may lead to a move toward the upper channel resistance zone around 1.7960–1.7970.
The blue arrows illustrate the expected zig-zag movement within the channel.
📉 Bearish Scenario – If Support Fails
If the price breaks below 1.7880, it would indicate a channel breakdown, invalidating the bullish setup.
Such a move could lead to fresh downside targets near 1.7850 or lower, continuing the micro downtrend.
🎯 Intraday Trade Plan
Buy Setup (Reversal Play):
Entry: 1.7895–1.7905 (after candle confirmation on support)
SL: Below 1.7875
TP: 1.7950–1.7970 (channel top)
Sell Setup (on rejection or breakdown):
Entry: Near 1.7960 resistance or breakdown below 1.7880
SL: Above 1.7980
TP: 1.7850 and below
🧭 Technical Outlook Summary
Pattern: Falling Channel
Bias: Short-term bullish (reversal from support)
Key Zones: 1.7885 support | 1.7960 resistance
Watch for breakout beyond channel for directional confirmation
=================================================================
Disclosure: I am part of Trade Nation's Influencer program and receive a monthly fee for using their TradingView charts in my analysis.
=================================================================

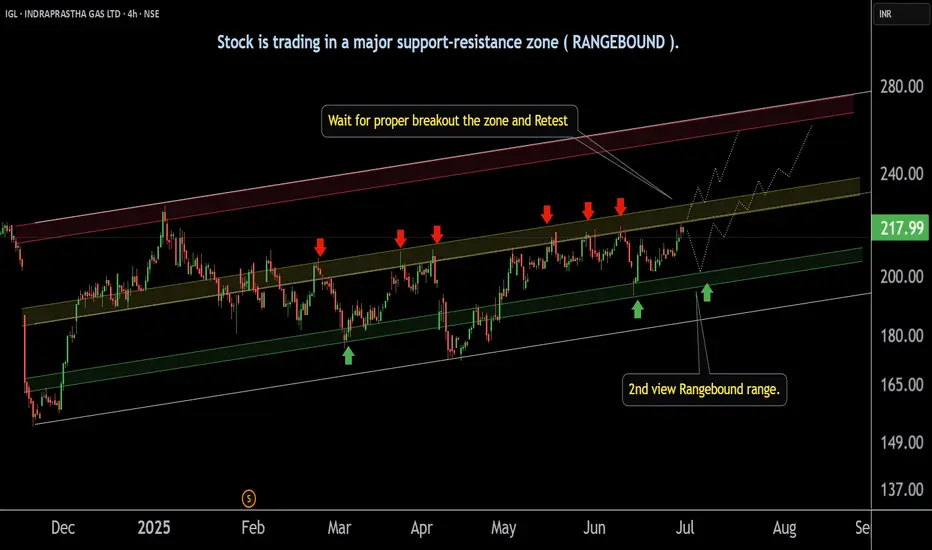
INDRAPRASTHA GAS ' s Support zone | Breakout level |This is the 4 hour chart of INDRAPRASTHA GAS .
IGL is moving in a well defined parallel channel with support range near at 195-200 level.
Igl having good law of polarity at 230 range if Igl give breakout this level and sustain above this level next resistance is near 260 and 280 .
Thank you !!
Apple Consolidates Above $200 with Upside PotentialAAPL is trading sideways, consolidating above $200.0.
Resistance stands at $203.0, and if breached, Apple could rally toward $206.0.

NZDJPY Potential UpsidesHey Traders, in today's trading session we are monitoring NZDJPY for a buying opportunity around 87.250 zone, NZDJPY is trading in an uptrend and currently is in a correction phase in which it is approaching the trend at 87.250 support and resistance area.
Trade safe, Joe.

NZDCAD Potential UpsidesHey Traders, in today's trading session we are monitoring NZDCAD for a buying opportunity around 0.82700 zone, NZDCAD is trading in an uptrend and currently is in a correction phase in which it is approaching the trend at 0.82700 support and resistance area.
Trade safe, Joe.
