EURCAD Bearish Breakdown – More Downside Potential Ahead?# EURCAD Bearish Breakdown – More Downside Potential Ahead?
**Analysis:**
EURCAD has broken below a key support level at **1.5710**, which previously acted as a consolidation base. This breakdown could signal the start of a deeper bearish move.
The market structure is clearly shifting to the downside, with **lower highs and lower lows** forming. If bearish momentum continues, the price could drop toward the psychological zones around **1.5000** and potentially **1.4500**.
---
**Key Technical Highlights:**
- **Breakdown level:** 1.5710 (former support)
- **Structure:** Bearish
- **Target zone:** 1.5000 – 1.4500
- **Invalidation:** Bullish recovery above 1.5710
---
**Trade Idea (Not Financial Advice):**
Watch for retests below 1.5710 to confirm bearish continuation. Short positions may be considered with proper risk management.
---
> **Disclaimer:**
> This analysis is for educational and informational purposes only and does not constitute financial advice. Always do your own research before making trading decisions. Trading involves risk, and past performance is not indicative of future results.
Technical Analysis

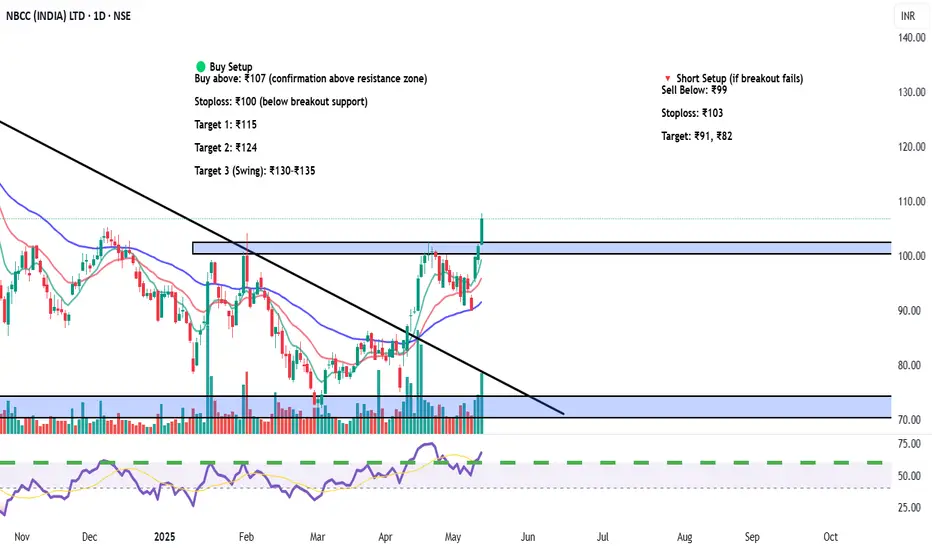
NBCC (India) Ltd (NSE: NBCC) – Breakout Trade Setup🧾 Equity Research Summary – NBCC (India) Ltd.
Sector: Construction & Infrastructure – Government PSU
Technical Setup: Trendline breakout + Base retest + Volume surge
Support Zone: ₹68–₹75
Breakout Zone: ₹100–₹103
Upside Potential: Strong move expected due to order book + infra push
Catalyst:
Government infrastructure spending
Order wins from CPWD, NBCC contracts, redevelopment projects
📅 Timeframe: Short-to-Medium Term (2–4 weeks)
📊 Risk-Reward: 1:2.5
🟢 Buy Setup
Buy above: ₹107 (confirmation above resistance zone)
Stoploss: ₹100 (below breakout support)
Target 1: ₹115
Target 2: ₹124
Target 3 (Swing): ₹130–₹135
🔻 Short Setup (if breakout fails)
Sell Below: ₹99
Stoploss: ₹103
Target: ₹91, ₹82
For Education Purposes Only
Gold Faces Strong Sell-Off: Is a Reversal on the Horizon? Gold Faces Strong Sell-Off After Initial Bounce – Is a Reversal Looming?
Gold opened the day with a slight uptick, only to be quickly slammed down, reflecting the current weakness in buying power. The market is reacting to news in flashes, quickly reversing direction — slow on the way up, but fast on the way down. This is the perfect reflection of a market losing confidence in any recovery trend.
🧐 Is This a Sign That Gold Is Heading Towards a Strong Reversal Zone?
📌 Support Zones to Monitor:
3222 – 3220: Short-term cushion. If this fails, expect further downward pressure.
3206 (M30): Next level of defense where technical reactions may occur.
⏳ Caution: Early European session tends to show strong volatility. If no clear signs of a bounce, be cautious of sudden sharp drops.
As for the trade negotiations, the developments around tariffs have been much more positive recently. Most news points toward further downside pressure on Gold, and it seems to be staying in the downward price channel. The price zones are not much different from yesterday’s levels, so I’ll slightly adjust my entries for today.
Watch the Resistance Levels: They are key for shorting opportunities. The BUY setup still seems far off; it’s hard to pick a good entry with resistance zones appearing everywhere right now. Don't rush into BUY positions just yet!
📊 Key Resistance Levels:
3244 – 3262 – 3278 – 3290 – 3308 – 3330
📊 Key Support Levels:
3216 – 3206 – 3194 – 3170 – 3158
🎯 Scalping BUY Zones:
BUY SCALP: 3196 – 3194
SL: 3190
TP: 3200 – 3204 – 3208 – 3212 – 3216 – 3220
BUY ZONE: 3158 – 3156
SL: 3152
TP: 3162 – 3166 – 3170 – 3174 – 3178 – 3182 – 3190
🎯 Scalping SELL Zones:
SELL SCALP: 3257 – 3259
SL: 3263
TP: 3253 – 3250 – 3246 – 3242 – 3238 – 3235 – 3230 – 3220
SELL ZONE: 3278 – 3280
SL: 3284
TP: 3274 – 3270 – 3266 – 3262 – 3258 – 3254 – 3250 – 3240 – 3230
🔎 Key Insights:
The market is moving in a tight range, but gold continues to hold below significant resistance. As the geopolitical situation stabilizes and tariff talks improve, any sudden price reversals will be important to monitor. The FOMC meeting and global developments will play key roles in shaping the future trend for gold.
💡 Conclusion:
Gold is facing a strong sell-off after testing key resistance. Focus on shorting at key resistance zones and be cautious with any buys until a clearer upward trend forms. Stay disciplined, watch the support levels carefully, and manage your trades well!

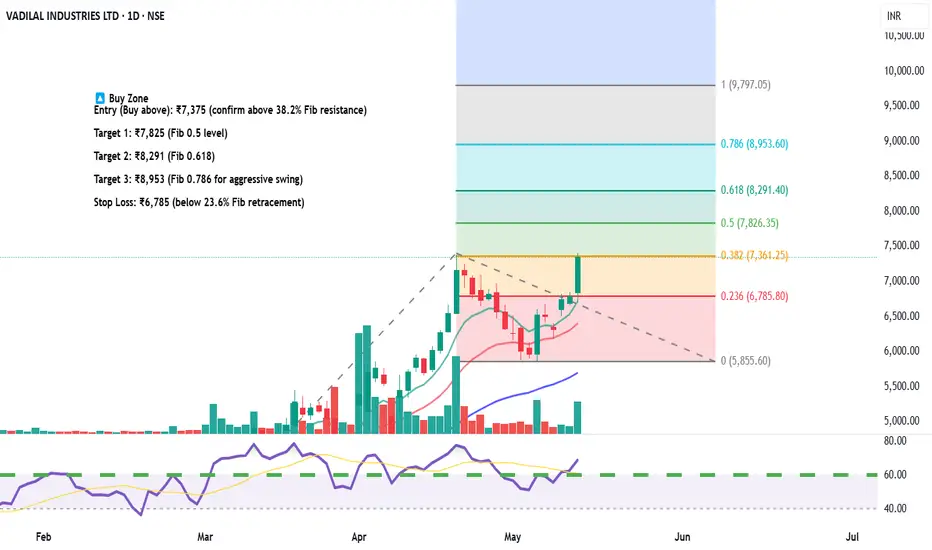
Vadilal Industries – Equity Trade Setup & Research View🟢 Long Trade Setup (Bullish Reversal Play)
Current Price: ₹7,346.50
Fibonacci Level Tested: 38.2% at ₹7,361 — a crucial breakout level
Trendline Breakout: Price has broken above falling trendline with volume confirmation
RSI: Near 60 – bullish momentum building
🔼 Buy Zone
Entry (Buy above): ₹7,375 (confirm above 38.2% Fib resistance)
Target 1: ₹7,825 (Fib 0.5 level)
Target 2: ₹8,291 (Fib 0.618)
Target 3: ₹8,953 (Fib 0.786 for aggressive swing)
Stop Loss: ₹6,785 (below 23.6% Fib retracement)
🔻 Short Trade Setup (if rejection happens)
Sell Below: ₹7,200
Target: ₹6,785
Stoploss: ₹7,375
📅 Timeframe: Daily (1D)
📊 Risk/Reward Ratio: 1:2.5+
🔁 Valid for: Next 2–4 weeks
For Education Purposes Only
BTC Bullish Pennant Breakout – Eyeing $107K TargetBitcoin (BTC/USD) has recently demonstrated strong bullish structure following an extended consolidation phase. The current price action suggests a textbook bullish pennant breakout, which often indicates trend continuation in strong markets. This technical setup follows a period of accumulation and consolidation between March and April, with a well-defined pennant formation leading into the breakout in early May.
Technical Analysis:
Historical Context & Structure:
From mid-February to March, BTC experienced significant downward pressure, eventually finding major support in the $76,000–$78,000 zone, which is clearly outlined on the chart as a key support level.
This support zone initiated a reversal, forming the base of a new bullish leg that marked the beginning of the next trending phase.
Consolidation Phase – The Ellipse Region:
The price action within the elliptical region (mid-March to late April) reflects accumulation behavior, with multiple rejections on both upper and lower bounds, indicating balance between buyers and sellers.
This phase formed a foundational structure, setting up the stage for a breakout pattern.
Pennant Formation (Late April – Early May):
The price sharply rallied in late April, breaking out of the consolidation and moving into a tight triangular pennant pattern — a classic continuation formation.
This bullish pennant features converging trendlines, lower volume, and diminishing volatility as price consolidates — all typical characteristics.
Breakout and Retest:
The breakout from the pennant occurred on high momentum with strong bullish candles.
Post-breakout, the price approached the resistance zone (~$103,000–$105,000) and is currently attempting to establish support at this level.
This retest adds validity to the breakout and opens the door for further upside continuation.
Trade Parameters:
Entry Zone: Breakout above the pennant (~$99,000–$100,000), confirmed by momentum.
Resistance Zone: $103,000–$105,000 (currently being retested).
Target (Measured Move):
Using the height of the pennant pole (~$20,000 move from $80K to $100K), the projected target lies near $107,307, aligning with horizontal resistance.
Stop Loss:
Set at $93,344, just below the pennant’s lower boundary. This level also aligns with recent structural support and invalidation of the pattern.
Risk/Reward Ratio:
Approx. 1:2.5+, offering a favorable setup assuming trend continuation.
Additional Notes:
Volume:
Although not shown, breakouts from pennants are ideally confirmed by an increase in volume, indicating market conviction. Volume confirmation is highly recommended for trade confirmation.
Market Context:
This setup aligns with broader bullish sentiment in the crypto space and may be reinforced by macroeconomic or ETF-related developments. However, risk management remains key, especially around psychological levels and news-driven volatility.
Conclusion :
Bitcoin is currently in a strong technical position. The breakout from the bullish pennant pattern following prolonged consolidation signals continuation of the prevailing uptrend. Traders should watch for sustained price action above $103K for confirmation. A pullback or retest toward this level can present re-entry opportunities before a potential move toward $107K. Tight risk management is advised with stops below $93K.

XAUUSD Bearish Pennant Breakdown | Retest in Play – 3090 TargetGold (XAUUSD) has been in a corrective phase after reaching the resistance zone around 3370–3420 USD, where the price was previously rejected with strong selling pressure. Over the past sessions, price action has developed into a Bearish Pennant pattern, typically seen as a continuation pattern in a downtrend.
Following a sharp drop from the highs, the price consolidated between converging trendlines, creating lower highs and higher lows. This structure resembles a pennant or triangle formation, which traders often interpret as a pause before the next leg down.
🔍 Key Technical Features:
1. Resistance Zone (3370–3420 USD):
Strong institutional selling observed here.
Multiple rejections confirm this zone as a significant supply area.
This area also serves as a risk management reference point for stop-loss placement.
2. Support Zone (3210–3230 USD):
The price bounced multiple times from this level, making it a key demand area.
A clean break below this zone would confirm bearish continuation.
3. Trendline Resistance:
A descending trendline has been respected consistently since May 8.
Price recently retested this trendline after a minor pullback, aligning with the bearish pennant structure.
4. Bearish Pennant Pattern:
Forms after a strong downward impulse.
The consolidation is narrowing within converging trendlines.
A breakdown with high volume typically leads to a continuation of the prior trend.
5. Breakout & Retest:
Price has already broken below the pennant's lower boundary.
The current move is a retest of the broken trendline—a classic setup for entering a short position upon rejection.
🎯 Bearish Target Projection:
The measured move from the pole of the pennant suggests a target around 3090 USD.
This level is derived by taking the height of the initial drop before the pennant and projecting it downward from the breakout point.
🛑 Stop Loss Strategy:
A conservative stop loss can be placed just above the 3370 USD resistance zone.
Alternatively, a tighter stop could be placed slightly above the trendline (~3240–3250) for aggressive entries, though this increases the risk of a false breakout.
✅ Trading Plan Summary:
Aspect Level / Detail
Entry Zone After retest & rejection (near 3230–3240 USD)
Target 3090 USD
Stop Loss Above 3370 USD
Risk-Reward Approx. 1:3 or higher
Pattern Type Bearish Pennant
🧠 Final Thoughts:
This is a textbook bearish continuation setup with strong confluences:
Trendline resistance
Bearish pennant formation
Breakdown with retest
Clear resistance and support zones for managing risk
If momentum sustains to the downside after the retest, we could see a swift drop toward 3090 USD, offering a favorable shorting opportunity for swing and intraday traders alike.
Always confirm with volume and candlestick confirmation before execution. Stay updated with fundamental drivers such as CPI, PPI, or FOMC comments, which can inject volatility.

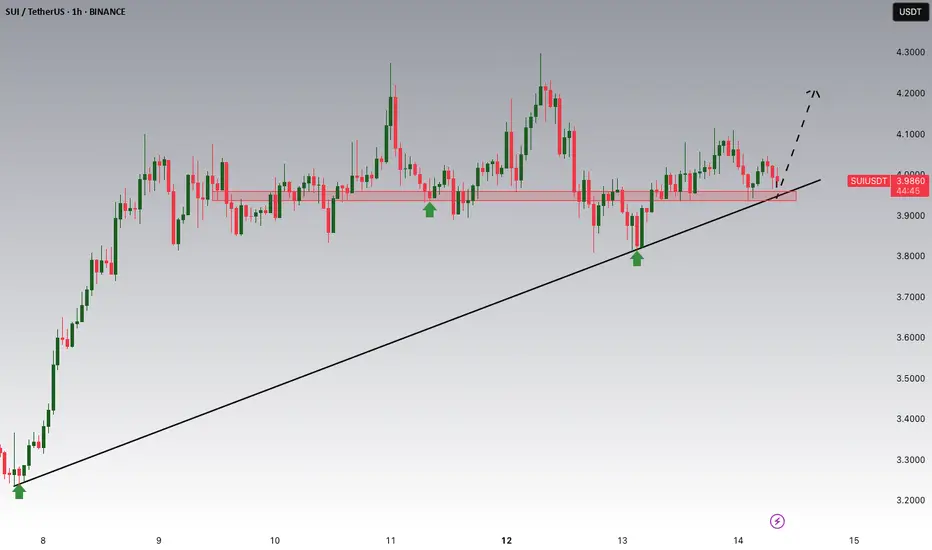
SUI/USDT Potential UpsidesHey Traders, in today's trading session we are monitoring SUI/USDT for a buying opportunity around 3.94 zone, SUI/USDT is trading in an uptrend and currently is in a correction phase in which it is approaching the trend at 3.94 support and resistance area.
Trade safe, Joe.
LTC/USD Tests Critical Resistance LevelFenzoFx—Litecoin is testing the supply zone, highlighted in the 1-hour chart. The primary trend is bullish, as the price is above the 50-period simple moving average.
However, the price action techniques show that sellers exist in the resistance area, which expands from \$105.0 to \$107.0. Therefore, going long is risky at this price, since it is expensive.
That said, if the immediate resistance at \$107.0 holds, LTC/USD will likely dip toward \$100.0, aligning with yesterday's low.

GBPJPY: Important Breakout 🇬🇧🇯🇵
GBPJPY successfully violated and closed above a major
daily resistance cluster.
It opens a potential for more growth now.
Next resistance - 197.3
❤️Please, support my work with like, thank you!❤️
I am part of Trade Nation's Influencer program and receive a monthly fee for using their TradingView charts in my analysis.

AUDUSD: Bullish Move After Breakout 🇦🇺🇺🇸
AUDUSD broke and closed above a key horizontal resistance yesterday.
Retesting the broken structure, the price formed a tiny ascending
triangle pattern on an hourly time frame.
I expect a bullish continuation now.
Goal - 0.6492
❤️Please, support my work with like, thank you!❤️
I am part of Trade Nation's Influencer program and receive a monthly fee for using their TradingView charts in my analysis.

SBFC FINANCE Breakout from Long Consolidation | Strong Volume✅ Recommendation: Buy (Post-Breakout Strategy)
CMP: ₹108
Buy Zone: ₹106–₹108 (current price is still within a safe buying range after breakout)
Target 1: ₹120
Target 2: ₹135
Stop-Loss: ₹98 (just below breakout zone)
Risk-Reward Ratio: ~1:2 (ideal)
⚠️ Caution
Don’t chase if the price shoots up quickly from here. Wait for minor dips toward ₹106 to enter.
If price closes below ₹98 with volume, the breakout may fail — consider exiting.
for educational purposes only

Gold Eases as Risk Sentiment Improves, but Long-Term Demand IntaMacro theme:
- Gold prices retreated from recent highs as improved risk sentiment following the US-China trade deal and a stronger US dollar weighed on safe-haven demand.
- Gold ETFs recorded modest outflows in Apr, but the withdrawal slowdown suggests easing profit-taking pressure.
- In the near term, trade optimism may keep gold under pressure, though central bank demand and portfolio diversification continue to support the long-term outlook.
Technical theme:
- XAUUSD pulled back from the swing high near 3430, forming a lower high and moving into a sideways structure between EMAs.
- A close below 3230 could trigger further downside toward 3135,
- On the contrary, holding above 3230 may prompt a retest of the 3430 level.
Analysis by: Dat Tong, Senior Financial Markets Strategist at Exness

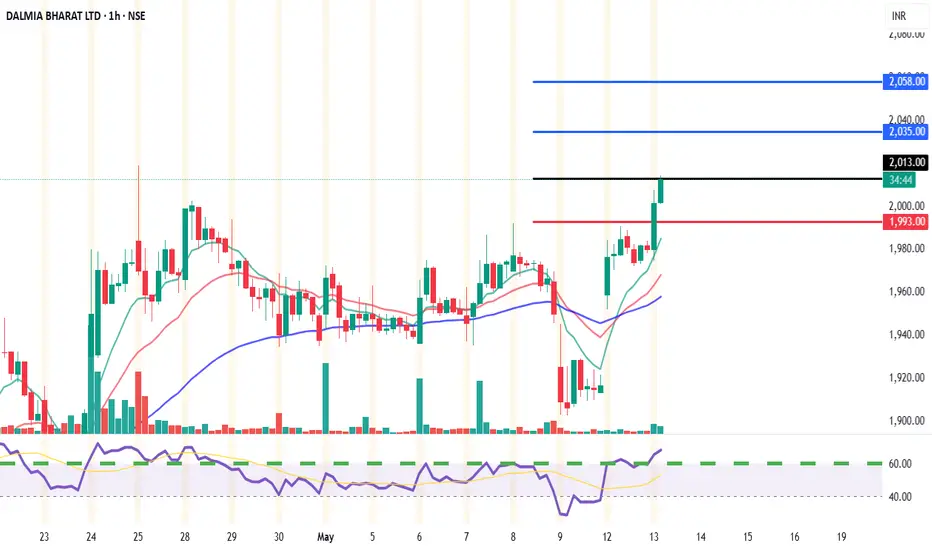
Trade Setup: DALMIA BHARAT (NSE)📊 Chart Summary:
Current Price: ₹2,009
EMA Support: 9 EMA (₹2,003.57) | 26 EMA (₹1,993.31)
Volume: Increasing with bullish candles
Price Action: Sustaining above key pivot and EMA levels
Momentum: Strong with minor consolidation
✅ Intraday Buy Setup (15min & 1h)
Buy Above: ₹2,013.50 (Break of intraday resistance zone)
Targets:
🎯 Target 1: ₹2,035.80 (Pivot R2)
🎯 Target 2: ₹2,058.30 (Pivot R3)
Stop Loss: ₹1,993 (below 26 EMA and pivot zone)
Risk:Reward: ~1:2 or better
For Education Purposes Only
Gabriel India Ltd (GABRIEL) – Weekly Resistance Breakout Setup✅ Trade Idea:
Price has reclaimed the 0.618 retracement at ₹608.25
Breakout above the ₹612 horizontal level (weekly closing basis)
Volume is rising and RSI shows strong uptrend
💰 Buy Zone:
Entry: ₹610 – ₹613
(preferably above ₹612 on strong 15min or 1H candle close)
🎯 Targets:
T1: ₹630 (previous minor supply zone)
T2: ₹646.65 (Fib 0.786 level)
T3: ₹695.55 (Fib 1.0 extension)
T4: ₹836.85 (1.618 extension for swing positional)
🛑 Stop Loss:
Intraday SL: ₹598 (below 9 EMA on 1H)
Swing SL: ₹581 (Fib 0.5 retracement support)
🔁 Strategy:
Wait for confirmation via volume + RSI > 60
Trail SL to ₹610 once ₹630 is hit
Lock partial profit near ₹646 if market sentiment weakens
For Education Purposes Only

#NIFTY Intraday Support and Resistance Levels - 14/05/2025Slightly gap up opening expected in nifty near 24700 level. After opening if nifty starts trading and sustain above 24750 level then upside movement expected upto 24950+ target. Downside 24500 level will act as a strong support for today's session. Any major downside expected below this support level.

[INTRADAY] #BANKNIFTY PE & CE Levels(14/05/2025)Today will be flat opening expected in index. After opening if banknifty starts trading and sustain above 55050 level then upside movement expected upto 55450+ level. 55450 will act as a resistance for today's session. Possible banknifty will consolidate in between range of 55050-55450 level. In case banknifty gives breakout of 55500 level and starts trading above 55550 then expected strong upside rally of 400-500+ points. Any downside only expected below 54950 level.

BTC 15M APEX ENTRY Confirmed by 1H TrendThis 15-minute Apex Entry aligned with the 1H trend, avoiding fakeouts and confirming direction.
The Tenoris Apex Suite uses real-time support/resistance detection and multi-timeframe logic to identify breakout entries with zero lag.
I use this method to focus only on trades that align across key timeframes.
Not financial advice – just sharing how I trade.
For access, see profile bio.

Nightly $SPY / $SPX Scenarios for May 14, 2025🔮 Nightly AMEX:SPY / SP:SPX Scenarios for May 14, 2025 🔮
🌍 Market-Moving News 🌍
🇺🇸 U.S.-China Tariff Reductions Implemented Today
The U.S. and China are set to enact significant tariff reductions today, lowering U.S. tariffs on Chinese goods from 145% to 30% and China's tariffs on U.S. goods from 125% to 10%. This 90-day agreement aims to ease trade tensions and has already spurred a market rally, with the S&P 500 gaining 3.3% on Monday.
📉 Inflation Hits Four-Year Low
U.S. inflation eased to 2.3% in April, marking a four-year low. This unexpected decline has alleviated concerns about the impact of recent tariffs and may influence the Federal Reserve's monetary policy decisions.
📈 S&P 500 Turns Positive for 2025
The S&P 500 has erased its year-to-date losses, turning positive for 2025. This shift is attributed to easing inflation and the recent U.S.-China trade agreement, which have bolstered investor confidence.
💼 Nasdaq to List New ETFs
The Nasdaq Stock Market will begin listing three new Russell Investments ETFs today, expanding investment options for market participants.
📊 Key Data Releases 📊
📅 Wednesday, May 14:
5:15 AM ET: Speech by Fed Governor Christopher Waller
10:00 AM ET: Business Formation Statistics for April
⚠️ Disclaimer:
This information is for educational and informational purposes only and should not be construed as financial advice. Always consult a licensed financial advisor before making investment decisions.
📌 #trading #stockmarket #economy #news #trendtao #charting #technicalanalysis

COIN ~ Inverse Head & Shoulders Breakout -- Key Levels- Hello traders! COIN made a massive move today, breaking out of a beautiful Inverse Head & Shoulders pattern. So whats next?
- There are significant resistance levels approaching between $267 and $302 (including the Inverse H&S target level) which could potentially make for a good intraday short trade opportunity.
- Watch for a quick reversal from these levels in the coming days, if you're quick you may be able to catch a short trade.
- Theres no gaurantee that price will bounce from these levels, however this zone will certainly act as significant resistance in the short term.
~ Thanks everyone and best of luck in your trading journey!

INJUSDT Potential UpsidesINJUSDT is currently trading within a broader uptrend and is in a corrective phase. The price is approaching the 13.20 level, a significant support and resistance area that aligns with the prevailing trend structure. This zone may offer useful context for observing market behavior and assessing the strength of the ongoing trend.
Trade safe, Joe.

CAD/CHF Short
🔻 CAD/CHF Swing Short Setup
Sell Limit Entry: 0.6040
Stop Loss: 0.6115 (above recent daily highs)
Take Profit 1: 0.5800
Take Profit 2: 0.5700
Risk-to-Reward: ~2.6:1 to TP1, ~4.5:1 to TP2
Fundamentals:
CAD is weakening from falling oil, soft economic data, and global trade risk.
CHF is gaining on risk-off sentiment and its safe-haven status.
Technical Confluence:
Monthly chart just broke below long-term support at 0.6000 for the first time ever.
Weekly chart shows price retesting 0.6000–0.6050, a perfect break-and-retest setup.
Daily shows price stalling beneath resistance without strength — no bullish breakout attempt yet.
Target Logic:
TP1 at 0.5800 is just above the panic wick zone — realistic and conservative.
TP2 at 0.5700 aligns with the extreme 2015 SNB spike low — stretch target only if momentum continues.

AUD/CHF ShortBias: Bearish AUD/CHF
AUD Weakness
RBA inflation (Trimmed Mean CPI YoY) slowed from 3.3% → 2.9%
Global risk sentiment is fading due to weak U.S. data, trade tensions, and slowing growth
AUD struggles in risk-off environments and with declining China demand
CHF Strength
Safe-haven flows remain strong as markets de-risk
Swiss CPI is stable, and the SNB remains steady — CHF attractive in low-volatility regimes
CHF favored when yield-chasing slows down
📌 Technical Coordinates – Short Setup
Sell Limit Entry: 0.5400
Stop Loss: 0.5525
(Above daily structure high and broken support zone)
Take Profit 1: 0.5000
(Key psychological and historical support zone)
Take Profit 2: 0.4800
(SNB spike zone, clean sweep extension)

CARDANO (ADAUSD): Very Bullish Pattern
ADA formed a huge inverted head and shoulders pattern
on a daily time frame.
A bullish violation of its neckline is a strong bullish signal.
I expect more growth and a test of 0.974 level soon.
❤️Please, support my work with like, thank you!❤️
