Gold (XAUUSD) Long Setup – Targeting Fresh Highs Bullish Move📊 Chart Breakdown & Market Context:
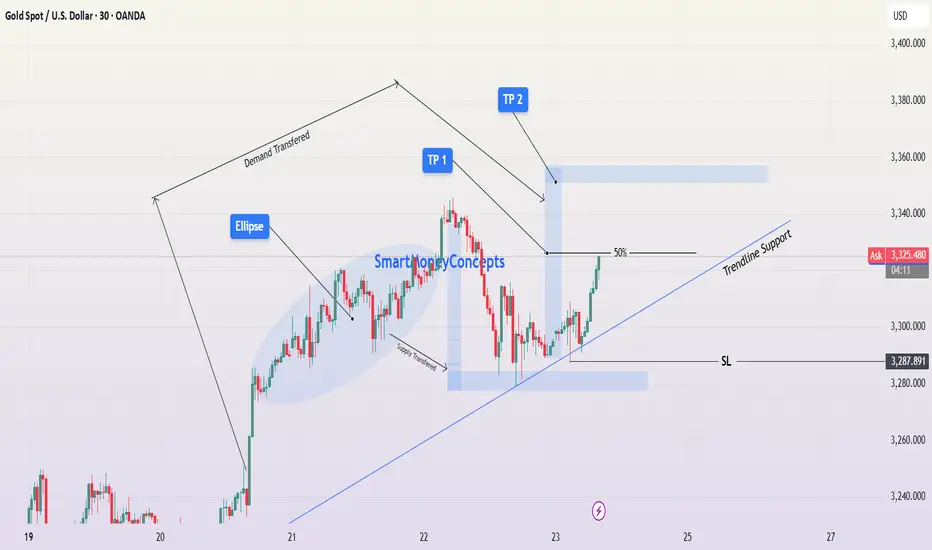
This 30-minute chart of Gold Spot (XAU/USD) shows a strong bullish price structure that is currently forming higher lows while respecting dynamic trendline support. The chart illustrates demand and supply transfers, which are pivotal concepts in price action trading. Let’s explore the technical reasoning behind this trade setup:
🔄 1. Demand & Supply Shift Zones:
Demand Transferred: Initially, price consolidated within the blue elliptical region. This area saw aggressive bullish pressure that pushed price upward, confirming the presence of institutional demand. As the market progressed, this demand shifted higher — now located at the most recent zone where price bounced after a pullback.
Supply Transferred : A major bearish reaction zone was taken out after the market absorbed selling pressure. This suggests that sellers are no longer in control and demand is rebalancing in favor of buyers.
📈 2. Bullish Structure Confirmation:
After the pullback on May 22, price formed a higher low, perfectly aligned with both the new demand zone and the ascending trendline support. This confirms that buyers are defending this area.
The price is currently pushing upward from this demand, signaling a potential bullish continuation.
The 50% equilibrium level of the recent bearish leg is being tested. A clean break and close above this level would confirm buyers’ dominance and could invite momentum trading interest.
🔵 3. Entry, Targets & Stop-Loss Plan:
✅ Entry:
Entry is ideal from the current price region near 3,313 (or on minor retracement, maintaining RR).
🎯 Take Profit Zones:
TP1 (~3,336): This is just above the 50% level and near the previous swing high. Partial take-profit here is wise in case price consolidates.
TP2 (~3,360): Located at the upper resistance zone, marking the potential target if bullish momentum continues.
❌ Stop-Loss:
SL: 3,287.891 — placed below the recent higher low and below the demand zone. This protects the trade from deeper pullbacks or breakdowns below structural support.
📉 4. Risk Management & Trade Psychology:
Maintain a Risk-Reward Ratio (RRR) of at least 1:2 to ensure profitable expectancy.
Avoid over-leveraging, as we are trading near a key resistance zone (50% area).
Watch for volume confirmation or strong bullish candles before fully committing to the trade.
Use a trailing stop once TP1 is hit to secure profits toward TP2.
⚠️ 5. Key Considerations Before Execution:
Monitor any macroeconomic events (e.g., Fed announcements, CPI/PPI, NFP) that may impact gold volatility.
Check DXY (Dollar Index) — if the dollar weakens, gold will likely strengthen further.
Volume behavior around the 50% zone will indicate breakout vs rejection.
🧠 Summary for Minds Section:
Gold shows a clear higher-low structure supported by trendline and demand transfer.
Buyers absorbed supply; now building momentum toward upper resistance zones.
Entry near 3,313, SL under 3,288, TP1 ~3,336, TP2 ~3,360.
Trend remains bullish unless trendline and demand zone are broken.
💡 Educational Takeaway: Watch for demand/supply shifts and trendline confirmations. This setup is a textbook example of structural continuation supported by market psychology and price action zones.
Technical Analysis
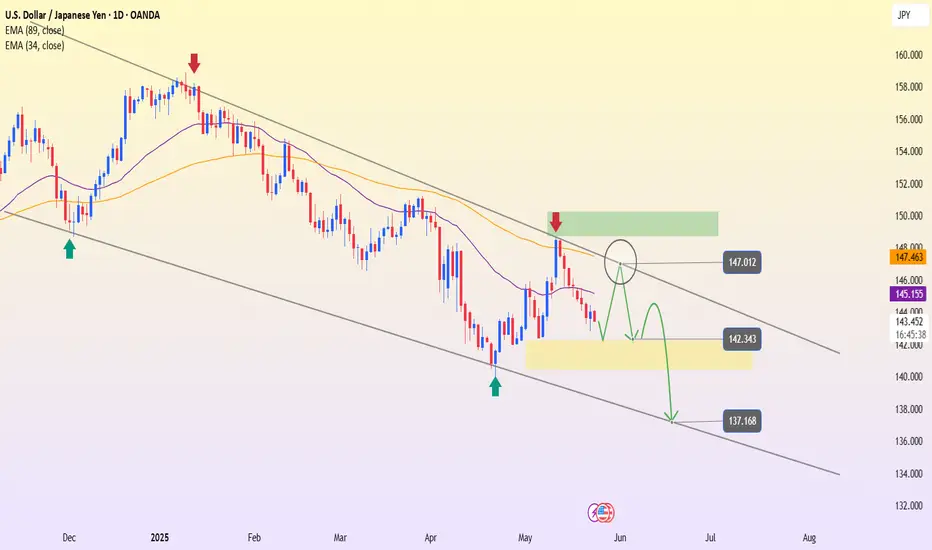
USDJPY – The downtrend continues, channel still leads the wayLooking at the D1 chart, USDJPY remains firmly within the descending channel that has persisted since the end of 2024. Every time the price approaches the upper boundary of the channel, selling pressure reappears – and the recent touch around the 147.012 area is no exception.
After being rejected at this strong resistance zone, the price has turned lower and is now forming a pullback structure within the prevailing trend. EMA34 and EMA89 continue to slope downward, reinforcing the bearish momentum.
If the price gets rejected again around the 145–146 region, the correction pattern may complete, opening up room for a drop toward the support zone at 142.343, or even deeper toward the channel bottom near 137.168.
In summary, the primary trend remains bearish – and the preferred strategy now is "sell on rally" when the price nears the upper resistance of the channel. Patience and watching for price action will be key.
EURUSD – Consolidation below trendline hints at breakout aheadHello traders! EURUSD is currently forming a rather interesting consolidation pattern right below the descending trendline – a level that has rejected price twice in the past.
After a mild pullback from the 1.1382 zone, price has quickly recovered and is now hovering around the EMA34 and EMA89. This is an important confluence area and is acting as short-term support around 1.1263.
If EURUSD continues to hold above this support and forms sideways accumulation, the probability of a trendline breakout will increase. In that case, the next target will likely be the previous high at 1.1382.
U.S. bond yields are fluctuating sharply, and geopolitical tensions – such as trade uncertainty or regional instability – may serve as catalysts that support the euro.
Keep an eye on the breakout zone – if price breaks out decisively, it could be a strong confirmation of a new bullish trend!

[INTRADAY] #BANKNIFTY PE & CE Levels(23/05/2025)Today, Bank Nifty is expected to open flat. If after opening it starts trading and sustains below the 54950–54900 zone, then a downside move toward 54750, 54650, and 54550 is possible.
Further breakdown below 54450 could lead to extended downside targets at 54250, 54150, and 54050 levels.
On the upside, if Bank Nifty sustains above the 55050–55100 zone, it may trigger a bullish rally toward 55250, 55350, and 55450+. However, 55450 remains a strong resistance zone and any bullish move may reverse from there.

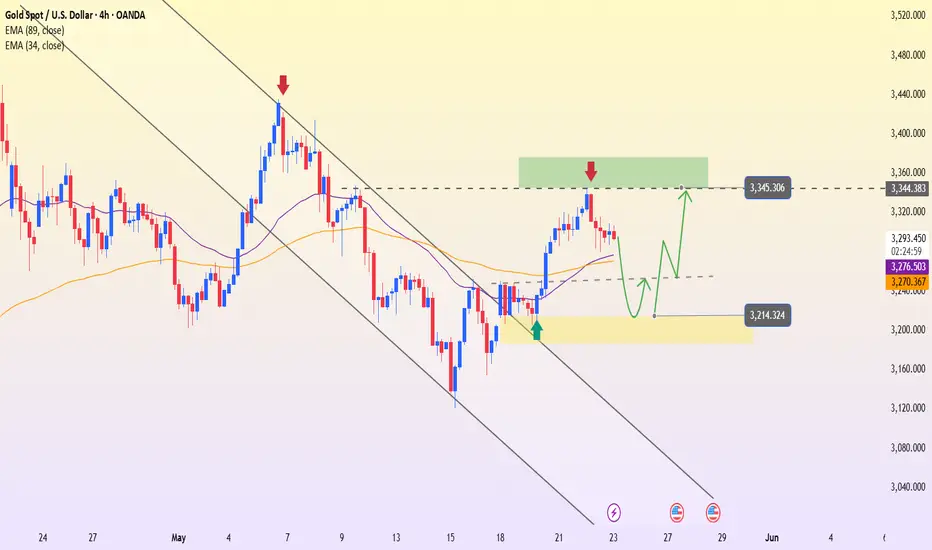
After a sudden drop, is gold "loading up" for a breakout?Hey everyone! At the start of today’s Asian session, gold is moving sideways around the $3,300 level, following yesterday’s sharp swing. Looking back, the price had climbed for three consecutive sessions earlier this week, then suddenly spiked to a two-week high of $3,345 during the Asian session on Thursday—only to quickly drop and close near $3,294.
This sharp reversal reflects the ongoing tug-of-war between a strengthening US dollar, volatile US bond yields, and unstable geopolitical factors. However, on the 4H chart, the bullish structure still holds, with price currently retesting the support zone around the EMA34.
Key price scenarios to watch:
If the support area around $3,214 holds → gold could bounce back toward the $3,345 region.
On the other hand, if $3,214 breaks → the bullish scenario will be temporarily invalidated and gold might revisit a deeper accumulation zone.
Right now, watching the price reaction around yesterday’s low is crucial—this could be the key to catching the next wave.
Nightly $SPY / $SPX Scenarios for May 23, 2025 🔮 Nightly AMEX:SPY / SP:SPX Scenarios for May 23, 2025 🔮
🌍 Market-Moving News 🌍
🇬🇧 Global Bond Yields Signal Rising Term Premium
Long-dated government bond yields in the U.S., U.K., and Japan surged, with the U.S. 30-year Treasury yield touching 5.09%, as investors demand higher compensation for locking in funds amid mounting debt and inflation risks
🏗️ Komatsu Sees Tariff Relief
Komatsu’s CEO says a recent U.S.–China trade truce may cut the company’s tariff hit by $140 million, easing cost pressures on its U.S. operations and brightening machinery sector outlook
📉 U.S. Stocks End Flat as Yields Ease
Wall Street closed little changed, with the S&P 500 and Dow finishing flat and the Nasdaq up 0.3%, after Treasury yields retreated slightly following recent spikes
📊 Key Data Releases 📊
📅 Friday, May 23:
🏠 New Home Sales (10:00 AM ET)
Reports the number of newly signed contracts for single-family homes, a direct gauge of housing demand and consumer confidence.
⚠️ Disclaimer:
This information is for educational and informational purposes only and should not be construed as financial advice. Always consult a licensed financial advisor before making investment decisions.
📌 #trading #stockmarket #economy #news #trendtao #charting #technicalanalysis

ETH/USDT Potential UpsidesHey Traders. in today's trading session we are monitoring ETH/USDT for a buying opportunity around 2420 zone, Ethereum is trading in an uptrend and currently is in a correction phase in which it is approaching the trend at 2420 support and resistance area.
Trade safe, Joe.

S&P 500: Consolidating & forming bull flag on support trendlineSo, we all know that the market is taking a breather, and the past week has been mostly flat (kind of). There have been plenty of headlines, some good, some bad. Most notably, the news about the Moody's US credit downgrade. I woke up one morning, took a look at LinkedIn and saw all the CFA-certified investing experts expecting a massive game-changing moment, potentially a market crash.
Except, the market hasn't responded so negatively. In fact, I'd say that while long-term yields have been rising, the market has been doing its own thing .
For instance, taking a look at the daily chart of the S&P 500 paints a different picture of the doom and gloom that I've been hearing ALL weekend and ALL week long. As you can see, the index is currently sitting on the daily support trendline which goes back to the 7th April low.
On that trendline, taking a closer look, it seems the flat price action has been forming a bull flag. It's quite narrow and tight. But it certainly is a fine-looking bull flag. And a break above that would take the S&P 500 even higher.
This would also likely have a positive effect on other indices. Furthermore, it might be worth keeping an eye on the big S&P 500 stocks that are high-beta and like to follow the market.
So, to my point about how the market has been doing its own thing...seems that the Moody's downgrade could have possibly been already priced-in. I could be wrong, of course, as markets are still quite volatile and fragile to any sort of macro and global developments about trade and conflicts around the world.
Thank you for reading.
Note: not financial advice

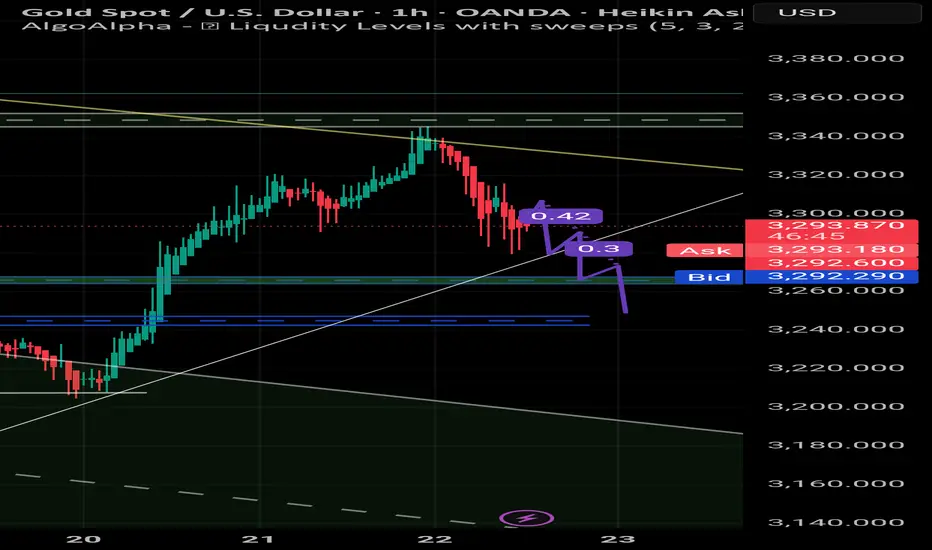
Gold Analysis – Key Sell Opportunity After Trendline Break | XAUGold has shown a significant rejection from the 3340–3350 resistance zone and broke below the ascending trendline. The price is currently retesting the breakout area around 3294, which may act as a new supply zone. Based on current market structure and liquidity behavior, a short position is now favorable.
Trade Plan:
Entry Zone: 3294 – 3300
Stop Loss: Above 3310
Take Profit 1: 3260
Take Profit 2: 3240
Market volatility remains high, and price may hunt liquidity toward the 3240 zone before a potential bounce. Monitor U.S. session volume and possible news catalysts.
TRX/USDT Potential UpsidesHey Traders, in today's trading session we are monitoring TRX/USDT for a buying opportunity around 0.2680 zone, TRX/USDT is trading in an uptrend and currently is in a correction phase in which it is approaching the trend at 0.2680 support and resistance area.
Trade safe, Joe.

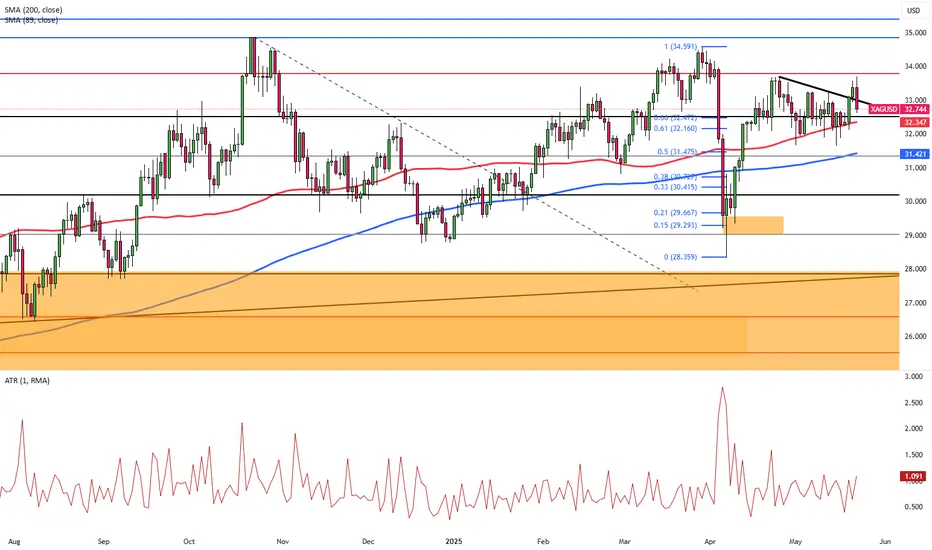
Rising Wedge Breakdown – Bearish Setup on Silver (XAGUSD)Silver (XAG/USD) is currently trading within a bearish rising wedge formation on the 8-hour timeframe, and the market structure is hinting at a potential reversal to the downside. The confluence of resistance zones, pattern anatomy, and historical price action all point to a high-probability short setup, especially if key support levels are breached.
📈 Pattern Analysis: Rising Wedge
A rising wedge is typically a bearish chart pattern that forms when price consolidates between two upward sloping trendlines. However, the upper trendline rises at a slower pace than the lower one—indicating decelerating bullish strength. It often precedes a bearish breakout, especially if volume decreases near the apex.
In this case, the wedge is forming just below a major resistance zone around the $34.00 area, adding weight to the bearish scenario.
🔹 Key Technical Levels :
🟥 Resistance Zone ($33.80–$34.80): Price has tested and rejected this area multiple times in recent weeks. It marks a clear liquidity zone where sellers are in control.
🟩 Support Zone ($29.50–$30.30): This zone has provided strong support in previous retracements. If broken, it may flip into resistance upon retest.
🟦 Retest Zone (~$31.00–$31.50): If the wedge breaks downward, price may retest this area—creating an opportunity for traders to enter short with better risk-reward.
🎯 Final Bearish Target : $26.85: This level is derived from the height of the wedge and prior demand zones, making it a strong target area in a fully played-out bearish move.
🧠 Market Structure & Sentiment:
Volume Analysis – Volume has been tapering off as the price squeezes within the wedge, which is a typical trait of rising wedges. A volume spike on breakdown would serve as confirmation.
Trend Analysis – While the overall trend in the medium term has been bullish, the weakening upward momentum suggests that buyers are losing strength, and sellers may regain control soon.
Rejection Candle s – Several recent candle wicks above the $33.50 zone show clear rejection and failure to close above, reinforcing the resistance level.
📊 Trade Plan (Educational Purposes Only):
Criteria Details
Bias Bearish (Rising Wedge Breakdown)
Entry Option 1 On breakdown of wedge + retest
Entry Option 2 Aggressive entry on breakdown candle close below $31.50
Stop Loss Above $33.80 (last resistance)
Take Profit 1 $30.00 (support zone)
Take Profit 2 $28.00 (partial exit)
Take Profit 3 $26.85 (final target)
📌 Trading Psychology Note:
Traders should remain patient and avoid entering prematurely. Let the pattern confirm itself with a clean break and retest. Risk management is critical—wedge patterns can also fake out before reversing hard.
🧾 Summary:
Silver is nearing the end of a rising wedge pattern, right under a heavy resistance zone. Historical behavior, weakening momentum, and classic wedge structure suggest a potential bearish reversal. A break below the wedge support and a retest around $31.00 could present a high-probability short trade setup targeting the $26.85 area.
Keep this chart on watch. A decisive move is likely coming soon.

DOW JONES INDEX (US30): Your Plan to Buy Explained
There is a high chance that US30 will resume growth soon.
The index is currently testing a wide daily support cluster.
My signal to buy will be a bullish violation and a candle close above
41920 minor horizontal resistance.
A bullish movement will be anticipated at least to 42200 level then.
❤️Please, support my work with like, thank you!❤️
I am part of Trade Nation's Influencer program and receive a monthly fee for using their TradingView charts in my analysis.

Silver Rises to $32.60 on Safe-Haven DemandSilver (XAG/USD) climbed to around $32.60 per ounce on Thursday during Asian trading, recording its third consecutive gain as safe-haven demand increased amid rising U.S. fiscal concerns and global tensions.
Moody’s recent downgrade of the U.S. credit rating to Aa1, citing growing debt and deficits, added pressure on the Dollar. Ongoing unrest in the Middle East and Israel’s military actions in Gaza also supported precious metal prices. Meanwhile, Ukraine is preparing to urge the EU next week to seize Russian assets and target oil buyers, as U.S. sanctions appear to be losing momentum.
The first critical support for Silver is seen at 33.80, and the first resistance is located at 32.30.
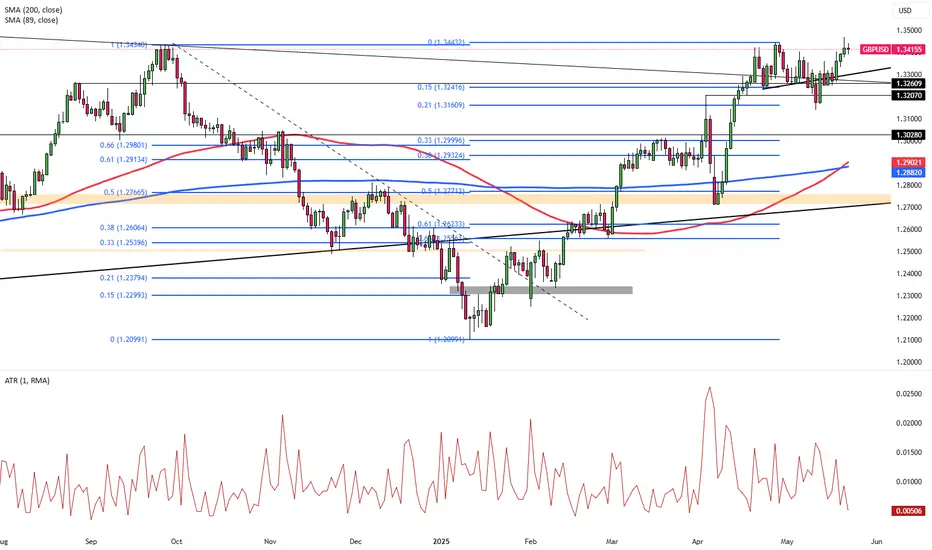
Sterling Extends Rally Amid U.S. Fiscal ConcernsGBP/USD extended its gains for a fourth consecutive session, trading near 1.3430 during Thursday’s Asian session. The pair’s upward movement is largely supported by continued weakness in the U.S. Dollar, following Moody’s downgrade of the U.S. credit rating from Aaa to Aa1, in line with earlier downgrades by Fitch in 2023 and S&P in 2011.
Moody’s cited projections that U.S. federal debt could surge to 134% of GDP by 2035, up from 98% in 2023, with the budget deficit potentially widening to nearly 9% of GDP. Key concerns include rising interest payments, growing social expenditures, and weakening tax revenues.
The first critical support for GBP/USD is seen at 1.3450 and the first resistance is located at 1.3250.
USDCAD RETEST OR FRESH DOWNTREND? PRICE AT A CRUCIAL CROSSROAD!USDCAD 22/05 – KEY RETEST OR FRESH DOWNTREND? PRICE AT A CRUCIAL CROSSROAD!
🌐 MACRO BACKDROP:
Canada’s CPI and Retail Sales have come in weaker than expected, signaling sluggish consumer demand and reducing the probability of near-term rate hikes by the Bank of Canada.
Meanwhile, the USD is stabilizing, supported by steady U.S. Treasury yields after the Fed reaffirmed its “higher for longer” stance.
Oil prices, a major driver of the Canadian Dollar, have shown no significant breakout, further weakening CAD’s bullish momentum.
🔍 TECHNICAL OVERVIEW (H1–H4 Chart):
After hitting a key swing low at 1.3820, USDCAD is now retracing towards the 0.5 Fibonacci zone (1.3889 – 1.3913), which also aligns with:
The 200 EMA resistance (red line)
Previous structure rejection zone
➡️ This area is critical – it could act as a trap zone before price resumes downward or breaks to confirm a short-term bullish reversal.
📈 TRADE SETUPS:
🔻 SELL SETUP (HIGH PROBABILITY IF PRICE FAILS AT RESISTANCE):
Entry: 1.3900 – 1.3913
Stop Loss: 1.3930
Take Profit Targets: 1.3884 → 1.3859 → 1.3847 → 1.3820
🔹 BUY SETUP (IF PRICE HOLDS ABOVE THE BASE ZONE):
Entry: 1.3820 – 1.3823
Stop Loss: 1.3805
Take Profit Targets: 1.3847 → 1.3880 → 1.3913
⚠️ STRATEGY NOTES:
Be cautious during the New York session, as potential comments from Fed officials or crude oil updates could spike volatility.
This is a textbook case of “reaction vs. continuation” at a Fibo cluster – stick to confirmed candlestick signals to avoid false breakouts.
📌 FINAL THOUGHTS:
USDCAD is in a corrective rally after an extended decline. The 1.3913 zone is a key decision point. Sellers should watch for signs of exhaustion, while buyers can target short-term retracements if support holds at 1.3820.

BREAKOUT OR REJECTION? WATCH 0.64137 KEY ZONE CLOSELY! AUDUSD 22/05 – BREAKOUT OR REJECTION? WATCH 0.64137 KEY ZONE CLOSELY!
🌐 MACRO OVERVIEW
DXY is starting to lose momentum after a sharp rally fueled by the Fed’s hawkish stance. However, there’s still no clear signal of an imminent rate cut.
Meanwhile, the RBA (Reserve Bank of Australia) maintains a steady policy, offering short-term support for AUD. While rates remain unchanged, the central bank’s cautious tone adds a defensive layer for the Aussie.
On the trade front, Australia has seen marginal recovery in commodity prices, though ongoing concerns about Chinese economic slowdown continue to weigh on sentiment.
📊 TECHNICAL ANALYSIS (Timeframes: H1 – H4)
AUDUSD is forming a tight symmetrical triangle, with lower highs and higher lows — a typical precursor to a breakout.
The current price at 0.6418 is sitting right along the lower trendline. Price action here is critical to determine today’s direction.
🔍 Scenario A – Upside Breakout (30% probability):
If price breaks and closes above 0.64700–0.64910, we could see bullish continuation toward the 0.65134 resistance zone.
🔍 Scenario B – Breakdown (70% probability):
A strong break below 0.64137 could trigger a move toward 0.63964 and potentially deeper into the 0.63640 liquidity zone.
🎯 TODAY'S TRADE PLAN
🔵 BUY SCALP (only if price reacts strongly at trendline support)
Entry: 0.6414 – 0.6416
SL: 0.6408
TP Targets: 0.6445 → 0.6470 → 0.6490
🔴 SELL SETUP (if triangle is broken to the downside)
Entry: 0.6405 – 0.6396
SL: 0.6420
TP Targets: 0.6364 → 0.6340
⚠️ IMPORTANT NOTES
Expect high volatility during the U.S. session as PMI and Unemployment Claims data are released.
Stick to your TP/SL levels with discipline — the market may sweep liquidity on both sides before choosing a direction.
📌 SUMMARY:
AUDUSD is consolidating in a clean technical pattern while macro uncertainty looms. Whether we break up or down, the key is to trade what the market gives — not what we think. React to confirmation, not prediction.

Euro Extends Rally Ahead of PMI DataEUR/USD trades near 1.1340 during Asian hours, close to two-week highs, extending gains for a fourth session ahead of Eurozone PMI data expected to show improved growth for May.
The U.S. dollar remains under pressure as markets await Thursday’s S&P Global PMI. Moody’s downgraded the U.S. credit rating to Aa1, matching earlier cuts by Fitch and S&P, citing rising debt, projected to reach 134% of GDP by 2035, and a nearly 9% deficit.
Trump’s tax-cut plan cleared the House Rules Committee, but the DXY still trades lower near 99.50.
The key resistance is located at 1.1390, and the first support stands at 1.1260.

BTC/USD: Structural Breakout of Curved Resistance – Eyes on $116Technical Overview:
Bitcoin (BTC) has successfully completed a significant technical breakout after months of accumulation and resistance interaction. The chart highlights a precise market structure where price has moved from a phase of consolidation into a confirmed bullish breakout, with a clearly defined target and invalidation level.
1. SR Interchange Zone (Support-turned-Resistance):
From May to October 2024, BTC price action was trapped in a sideways range, marked by an extended accumulation phase between approximately $60,000 to $73,000. This zone acted as a historical resistance level during the downtrend, but was later flipped into support, forming a classic SR Interchange — a foundational concept in market structure analysis.
This area provided a strong base from which BTC launched its late 2024 rally.
2. Consolidation Below Curved Resistance (Dec 2024 – Apr 2025):
Following a steep bullish impulse, BTC entered a multi-month consolidation phase, forming a rounded top pattern — shown on the chart as the Black Mind Curve Resistance. This curved resistance represented a psychological and structural ceiling, suppressing bullish momentum and trapping liquidity.
Price action was tightly compressed under this dynamic resistance curve, with multiple failed breakout attempts. This period was marked by range-bound volatility and low directional commitment — classic behavior during a re-accumulation phase.
3. Breakout of Black Mind Curve Resistance (May 2025):
A major technical event occurred as BTC broke decisively above the Black Mind Curve Resistance, accompanied by a surge in bullish momentum. This move not only invalidated the prior rounding top structure but also confirmed a trend continuation breakout.
The breakout was clean, with strong follow-through volume and a higher high structure above the Major Horizontal Resistance Zone (~$105,000–$109,000) — now confirmed as flipped support.
4. Bullish Continuation & Price Target:
Following the breakout, BTC has established a higher low and continued its upward trajectory toward the marked target zone at $116,065. This zone coincides with:
Previous untested supply levels
Technical Fibonacci extension (1.272–1.618 zone)
Measured move from the curve structure base
With current momentum and structure intact, BTC remains bullishly biased until it either reaches the target zone or breaks below the invalidation level.
5. Invalidation & Risk Management:
A close below $102,005 — the defined SI (Support-Invalidation) level — would be considered structurally bearish. This level represents:
The most recent higher low
Base of the breakout structure
Re-entry into previous consolidation range
A breakdown below this level would invalidate the bullish thesis and may open the door for a deeper pullback toward $95,000 or even $88,000.
✅ Conclusion:
The breakout of the Black Mind Curve Resistance marks a significant technical shift in Bitcoin’s trend. With momentum in favor of the bulls and market structure supporting higher prices, BTC appears poised to test the $116,000 target zone in the short to mid-term — barring a breakdown below key support.
📌 Key Levels Recap:
Level Type Price
Target Zone $116,065
Current Price $110,902
Support / Invalidation (SI) $102,005
📈 Strategy Outlook:
Bias: Bullish
Entry Area: Retest of $107,000–$109,000 (if offered)
Target: $116,065
Stop-Loss: Below $102,005 (structural invalidation)
💬 Stay focused on structure, not emotions. The best trades are born from patience, not prediction.
Let me know if you'd like a summary version for use on social media or a custom signature block for your TradingView profile.

XAUUSD – Rising Wedge Breakdown in Play? | Bearish Setup Alert🧠 Market Analysis
Gold (XAUUSD) has shown incredible bullish strength in recent months, driven by geopolitical tensions, inflation uncertainty, and increased demand for safe-haven assets. However, every trend experiences a pause or correction — and that’s where we may currently be.
📊 Pattern Overview: Rising Wedge Formation
One of the most prominent technical patterns right now is the Rising Wedge. This is a bearish reversal pattern that occurs when price action consolidates upwards in a narrowing range, indicating waning bullish momentum and an imminent breakdown.
In this chart:
We see a clear series of higher highs and higher lows, forming two converging trendlines.
The upper trendline acts as dynamic resistance, while the lower one has been supporting price until now.
The wedge has now broken to the downside, signaling the potential start of a new short-term downtrend.
🔍 Key Technical Elements Explained:
🔵 1. Major Resistance Zone
Marked in the blue rectangular box, this zone has acted as a historical pivot area — both as support and resistance in the past.
The market respected this zone multiple times.
Price action tends to hesitate or reverse in such regions due to large institutional order flows.
🧠 2. Black Mind Curve Resistance
Unlike flat trendlines, the "Black Mind Curve" represents a curved, psychological dynamic resistance — often based on market sentiment, Fibonacci arcs, or logarithmic regression.
It reflects the market’s natural rhythm and is respected due to the hidden behavior of algorithmic trading systems.
Price just rejected this resistance after touching it during the wedge formation — a strong bearish clue.
🔄 3. Retest in Progress
After breaking out of the rising wedge to the downside, price is now retesting the broken wedge support.
This is a common price behavior known as the “kiss of death” — a final tap before continuation.
If the price fails to reclaim this broken support zone, it confirms a bearish continuation is on the table.
🎯 Trade Plan: Entry, Target & Stop
Trade Element Details
Bias Bearish
Entry Idea On confirmation of retest rejection (e.g., bearish engulfing candle)
Stop Loss (SL) Above the recent high or resistance – near $3,413.58
Take Profit (TP) First major support near $3,153.70 (SR Interchange)
Risk-Reward Ratio Estimated between 1:2 to 1:3, depending on entry
🔥 Bonus Target: If momentum increases, an extended drop toward $3,100–$3,080 is possible — where deeper demand lies.
🧘♂️ Trading Psychology & Risk Management:
Let’s face it: Even the best setup can fail — which is why discipline is your edge.
Confirmation is Key: Never short just because of a pattern. Wait for structure + candlestick confirmation (e.g., bearish engulfing, shooting star, etc.).
Emotions Kill Accounts : Don’t let greed convince you to skip stop-losses or over-leverage.
Let Price Come to You: If you missed the perfect entry, don’t chase. The market always gives second chances.
🧠 Educational Insight : What Makes This Setup Powerful?
This setup is a confluence trade, meaning:
You’re not relying on one signal, but multiple confirmations:
Rising wedge (pattern-based)
Resistance zone (horizontal S&D)
Curved dynamic resistance (psychological + advanced trendline)
Retest + rejection behavior (price action)
These stacked layers of confirmation increase the probability of a successful trade.
📌 Final Thoughts:
Gold is showing all the technical signs of a short-term bearish correction, despite the broader bullish narrative. For smart traders, this is an opportunity to catch a swing short with a clear entry, stop, and target.
The key to winning here? Patience and confirmation.
You don’t have to predict the market — just react to it with logic and discipline. Let the setup unfold naturally, and let the trade come to you.
💬 What’s Your Take?
Are you shorting Gold here or waiting for more confirmation?
Have you used curved resistance lines before in your analysis?
Drop your thoughts below — and if this helped you, smash the like button, share with others, and follow me for more high-probability setups!

STRUCTURE SHIFT OR FALSE BREAKOUT? MAJOR MOVE LOADING? EURUSD 22/05 – STRUCTURE SHIFT OR FALSE BREAKOUT? MAJOR MOVE LOADING?
🌐 MACRO OUTLOOK
The market remains caught between dovish expectations and hawkish reality. While recent US CPI and PPI came in weaker than expected, Fed officials have refrained from confirming any imminent rate cuts, keeping the dollar resilient in the medium term.
Meanwhile, the ECB’s cautious stance and ongoing inflation risks across the eurozone continue to cap euro strength. The divergence in tone between the Fed and the ECB adds to the short-term volatility and uncertainty around EURUSD’s direction.
📉 TECHNICAL ANALYSIS (H1 + H4 Timeframe)
EURUSD has faked a breakout above the 1.1310–1.1320 resistance zone and is now pulling back to the key structure support around 1.1279 — a critical short-term level.
📌 Key Observations:
Bearish engulfing candle formed on H1 after price rejected the upper zone → potential reversal signal.
EMA 13 is crossing below EMA 34 → suggesting short-term downside pressure.
A confirmed H1 close below 1.1279 opens room for deeper retracement towards 1.1234 (previous demand/FVG area).
If momentum builds, we could see a broader correction toward 1.1148 in the coming days.
⚙️ TRADE STRATEGY FOR TODAY
🔻 PRIMARY SCENARIO – SELL THE RALLY
Entry Zone: 1.1315 – 1.1318 (near FVG + fake breakout zone)
Stop Loss: 1.1360
Take Profit Targets:
→ TP1: 1.1279
→ TP2: 1.1234
→ TP3: 1.1148
🔹 ALTERNATE SCENARIO – BUY SCALP ON STRONG REACTION
Buy Entry: 1.1234 – 1.1230 (only with bullish M15 confirmation)
Stop Loss: 1.1210
Take Profit: 1.1279 → 1.1300
🧠 STRATEGIC INSIGHT
A D1 candle close below 1.1234 will confirm a structure break and likely initiate a deeper downward trend.
On the flip side, if 1.1234 holds and US jobless claims disappoint later today, EURUSD may recover back to test 1.131x.
Market sentiment is highly reactive — stay flexible and prioritize price action confirmation.
📌 FINAL THOUGHTS:
EURUSD is at a pivotal point — either confirming a new downtrend or bouncing back within the current range. This is a trader’s market: clear key levels, disciplined risk management, and adaptive execution are essential.
📈 Follow for real-time chart updates, FVG mapping, and more daily trading setups.
Stay smart, stay sharp. Risk management first.

JPY Hits 2-Week High as Dollar WeakensThe Japanese yen strengthened to around 143 per dollar on Thursday, its highest in over two weeks, as concerns over the U.S. fiscal outlook pressured the dollar. Fears that Trump’s proposed tax cuts could add over $3 trillion to U.S. debt weighed on investor confidence.
Japan’s Finance Minister Kato said he did not discuss currency levels with Treasury Secretary Bessent at the G7 summit.
Domestically, core machinery orders surged 13% in March, beating expectations of a 1.6% drop, while May PMI data showed continued weakness in both manufacturing and services.

EURNZD: Pullback From Resistance Confirmed?! 🇪🇺🇳🇿
Odds are high that EURNZD will retrace from the underlined blue resistance.
The pair looks bearish from the intraday perspective after a release
of German fundamentals this morning.
I think that the price may drop to 1.9027 level.
❤️Please, support my work with like, thank you!❤️
I am part of Trade Nation's Influencer program and receive a monthly fee for using their TradingView charts in my analysis.

FVG LIQUIDITY & POLITICAL SHOCKS: WILL THE SELLERS STRIKE BACK?GOLD PLAN 22/05 – FVG LIQUIDITY & POLITICAL SHOCKS: WILL THE SELLERS STRIKE BACK?
🌍 Fundamental & Geopolitical Overview:
🔺 Breaking Political News:
On the night of May 21, two Israeli embassy officials were fatally shot near the Jewish Museum in Washington in what’s being labeled an anti-Semitic terrorist act.
→ Former President Trump condemned the attack, calling it “disgusting” and demanding an end to extremism.
→ Events like these typically boost gold as a safe haven, but this time the market appears hesitant.
🔺 Meanwhile, the Federal Reserve remains hawkish, signaling “higher-for-longer” interest rates.
→ This continues to support USD strength, putting downward pressure on gold.
🔍 Technical Outlook (H1):
Gold (XAUUSD) recently topped around 3397, followed by a strong bearish rejection candle at that level.
Two Fair Value Gaps (FVG) are now defining market sentiment:
Upper FVG: 3330 – 3356 (partially filled)
Lower FVG: 3277 – 3247 → highly likely to be targeted if breakdown occurs.
EMA 13 & EMA 34 are flattening out, indicating consolidation within a breakout range.
🧭 Trade Strategy for Today:
🔻 PRIMARY SELL ZONE:
Entry: 3395 – 3397
Stop Loss: 3401
Take Profit: 3390 → 3386 → 3380 → 3376 → 3370
🔻 SELL SCALP:
Entry: 3358 – 3360
Stop Loss: 3364
Take Profit: 3354 → 3350 → 3346 → 3342 → 3338 → 3330
🔵 BUY ZONE:
Entry: 3296 – 3294
Stop Loss: 3290
Take Profit: 3300 → 3304 → 3308 → 3315 → 3320 → 3330 → ???
🔵 BUY SCALP:
Entry: 3316 – 3314
Stop Loss: 3310
Take Profit: 3320 → 3324 → 3328 → 3332 → 3340 → 3350
⚠️ Key Things to Watch:
FBI and White House responses to the DC shooting could ignite renewed risk-off sentiment, pushing gold higher suddenly.
A break above 3400 invalidates today’s setup – expect renewed bullish pressure if that happens.
📌 Pro Tip: Don’t chase the market. Let price come to your zones. Respect SL/TP and manage risk – especially on volatile days like today.
📣 Follow this account for live updates, scalping levels, and macro-triggered trading zones in real time!
