XAUUSD – Testing resistance zone, will there be a breakout?Gold continues its impressive recovery on the 3H timeframe, after bouncing strongly from the support zone around $3,300. Currently, the market is approaching a key resistance area at $3,400 – a level that previously triggered strong selling pressure.
EMA34 and EMA89 have crossed upwards, indicating that short-term bullish momentum is gaining strength. However, since this is a former resistance zone, a pullback to the $3,300 area before continuing the upward move is entirely possible.
On the news front, rising jobless claims and weakening manufacturing PMI have lowered expectations for the strength of the USD. However, a slight uptick in the services PMI keeps market sentiment cautious – resulting in a tug-of-war, though still leaning in favor of the buyers.
What do you think? Will gold break out further or take a breather first?
Technical Analysis

#NIFTY Intraday Support and Resistance Levels - 22/05/2025Today a flat opening is expected in Nifty. After opening, if Nifty sustains above the 24750–24800 level, an upside movement is likely towards 24850, 24900, and possibly up to 24950+, which will act as a strong resistance zone for today’s session. Any rally reaching this level may witness a reversal.
On the downside, if Nifty starts trading below 24700, a major downside movement is expected towards 24600, 24550, and potentially 24500– levels in today’s session.

Nightly $SPY / $SPX Scenarios for May 22, 2025 🔮 Nightly AMEX:SPY / SP:SPX Scenarios for May 22, 2025 🔮
🌍 Market-Moving News 🌍
📈 Treasury Yields Surge Amid Weak Bond Auction
U.S. Treasury yields continued their upward trajectory, with the 10-year yield nearing 4.6% and the 30-year yield surpassing 5%, marking the highest levels since early 2023. This increase followed a weak $16 billion auction of 20-year bonds, which attracted less investor demand and sold at higher-than-expected yields. Factors contributing to the rise include fading recession fears, persistent inflation concerns, and growing fiscal worries related to potential tax cut extensions.
📉 Stock Market Declines as Tech Stocks Retreat
The stock market experienced significant losses, with the Dow Jones Industrial Average dropping 1.9%, falling below its 200-day moving average. The S&P 500 and Nasdaq fell 1.6% and 1.4%, respectively.
💼 Snowflake ( NYSE:SNOW ) Reports Strong Earnings
Snowflake Inc. reported record quarterly revenue of $1.04 billion, surpassing expectations. Product revenue increased 26% year-over-year to $996.8 million. The company raised its full-year forecast to $4.325 billion, reflecting a 25% year-over-year increase. Despite a GAAP net loss of $430 million, Snowflake posted an adjusted profit of 24 cents per share, exceeding the 21-cent estimate.
📊 Morgan Stanley Turns Bullish on U.S. Stocks
Morgan Stanley has shifted to a bullish stance on U.S. stocks and bonds, raising its outlook due to signs of market stabilization and improving growth conditions. The bank maintains a base target of 6,500 for the S&P 500 by mid-2026, with a bullish scenario projecting 7,200.
📊 Key Data Releases 📊
📅 Thursday, May 22:
8:30 AM ET: Initial Jobless Claims
9:45 AM ET: S&P Global Flash U.S. Services PMI for May
10:00 AM ET: Advance Services Report (First Quarter 2025)
⚠️ Disclaimer:
This information is for educational and informational purposes only and should not be construed as financial advice. Always consult a licensed financial advisor before making investment decisions.
📌 #trading #stockmarket #economy #news #trendtao #charting #technicalanalysis

TradeCityPro | BCHUSDT Bitcoin Fork Ready to Hit New Highs?👋 Welcome to TradeCityPro Channel!
Let’s dive in and analyze the Bitcoin fork, BCH, to understand why this altcoin is performing much better than the broader market and is being supported at higher levels.
🌐 Overview Bitcoin
Before starting the analysis, I want to remind you again that we moved the Bitcoin analysis section from the analysis section to a separate analysis at your request, so that we can discuss the status of Bitcoin in more detail every day and analyze its charts and dominances together.
This is the general analysis of Bitcoin dominance, which we promised you in the analysis to analyze separately and analyze it for you in longer time frames.
📊 Weekly Time Frame
In the weekly time frame, we see that BCH is in a much better position compared to other altcoins and continues to form higher highs and higher lows!
After hitting the 707 resistance and getting rejected, we’ve been ranging in a large box. However, it’s fair to say that buyers have the upper hand in this box because, after touching the critical 268 support, we engulfed the previous three weekly candles and experienced a sharp move up to 424.
Currently, we’re at a critical point: we could either form a lower high relative to the previous resistance or undergo a mid-term correction and re-enter after breaking 424!
📉 Daily Time Frame
In the daily time frame, the situation is similarly favorable, and BCH is continuing its trend with good momentum. The formation of higher highs and higher lows provides a sense of calm to the uptrend.
After the heavy decline in February, it was natural for us to enter a ranging period before forming a new structure. This happened, and after retesting the 268 support, we started forming higher highs and lows, with our first entry at the 345 level.
Currently, after a rejection from 435, we’ve corrected to 386, which was a low-volume move, technically considered a pullback. If we see a supportive candle at this level, it’s a trigger for a buy, and breaking 435 will be the next trigger!
✍️ Final Thoughts
Stay level headed, trade with precision, and let’s capitalize on the market’s top opportunities!
This is our analysis, not financial advice always do your own research.
What do you think? Share your ideas below and pass this along to friends! ❤️

Bitcoin Potential UpsidesHey Traders, in today's trading session we are monitoring BTC/USDT for a buying opportunity around 102,000 zone, Bitcoin is trading in an uptrend and currently is in a correction phase in which it is approaching the trend at 102,000 support and resistance area.
Trade safe, Joe.

SHIB/USDT Potential UpsidesHey Traders, in today's trading session we are monitoring SHIB/USDT for a buying opportunity around 0.00001420 zone, SHIB/USDT is trading in an uptrend and currently is in a correction phase in which it is approaching the trend at 0.00001420 support and resistance area.
Trade safe, Joe.

AUDCHF: Bearish Reversal Confirmed! 🇦🇺🇨🇭
AUDCHF may return to a global bearish trend.
A breakout of a support line of a rising parallel channel,
bearish CHoCH and a lower high on a daily indicate a changing market sentiment.
I think that the pair may drop lower soon.
Goal - 0.53
❤️Please, support my work with like, thank you!❤️
I am part of Trade Nation's Influencer program and receive a monthly fee for using their TradingView charts in my analysis.

Educational Video: Nifty Outlook-How Technical analysis is done.We have tried to draw a parallel channel on Nifty hourly chart. The chart indicates that we are just below the mid channel line. The mid channel line will act as a resistance if the price is below the same and will act as a support if the price is above it. Right now it is acting as a resistance. Top of the channel always acts as a resistance and bottom of the channel always acts as a support. Additionally there are historic resistances and supports which indicate the other levels which may act as support or resistance. There are also Mother and Father lines (50 and 200 EMA)(EMA = Exponential Moving Average).
To understand in detail how parallel channel works or how supports and resistance are derived or what is Mother, Father and Small Child theory. I would recommend you my book The Happy Candles Way to Wealth creation. By reading this book you can understand all these concepts with ease. You can additionally understand what is fundamental and technical analysis and how to do it. You will also get to understand the dos and the don'ts of investment in equity by reading various chapters on Behavioural Finance. Overall it is a value for money book available on Amazon in Paperback and Kindle version. The book is also available on Google play book and other E-book stores. You can also contact us for getting the copy of it. The Happy Candles way is one of the highest rated books in the category and you can go through the reviews of the book on Amazon before purchasing it.
Based on Parallel Channel, Supports and Resistances, Mother Father and Small child theory resistances and supports of Nifty remain at.
Nifty Resistances Remain at: 24815, 24909, 24977, 25045 and 25116. The channel top resistance for the current parallel channel is around 25372.
Nifty Supports Remain at: 24780 (Mother Line Support), 24679 and 24537. The Channel Bottom support is currently around 24396. 24247 is the most important Father line support.
Shadow of the candles currently is neutral. Indicating Nifty can still go in any direction. A pennant like structure (Triangle is also formed). This indicates that Breakout or Breakdown of this triangle or pennant can take Nifty a long way on either side. Nifty is currently squeezing in the pennant with limited space. Usually when the space is limited a Breakout can happen in either direction.
Disclaimer: The above information is provided for educational purpose, analysis and paper trading only. Please don't treat this as a buy or sell recommendation for the stock or index. The Techno-Funda analysis is based on data that is more than 3 months old. Supports and Resistances are determined by historic past peaks and Valley in the chart. Many other indicators and patterns like EMA, RSI, MACD, Volumes, Fibonacci, parallel channel etc. use historic data which is 3 months or older cyclical points. There is no guarantee they will work in future as markets are highly volatile and swings in prices are also due to macro and micro factors based on actions taken by the company as well as region and global events. Equity investment is subject to risks. I or my clients or family members might have positions in the stocks that we mention in our educational posts. We will not be responsible for any Profit or loss that may occur due to any financial decision taken based on any data provided in this message. Do consult your investment advisor before taking any financial decisions. Stop losses should be an important part of any investment in equity.

+60% gain overnight with Buy & Hold overnight $4 to $6.50 $EDBLEASY 💰 +60% profit overnight with BUY & HOLD Alert sent at market close yesterday $4.00 🚀 this morning it's up at $6.50+
🤑 NASDAQ:EDBL
The technical analysis was simply too good to miss out on, the pop was either going to happen after hours, premarket or right after market open today so it only made sense to get in for after hours to be sure!

GBPCHF: Bullish Move From Trend Line 🇬🇧🇨🇭
I think that there is a high probability that GBPCHF
will pull back from a rising trend line on a daily.
As a confirmation, I spotted a bullish engulfing candle
after its test on an hourly time frame.
Goal - 1.1085
❤️Please, support my work with like, thank you!❤️
I am part of Trade Nation's Influencer program and receive a monthly fee for using their TradingView charts in my analysis.

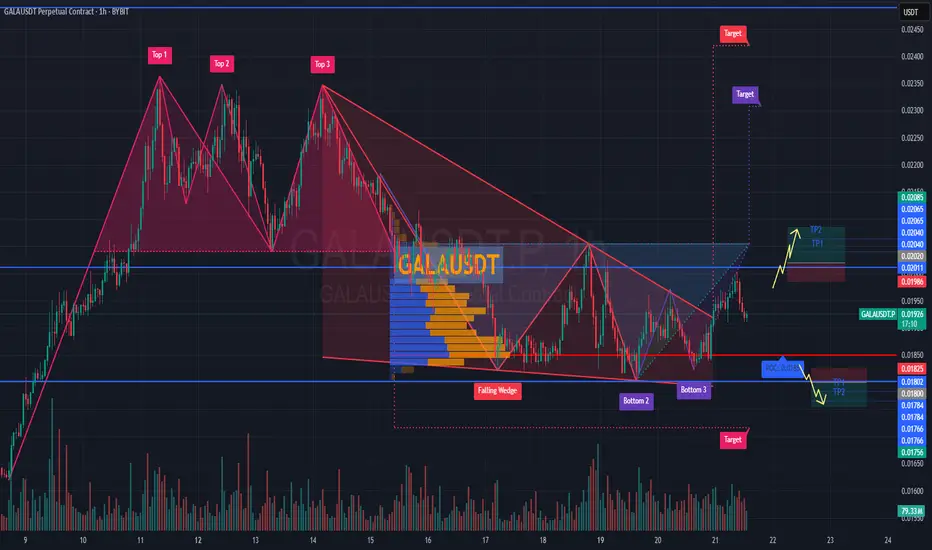
Forecast for #GALAUSDT📉 Forecast for BYBIT:GALAUSDT.P (1H TF)
🕒 Current Situation: The price is in a key decision zone near POC $0.01851, consolidating after a breakout from the Falling Wedge pattern.
➡️ The direction depends on the reaction to this area.
✅ Overview:
➡️ A Triple Bottom (Bottom 1-2-3) pattern is visible — a bullish signal.
➡️ Price broke out of the wedge and is now retesting.
➡️ Two scenarios remain: LONG if support holds or SHORT if it breaks.
📢 Bullish sign: candle wicks down + rising volume on bounce.
🧭 Watch price action and volume near $0.0185–0.0190.
************************
📈 LONG SCENARIO - Conditions: Holding above $0.0190
Entry: BYBIT:GALAUSDT.P from $0.02020
🛡 Stop loss: $0.01986
🎯 TP Targets:
💎 TP 1: $0.02040
💎 TP 2: $0.02065
💎 TP 3: $0.02085
📍 Confirming bullish strength after wedge breakout.
**************************
📉 SHORT SCENARIO - Conditions: Break and close below $0.0185
Entry: BYBIT:GALAUSDT.P from $0.01800
🛡 Stop loss: $0.01825
🎯 TP Targets:
💎 TP 1: $0.01784
💎 TP 2: $0.01766
💎 TP 3: $0.01756
📢 Confirmation: high volume + multiple closes below POC.
⚠️ Losing $0.0185 reactivates the bearish structure toward $0.01700.
🚀 Conclusion: We are in a decision zone.
📍 Hold above POC = bullish setup.
📍 Breakdown = bearish setup.
📢 Wait for confirmation with volume and price reaction BYBIT:GALAUSDT.P
EURUSD | Bullish Pennant Breakout – Retest Before the Target📊 EUR/USD (1H Timeframe)
The EUR/USD pair has shown a textbook example of a bullish pennant formation, which typically occurs during strong uptrends and signals a continuation of the bullish momentum. The price had an impulsive rally prior to the formation of the pennant, indicating a strong underlying bullish sentiment.
Following the rally, the market entered a period of consolidation where price action began to coil between two converging trendlines – this is the pennant structure, marked by lower highs and higher lows.
This tightening price action typically suggests that market participants are pausing to digest the previous move, often leading to another breakout in the same direction – in this case, bullish.
📐 Key Technical Elements Highlighted:
Bullish Pennant Formation:
Characterized by a sharp move up (flagpole) followed by a tight consolidation range (the pennant).
Volume generally contracts during consolidation and expands on breakout, confirming momentum.
Breakout and Retest:
Price has broken above the upper resistance line of the pennant.
Now pulling back for a retest, a healthy technical behavior often seen in strong setups.
This pullback offers a second chance for entry for traders who missed the initial breakout.
Support & Resistance Zones:
SR Interchange Zone (previous resistance turned into potential support).
Minor Resistance Zone above, now likely invalidated by breakout.
These zones are critical in evaluating potential price reaction and risk control.
Projected Target:
Based on the measured move from the pole height of the pennant added to the breakout point, the projected target stands near 1.14315, a level of prior structural interest.
🎯 Trade Plan – Technical Strategy
⚠️ This is a hypothetical scenario for educational purposes. Always manage your risk.
Entry Zone: On confirmation of a successful retest (bullish price action at trendline support)
Stop Loss: Below the pennant’s lower trendline or the SR interchange zone (1.1245 – 1.1260 region)
Target: 1.14315 (based on breakout projection)
Risk-Reward Ratio: Approx. 1:2 to 1:3 depending on entry precision
🔍 Psychological & Market Structure Notes:
A bullish pennant is a sign of accumulation after a strong rally – it tells us that buyers are resting, not gone.
The retest shows institutional behavior: smart money often allows price to come back to a breakout level before driving it higher again, to shake out weak hands and trap late sellers.
Momentum traders and breakout traders often wait for confirmation on the retest to pile in with higher confidence.
📚 Educational Takeaway:
This setup serves as a great case study in:
Continuation patterns (Bullish Pennants)
Breakout-retest behavior
Measured move target projections
Trend confirmation techniques
Market psychology and structure
If you're learning technical analysis, this is a high-probability pattern that occurs across many asset classes including forex, crypto, and stocks.

Gold Completes A Correction Within Bullish TrendGold made another sharp leg to the upside in first half of April, even showed some accelerating price action away from the 3,000 level. This suggests it might have been part of wave three when looking at the Daily and 4-hour time frame, so there can be more upside within a much more extended impulse structure. Possibly already now after blue wave four consolidation shows first signs of a bottom near 3120. Notice that pullback from recent high is in three legs, while price recovered out of wave (C) channel, so looks like new recovery is in the cards.

USDJPY TRADE PLAN – MAY 21 BIG BREAKOUT AHEAD?USDJPY TRADE PLAN – MAY 21 | FED HAWKISH BUT YEN STAYS WEAK – BIG BREAKOUT AHEAD?
USDJPY is entering a critical technical zone as the market weighs the Fed’s persistent hawkish stance against Japan’s passive approach to the Yen’s depreciation. After a strong rally, we are seeing a potential exhaustion with key levels in play.
🌍 MACRO CONTEXT:
FED remains hawkish: Officials continue to support higher-for-longer interest rates to tame inflation → USD remains firm.
Bank of Japan silence: No signs of FX intervention or rate policy shift, causing ongoing weakness in JPY.
Risk sentiment neutral: Risk-off flows are muted; USDJPY remains trapped in a wide range – awaiting macro catalysts.
📊 TECHNICAL OUTLOOK (H2 CHART):
Price is now correcting within a falling channel.
Price broke below the MA200 and rising trendline, now retesting a key support zone at 143.77.
The current range 141.99 – 144.71 is critical – a breakout from either end may dictate the next medium-term direction.
🎯 TRADE SETUPS FOR TODAY:
✅ SCENARIO A – SELL THE RALLY (PRIMARY BIAS):
If price rejects 144.71:
SELL ZONE: 144.70 – 144.71
SL: 145.10
TP: 143.77 → 143.30 → 142.50 → 141.99
→ Key resistance area – price may trigger strong seller interest.
✅ SCENARIO B – SELL ON BREAKDOWN:
If price breaks 143.77 and retests:
SELL ZONE: 143.60 – 143.70 (post-breakdown entry)
SL: 144.10
TP: 142.50 → 142.00 → 141.99
✅ SCENARIO C – SHORT-TERM BUY (LESS FAVORABLE):
If price reacts positively at 141.99 with bullish confirmation:
BUY ZONE: 141.90 – 141.99
SL: 141.50
TP: 142.50 → 143.00 → 143.77
→ Only take this setup if strong reversal signals appear.
🔑 KEY LEVELS TO WATCH:
Resistance: 144.71 – 145.00 – 148.44
Support: 143.77 – 143.30 – 141.99 – 141.20
📌 FINAL THOUGHTS:
USDJPY remains in a volatile consolidation zone, pressured by a hawkish Fed but lacking JPY strength. Watch for PMI data and Fed comments this week for directional cues. Until then, respect the current range and trade with discipline.
📣 Bias favors SELL from 144.71 unless buyers reclaim full control – trade the reaction, not the prediction!

JPYUSD | Head & Shoulders Breakdown Setup | Bearish move Build🔍 Technical Overview
A clear Head & Shoulders pattern has formed on the JPY/USD 8H chart — a well-known bearish reversal setup often signaling a shift from bullish momentum to bearish control. The pattern is confirmed with a left shoulder, higher head, and lower right shoulder, all aligned along a defined neckline acting as key horizontal support.
Currently, the price is retesting both the neckline and a descending trendline, which adds confluence to the bearish bias. If price fails to break back above this resistance zone, we can anticipate a further drop toward the projected target zone.
📌 Key Technical Levels
Head: ~0.007180
Neckline Support: ~0.006660
Retest Area (Confluence Zone): ~0.006940–0.006960
Bearish Target: ~0.006470 (measured from the head to the neckline and projected downward)
Trendline Resistance: Acting as dynamic resistance since the recent high
⚙️ Price Action Insights
Pattern Clarity: The structure of the H&S is clean and symmetrical — a classic sign of distribution and topping out after a bullish rally.
Retest in Play: Price is currently retesting the trendline resistance. Rejection from this area strengthens bearish continuation potential.
Momentum Shift: Bullish pressure is weakening. Lower highs on the right shoulder show buyer exhaustion.
🧠 Mindset & Strategy
This setup demonstrates how patience, pattern recognition, and confluence can align to offer a high-probability trading idea.
✅ Wait for Confirmation: A strong bearish candle off the retest zone or neckline breakdown gives a cleaner short entry.
✅ Risk Management First: Place stops just above the right shoulder or trendline (~0.007000 zone).
✅ Target Logically: The target is not random — it’s derived using the classic measured move technique, matching the head-to-neckline distance.
📋 Trade Idea (Not Financial Advice)
📍 Entry: On rejection at retest zone or confirmed neckline breakdown
🎯 Target: 0.006470
🛑 Stop Loss: Above 0.007000 (trendline/right shoulder area)
⚖️ Risk/Reward Ratio: Minimum 2:1 if entered post-retest confirmation
🧠 Trader’s Note (Minds Insight)
This is where discipline comes into play. Don’t chase the move. Let the pattern complete and confirm. Head and Shoulders formations are among the most reliable reversal patterns — but only after neckline breaks or strong rejections.
This setup teaches traders to trust the process, combine horizontal and diagonal resistance, and let the price action do the talking.

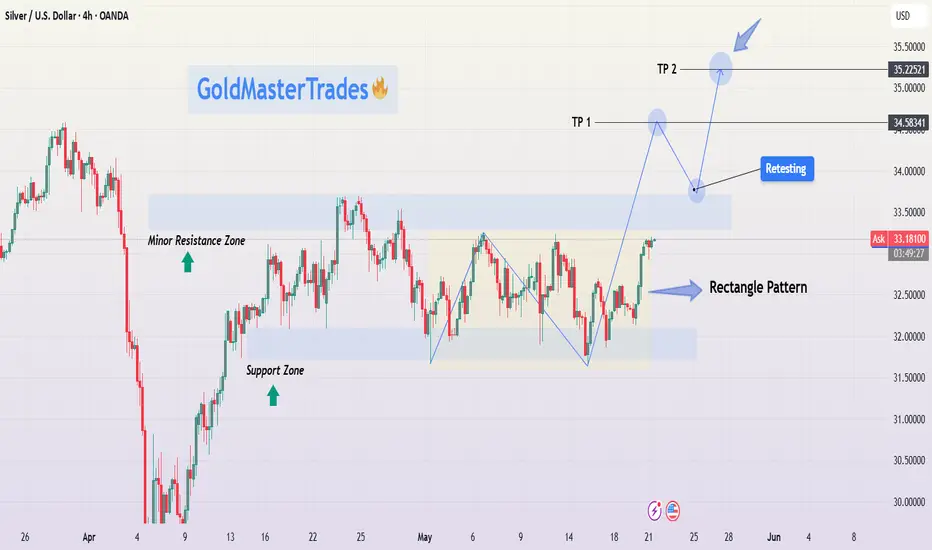
Silver Rectangle Pattern Breakout | XAGUSD Analysis + Target🔍 Technical Overview
Silver has been forming a textbook rectangle consolidation pattern over the past few weeks, bouncing between a clearly defined Support Zone (~$32.10) and Resistance Zone (~$33.40). This range-bound movement indicates accumulation, a phase where smart money typically builds positions before initiating a directional breakout.
Currently, price action shows a breakout attempt toward the upper resistance. If momentum continues, we could see a bullish breakout, followed by a potential retest of the broken resistance (now support). A successful retest would confirm a high-probability setup for a move to higher targets.
📌 Key Technical Zones
Support Zone: ~$32.10
This level has been tested multiple times, with price consistently bouncing higher, signaling strong buyer interest.
Minor Resistance Zone: ~$33.00
Acted as an intermediate ceiling within the rectangle. Once broken, this level became a signpost for bullish continuation.
Main Resistance Zone: ~$33.40
The top boundary of the rectangle; this is the key breakout level.
Target 1 (TP1): $34.58
A logical resistance level based on previous price structure and breakout projection.
Target 2 (TP2): $35.22
A more extended target derived from the height of the rectangle pattern projected from the breakout point (measured move).
⚙️ Price Action Insights
Rectangle Pattern Behavior: Price ranged within horizontal support/resistance, forming consistent highs and lows — a strong signal of accumulation.
Momentum Shift: Recent bullish candles and higher lows suggest buying pressure is increasing.
Breakout in Progress: Price is currently pushing above the upper rectangle boundary. A confirmed breakout candle close followed by a retest would provide a higher-probability entry opportunity.
Retest Strategy: Retests are critical for confirmation. A pullback to ~$33.40 with rejection signals (e.g., bullish engulfing, pin bar) would strengthen the case for further upside.
🧠 Mindset & Strategy Explanation
This setup represents patience, structure, and discipline in trading:
✅ Wait for the Pattern : Rectangle patterns often trap impatient traders. Waiting for a confirmed breakout and retest gives higher-quality entries.
✅ Risk Management is Key : Use the structure of the rectangle to define risk. Stops should be set just below the last swing low or inside the range.
✅ Targeting with Precision: TP1 and TP2 are not random — they’re derived from prior resistance levels and pattern projections. This keeps your trading logical, not emotional.
✅ Mind Over Market: Don’t chase breakouts. Wait for confirmation. The retest is often your friend in swing trading setups like this.
📋 Trade Idea (Not Financial Advice)
📍 Entry: On confirmed breakout above $33.40 or retest of this level with bullish confirmation.
🎯 Target 1: $34.58 (partial take profit suggested)
🎯 Target 2: $35.22 (measured move projection)
🛑 Stop Loss: Below $32.70 (under recent support structure)
🔁 Optional: Trail stop loss after TP1 to lock in profits as TP2 approaches.
🧠 Final Thoughts for Traders
This chart provides a clean example of how price consolidates before expansion. The rectangle pattern allows for easy identification of entry/exit zones and offers a solid risk-to-reward setup. Whether you're a new trader learning to spot consolidation patterns or a seasoned pro looking for low-risk, high-reward setups — this XAGUSD formation is one to watch.
Keep an eye on volume and candle structure around the breakout zone. Confirmation is key. Discipline is everything.