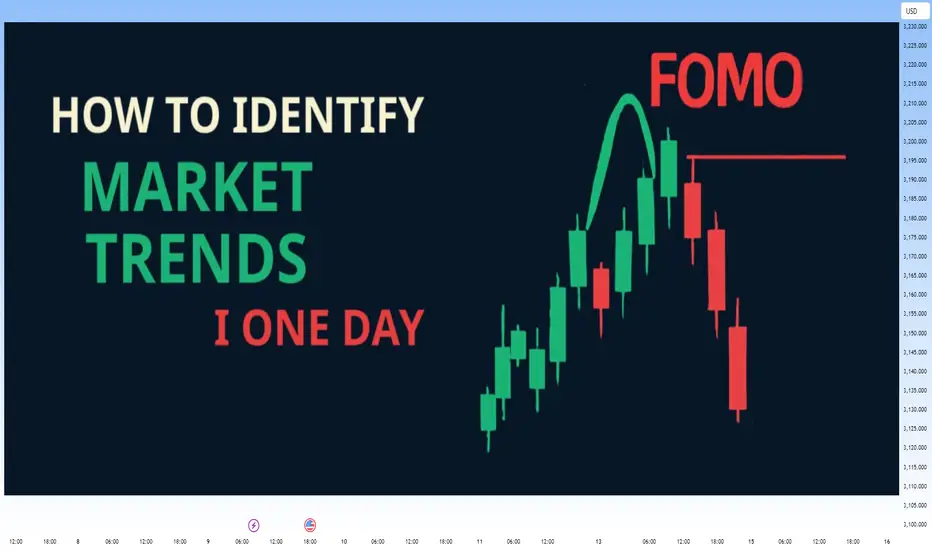
Analyzing the Market with Fundamental and Technical AnalysisAnalyzing the Market with Fundamental and Technical Analysis
In addition to technical analysis, it's important to consider fundamental factors that could influence the market. News releases, economic reports, and central bank decisions can significantly impact price movements.
Fundamental Analysis:
Keep an eye on major economic indicators like NFP, CPI, and interest rate decisions. These factors can drive the market and change its trend direction.
Technical Analysis:
Use tools like EMA, Fibonacci, and Price Action to confirm the trend and identify entry points.
For daily updates and comprehensive market analysis, join my MMFLowTrading TradingView channel, where I combine both technical and fundamental analysis to give you the most accurate insights.
Conclusion:
Identifying market trends in one day doesn’t have to be complicated. By using the right tools like EMA, Fibonacci, and Price Action on TradingView, you can make better trading decisions every day. To take your trading to the next level, join my MMFLowTrading TradingView channel for daily updates, real-time trend analysis, and expert trading signals.
Ready to start trading with precision? Join my MMFLowTrading TradingView channel today for daily market insights and trading setups. Stay updated with real-time analysis, get actionable trading signals, and take your trading skills to the next level. Follow me now on TradingView!
Technical Analysis
Is a Reversal on the Horizon or a Deeper Correction? 🔘Gold Faces Strong Resistance at 3300 – Is a Reversal on the Horizon or a Deeper Correction? ⭐️
Gold has recently faced a significant price correction after bouncing off key resistance levels. As geopolitical events settle and economic data comes in, the market is now testing crucial support levels. Today’s session could provide important insights into whether gold will maintain its bullish momentum or continue to correct further.
🔹Market Overview – USD Rebounds, Creating Short-Term Pressure on Gold
The US dollar has seen a strong rebound following positive developments in the global trade talks. Several key agreements between major nations, including the US, have been signed, which seem to support the USD in the short term. This has put downward pressure on gold, as traders shift their focus towards a stronger dollar and risk appetite returning to the market.
🔹US inflation data has come in lower than expected, creating room for the Fed to hold off on rate hikes, which helps the dollar further.
🔹FOMC meeting minutes later this week could reveal insights into the Fed's stance on interest rates, which could be key for market direction.
🔹Geopolitical tensions are cooling off slightly, which has reduced demand for safe-haven assets like gold.
🔹Technical Analysis – Gold in a Range-Bound Market, Testing Key Levels
On the H1 chart, gold is forming a clear downward channel between 3360 and 3290, suggesting that the price could continue its correction within this range. If the price stays within this zone, we might see a deeper pullback toward the 3250 region.
However, as always, waiting for confirmation signals before entering any trades is crucial. The false breakout risk is high when the price moves quickly and without clear confirmation from higher timeframes.
🔹Buy Bias in the Short-TermGiven the current technical structure, a buy bias seems more likely than further selling. The market may test 3320-3325 in the near term, with the potential to bounce back if the buying momentum continues to build. Additionally, the rejection wick on the D1 candle from yesterday suggests that sellers are losing control, and we may see more buying pressure in the coming sessions.
🔹Resistance and Support Levels to Watch:
🔺Key Resistance Levels: 3302 – 3310 – 3324 – 3335 – 3361
🔻Key Support Levels: 3275 – 3259 – 3248
⬜️Trading Strategy – Buy and Sell Zones
🔺BUY ZONE:3250 – 3248
🔹Stop Loss: 3244
✔️Take Profit: 3254 → 3258 → 3262 → 3266 → 3270 → 3280 → ????
🔺SELL SCALP: 3303 – 3305
🔹Stop Loss: 3310
✔️Take Profit: 3298 → 3294 → 3290 → 3286 → 3280 → 3270 → 3260
🔺SELL ZONE:3334 – 3336
🔹Stop Loss: 3340
✔️Take Profit: 3330 → 3326 → 3320 → 3315 → 3310 → 3305 → 3300 → ????
🕖Important Notes for Today: FOMC and Trade Policy Updates
With FOMC minutes and other important trade policy updates expected today, it’s crucial to stay alert for any sudden changes in market sentiment. Always ensure that you are adhering to your TP/SL levels to safeguard your account.

GH 3D: breakout forming inside ascending channelThe price of GH continues consolidating within the top of an ascending channel, confirming bullish structure. The rectangular accumulation has lasted for over three months, with price staying above all major EMAs and MAs - a strong trend confirmation. On the last impulse, volume increased, and now the price is compressing again. A breakout with a retest would serve as a valid entry. First target lies near 61.38, second at 73.66, and third at 87.37 - aligned with the upper range of the medium-term Fibonacci extension. Fundamentally, GH remains a promising biotech pick amid sector rotation and potential Fed easing. EMAs and MAs sit below price, and D/A supports the breakout scenario. Waiting for confirmation before entering.

NASDAQ Potential DownsidesHey Traders, in today's trading session we are monitoring NAS100 for a selling opportunity around 22,750 zone, NASDAQ is trading in a downtrend and currently is in a correction phase in which it is approaching the trend at 22,750 support and resistance area.
Trade safe, Joe.

Gold To The Basement? Week Ahead with Bearish Bias by PhoenixFX🌟 Welcome to Phoenix FX’s Intraday Pulse! 🌟
Hello, Phoenix FX family! 👋 I’m thrilled you’ve joined us for today’s TradingView chart breakdown. Our focus? Intraday opportunities—spotting those high-probability setups you can enter, manage, and leave to run whilst you concentrate on the things you love doing.
Here’s what you’ll find in this analysis:
Key Levels & Zones: Support, resistance, and Fair Value Gaps that matter on the smaller timeframes.
Price-Action Clues: Exact candlestick patterns and momentum signals to watch for your next entry.
Trade Triggers & Targets: Clear criteria for when to get in, where to take profits, and how to manage your risk.
Whether you’re hunting quick scalps or tactical swing moves, our goal is simple: help you trade with confidence, clarity, and community support. Got a different view or a fresh idea? Drop it in the comments—after all, “each one, teach one.” 😉
Let’s dive into the charts and make today’s market moves count! 🚀📈
Donald Trump’s presidency continues to exert outsized influence on gold through three main channels: trade policy uncertainty, fiscal stimulus (and resulting deficits), and shifts in safe-haven demand. Here’s how each factor has played out—and what it could mean for gold going forward:
1. Trade-War Uncertainty
What’s Happening: The Trump administration’s aggressive use of tariffs—including recent 25% duties on goods from Japan and South Korea—has periodically roiled markets and driven investors into gold as a safe haven. On July 7, gold pared losses after tariff news, as traders sought refuge despite a firm dollar.
Looking Ahead: If further tariff escalations or retaliations emerge, expect renewed spikes in gold. Conversely, any de-escalation or trade-deal breakthroughs could sap that safe-haven bid.
2. Fiscal Stimulus & Deficits
What’s Happening: Senate Republicans recently passed a Trump-backed tax‐and‐spending package projected to add $3.3 trillion to the U.S. deficit. Larger deficits—especially when financed by the Fed—tend to stoke inflation expectations, which bolsters gold’s appeal as an inflation hedge.
Looking Ahead: Continued large-scale stimulus or fresh tax cuts without offsetting revenue measures could keep real yields low (or negative), a classic tailwind for gold.
3. Safe-Haven Flows & Investor Positioning
What’s Happening: Despite peaking at record highs earlier this year, gold remains up roughly 30% since November, driven largely by investor fears around Trump’s policy unpredictability and geopolitical tensions.
Looking Ahead: Should Trump-era uncertainty persist—whether around trade, foreign policy, or domestic turmoil—gold is likely to retain its status as a portfolio diversifier and crisis hedge. A sustained drop in U.S. real rates or fresh bouts of market volatility would reinforce that trend.
🎯 Outlook Summary
Bullish Drivers: Ongoing trade-war rhetoric, larger deficits, and any new geopolitical flashpoints.
Bearish Risks: Clear resolution of major trade disputes, a pivot by the Fed toward earlier rate cuts (reducing real‐rate support for gold), or diminished investor fear.
------------------------------------------------------------------------------------------
PhoenixFX price action analysis based on the Daily time frame
🔴 Primary Resistance (Daily)
Zone: $3,348 – $3,400
Why It Matters:
Multiple daily closes have stalled here, leaving a clear Fair-Value Gap (dashed purple). Sellers are likely to defend this range until we see a decisive daily close above $3,400.
📉 Bearish Bias – Short Setups
Short at Resistance
Entry: Bearish daily reversal candle (engulfing, pin-bar) in $3,348–$3,400
Targets:
TP1: $3,290 (50% of Primary Buy Zone)
TP2: $3,250 (Primary Buy Zone low)
TP3: $3,172 (Secondary Buy Zone high)
Stop-Loss: Above $3,420
Breakdown Short
Trigger: Daily close below $3,250 (Primary Buy Zone low)
Entry: On the open of the next daily candle after close below $3,250
Targets:
TP1: $3,172 (Secondary Buy Zone)
TP2: $3,026 (Final Buy Zone 50% level)
Stop-Loss: Above $3,290
🔵 Potential Long Opportunities
Defensive Long (Aggressive)
Entry: Bullish daily rejection candle in $3,250–$3,290
Targets:
TP1: $3,348 (short-term resistance)
TP2: $3,400 (key resistance)
Stop-Loss: Below $3,230
Trend-Reversal Long (Ultra-Conservative)
Trigger: Daily close above $3,400
Entry: Open of the next daily candle after the close above $3,400
Targets:
TP1: $3,450
TP2: $3,500+
Stop-Loss: Below $3,360
📊 Week-Ahead Scenarios
Bearish Scenario (High Probability):
Price remains capped under $3,400.
Look for a bearish signal in $3,348–$3,400 to initiate shorts.
A break below $3,250 extends the move into deeper demand zones ($3,172 → $3,026).
Bullish Counter-Trend (Lower Probability):
Strong daily rejection candle in $3,250–$3,290 could spark a relief rally.
Short-term longs can target $3,348 and $3,400—ideal for quick swing trades.
Only a sustained daily close above $3,400 shifts the bias back to the upside.
Just a Heads-Up:
This is my take on the charts—not gospel, not financial advice, and definitely not a crystal ball 🔮.
Trading is part skill, part patience, and part “what just happened?” 😅
We all see things a little differently, and that’s the beauty of it. So if you’ve got a hot take, wild theory, or just want to drop some chart wisdom—hit the comments!
Let’s grow, learn, and laugh through the madness together. 🚀📈
Each one, teach one.
— Phoenix FX Team 🔥🦅

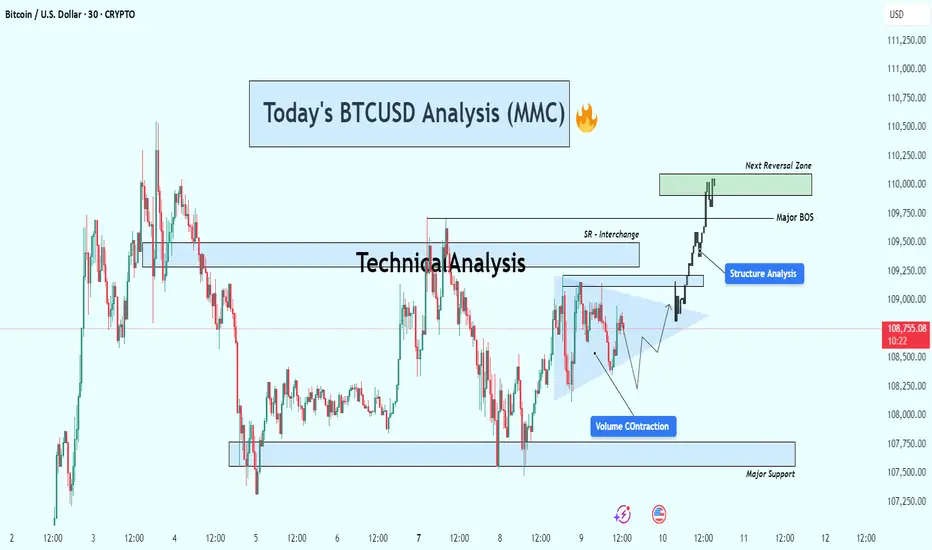
BTCUSD Breakout Confirmed – Targeting Next Reversal ZoneBitcoin (BTC/USD) is currently trading around $108,700, showing strong bullish momentum after breaking out of a consolidation structure. Price action has shifted significantly, with clear structural developments pointing toward continued upside — but not without caution around the next reversal zone.
🔍 Key Technical Insights:
🔹 1. Volume Contraction Triangle (Bullish Breakout)
The chart initially shows a volume contraction pattern forming a symmetrical triangle.
This pattern is often associated with market compression — a setup where smart money accumulates before a breakout.
BTC broke out of the triangle with strong bullish candles, confirming buyers have stepped in with conviction.
🔄 2. Structure Shift & Break of Structure (BOS)
A major BOS (Break of Structure) occurred as price broke previous swing highs, confirming a bullish market structure.
This BOS zone now acts as a potential support area if BTC pulls back.
A short-term SR interchange zone (Support becomes Resistance) was also respected and flipped again to support during the breakout — a clear sign of structural strength.
🧭 3. Next Reversal Zone – Supply in Sight
Price is approaching a major supply/reversal zone between $109,750 and $110,250.
This zone has previously shown strong selling interest.
Traders should watch for rejection or continuation patterns within this zone — such as bearish divergence, exhaustion candles, or confirmation of resistance.
🛡 4. Major Support Level
Below current price, a major support zone around $107,500–$107,800 remains intact.
This zone has provided a solid base during past consolidations and would be the first area of interest for buyers if a retracement occurs.
📌 Strategy Plan:
🔼 For Bullish Traders:
Those already in the breakout can hold with targets toward $110,000–$110,250.
If not in yet, wait for a retest of BOS/SR zone (~$109,000) for a safer re-entry.
Consider partial take-profits within the green reversal zone.
🔽 For Bearish Traders:
Watch for price exhaustion or a fake breakout in the reversal zone.
Potential short setups could form only if price fails to hold above the BOS zone and prints a lower high.
🔧 Technical Summary:
✅ Structure: Bullish Break of Structure confirmed
🔺 Momentum: Strong upside following volume contraction
📍 Next Key Resistance: $110,000–$110,250
📉 Major Support: $107,500–$107,800
⚠️ Caution Zone: Reversal area ahead – watch price action closely
Conclusion :
Bitcoin looks set to challenge the $110K psychological level as buyers remain in control. However, the reversal zone above is critical. A clean break and hold above it could open doors to further highs, while rejection here may trigger short-term pullbacks or range-bound conditions.
CADCHF BUY BIASConfluence 1 - “Daily Low Sweep”
• A liquidity sweep of a previous daily low occurred.
• This move typically indicates stop hunts and smart money accumulation, potentially setting up for a bullish reversal.
Confluence 2. Demand Zone (Grey Box)
• Area where price reacted after the sweep.
• Range: approximately 0.58100 – 0.58200
• Price currently respecting this zone, indicating potential bullish order block behavior.
🧠 Projected Price Path
The sketched movement indicates a plan for:
1. Break above current resistance
2. Pullback into breakout area (possibly retesting the demand)
3. Bullish continuation to 0.58470 and ultimately to 0.58800

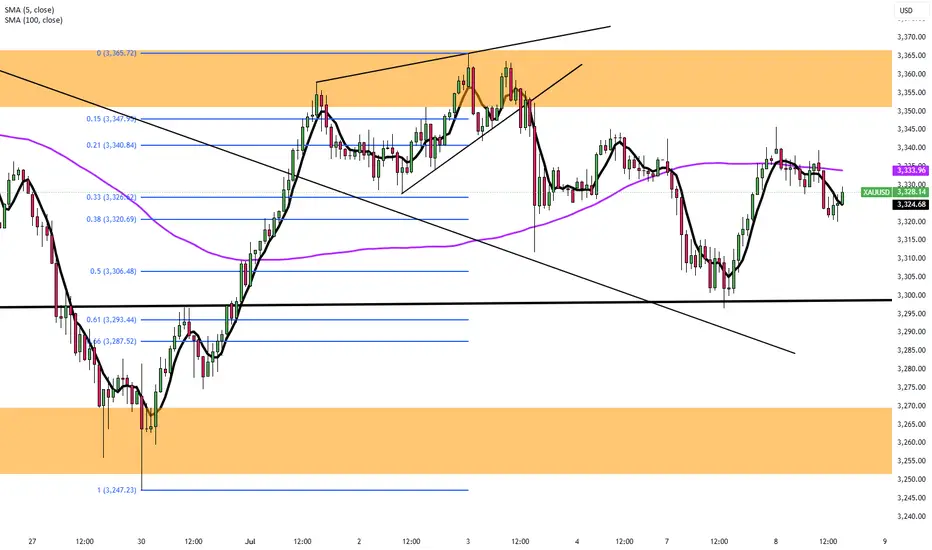
Gold (XAU/USD) Technical Analysis : Structural Analysis + TargetGold is currently trading near $3,292 on the 30-minute timeframe, showing classic signs of accumulation and compression within a well-respected descending channel. The current price action is approaching a critical decision zone, and the market is offering potential clues for both short-term and swing traders.
🔎 Detailed Breakdown of Chart Elements:
🔷 1. Descending Channel & Dynamic Support
Gold has been moving inside a falling channel, with price repeatedly reacting to both the upper and lower boundaries.
The lower boundary of the channel, currently acting as support, has been tested multiple times, suggesting a strong buying interest at this level.
This channel also aligns with the broader downtrend structure, giving sellers confidence while also creating interest for counter-trend buyers looking for reversal setups.
📐 2. Trendline Pressure and Compression
A downward sloping trendline, drawn from the recent swing highs, continues to apply bearish pressure.
Price is squeezing between the channel support and this descending trendline — a tight range compression, which often precedes a volatile breakout.
The analysis notes: “We have to wait for a trendline breakout” – this is a crucial technical signal that will determine the next move.
🚧 3. Break of Structure (BOS) Zones
Two potential bullish BOS (Break of Structure) levels have been identified:
Minor BOS (~$3,300):
A break above this level may signal short-term bullish intent and invalidate minor lower highs.
Early confirmation for buyers to enter with tight risk management.
Major BOS (~$3,310):
This is the key swing high which, if broken, would invalidate the current bearish structure and flip market sentiment bullish.
A strong bullish candle closing above this level could signal the start of a larger upward leg.
📍 4. Next Reversal Zone (Supply Area: $3,320 – $3,330)
This zone represents a strong supply area where previous price action saw heavy selling.
If bulls manage to clear the BOS zones, this area becomes the next target/resistance.
Price reaching this level could lead to a pullback, making it an ideal area for partial take-profits or reassessment of continuation trades.
📈 5. Scenario Planning & Strategy
✅ Bullish Bias (If Breakout Occurs):
Wait for a confirmed breakout above the trendline and Minor BOS with volume.
Ideal long entry would be on the retest of the trendline (now acting as support).
First target: Major BOS, then extend to the Reversal Zone.
Stop-loss can be placed below the channel support or latest swing low.
🚫 Bearish Continuation (If No Breakout):
If price fails to break above the trendline and continues to reject at resistance, sellers may look to short the retest of the trendline.
Targets can be set at the channel's lower boundary or previous lows.
Confirmation: Bearish engulfing patterns, rejection wicks, or divergence.
🧠 Technical Summary & Outlook
Gold is currently in a neutral to slightly bullish consolidation, showing early signs of demand at the bottom of the channel. The market is in "wait-and-watch" mode — traders should focus on the trendline breakout, which will serve as the trigger for directional bias.
The structure is clean, zones are well defined, and potential is high for both scalping and intraday setups. Traders are advised to stay patient and follow price action confirmation before entering trades.
📌 Key Levels to Watch:
Support Zone: $3,280 – $3,285 (Channel Base)
Trendline Resistance: ~$3,294–$3,296
Minor BOS: ~$3,300
Major BOS: ~$3,310
Reversal Zone (Supply): $3,320 – $3,330

EURGBP 1D: This isn't a breakoutEURGBP 1D: This isn't a breakout — it's a deep reaction before the real move
EURGBP continues to form a textbook bullish megaphone, a structure designed not to trend, but to destabilize — forcing liquidity on both sides while smart money quietly positions. Two touches above (January and April), two below (February and May) — clean geometry, expanding volatility. Price is now reacting from the lower boundary, but we are still inside the pattern — and that matters.
The reaction zone sits right on the 0.786 Fibonacci level, near 0.8350, precisely where price meets the lower trendline and the 200-day moving average. The bounce didn’t come from noise — it came from confluence. Candle structure is clean, volume slightly expands — not panic, but controlled demand. As long as price holds above the MA200, the scenario remains intact. A break below kills the setup — but that hasn’t happened.
We’re not in breakout mode — yet. But price action is shifting. Pullbacks are weak, candles are full-bodied, and sellers don’t press. Momentum indicators confirm early recovery, but the real signal lies in how price holds its ground at key structure without struggle. Buyers aren’t running — they’re holding position.
If the market pushes above 0.8430–0.8480 and confirms — acceleration begins. Until then, we remain in balance. Every candle is a stress test — and so far, the structure is holding strong. If smart money controls 0.8350, the breakout won’t just be bullish — it’ll be aggressive.

#SENSEX Intraday Support and Resistance Levels - 09/07/2025Sensex is expected to open slightly gap up near the 83500–83600 range, showing positive momentum as it breaks out from its recent consolidation zone. A sustained move above this level could trigger further upside, with immediate targets seen at 83800, 83950, and 84100+ levels. This zone will act as a crucial resistance-turned-support for the session.
However, if the index fails to hold above 83500 and slips below 83400, it may enter a corrective phase. A breakdown below 83400 could lead to a downward move toward 83050, 82900, and possibly 82800-. Overall, trend remains positive above 83600, and traders should watch for confirmation in the opening session.

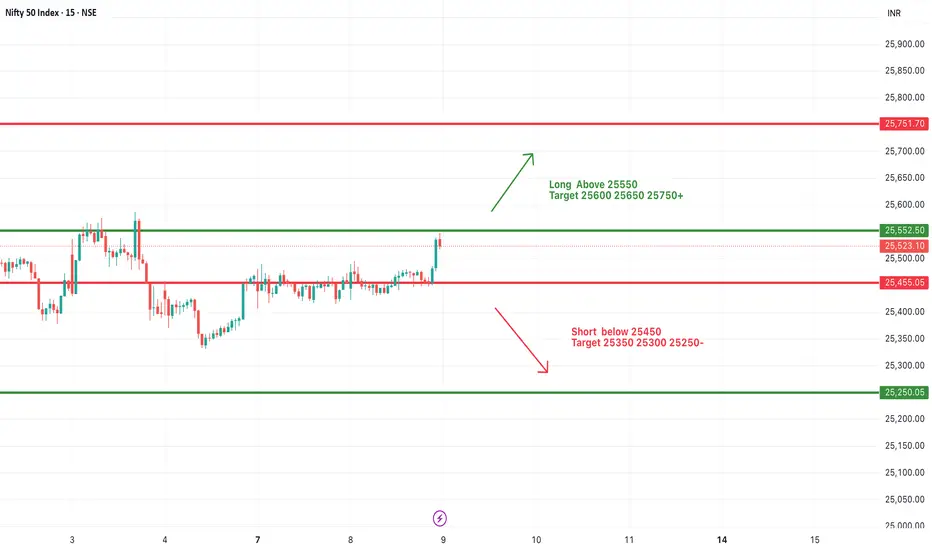
#NIFTY Intraday Support and Resistance Levels - 09/07/2025Nifty is expected to open slightly gap up around the 25500–25520 zone, showing positive momentum from the previous day’s breakout above its recent consolidation range. If the index sustains above the 25550 level, we can expect bullish continuation toward the upside targets of 25600, 25650, and 25750+ levels. This zone may act as an intraday breakout trigger.
On the downside, 25450 will now act as immediate support. Any sharp move below 25450 could invite selling pressure, and we may see a downside slide toward 25350, 25300, and 25250-. The trend remains mildly bullish above 25550, while below 25450 the trend may turn weak intraday.
BTCUSDT – Ready to Launch from Accumulation Zone?BTCUSDT is consolidating around the $101,000 FVG zone – a previously strong launchpad. Price structure remains bullish, forming higher lows and showing a healthy throwback pattern.
If the $101,448 level holds, the next target could be $116,000 – a potential 14% rally in two weeks.
Fundamentals support the upside: expectations of Fed rate cuts and renewed ETF inflows are fueling fresh momentum for Bitcoin.
Still, watch for price action confirmation – and always manage your risk!

XAUUSD – Drifting Toward the “Eye of the Storm”Gold is currently trading right above the critical support zone at 3,220 – a level that successfully held prices two months ago. The ongoing decline remains well within a clear downtrend line that has persisted since early June. Every breakout attempt has been firmly rejected around the 3,337 level.
The price structure is forming lower highs, while multiple Fair Value Gaps (FVGs) appearing above indicate strong distribution pressure. If XAUUSD breaks below the 3,220 area, a further slide toward 3,160 is likely – a zone loaded with dense liquidity waiting below.
Post-Nonfarm news has eased bearish pressure on the USD, but the upcoming U.S. CPI release could be a game-changer. If inflation data comes in lower than expected, gold may lose the support of rate-cut expectations, paving the way for a deeper fall.
Key Zone to Watch: If 3,220 holds, a short-term technical rebound may occur. But if it breaks, closely monitor price behavior near 3,160.

Nightly $SPY / $SPX Scenarios for July 9, 2025🔮 Nightly AMEX:SPY / SP:SPX Scenarios for July 9, 2025 🔮
🌍 Market-Moving News 🌍
📦 Tariff Pause Extended to August 1
President Trump delayed the July 9 tariff deadline, pushing negotiations into early August. Markets reacted with muted volatility, suggesting growing comfort that deals will be struck—yet widespread uncertainty remains
💵 Junk Bonds Rally Amid Tariff Tangling
Despite ongoing tariff risks, investors are doubling down on U.S. high-yield (junk) bonds. They anticipate the Fed may refrain from tightening further—favoring spread-tightening to around 7–8% yields—reflecting confidence in credit quality
🏦 Fed Faces Tough Call on Rate Path
New business surveys show conflicting signals: mixed revenue outlooks, cautious spending, and ongoing tariff pressures. The Fed must weigh slower growth against inflationary risks—keeping the door open to rate cuts in the autumn but unlikely before September
📊 Equities Firm Amid Tariff Uncertainty
Stocks showed resilience—S&P 500 and futures held position—after Monday’s tariff-triggered dip. Dip-buying and expectations of extended trade talks kept markets steady despite policy noise
📊 Key Data Releases & Events 📊
📅 Wednesday, July 9:
All Day – Ongoing U.S.–tariff negotiations; markets focused on any progress toward formal deal-making or extension terms.
Midday – Watch for headlines on tariff letters to 14 countries and any movement in trade discussions.
⚠️ Disclaimer:
This information is for educational and informational purposes only and should not be construed as financial advice. Always consult a licensed financial advisor before making investment decisions.
📌 #trading #stockmarket #economy #tariffs #Fed #fixedincome #credit #technicalanalysis

Nike Looks Ready — A Smart Time to Consider InvestingOn the monthly chart, NIKE has been in a downtrend since November 2021, but the signs are pointing toward a potential trend reversal. Here's why I believe the bottom may already be in:
✅ MACD Histogram shows a strong positive divergence, signaling weakening bearish momentum.
✅ The RSI downtrend line has been broken and successfully retested, confirming bullish strength.
✅ A clear hammer candle has formed at a historical wide support zone, showing strong demand.
Now, price is facing three consecutive resistance levels — and with each breakout, the next zone becomes the new target, (87.5 → 102 → 122).
The structure suggests a step-by-step move higher if momentum holds. Keep an eye on the breakout above the descending trendline — that’s where things could accelerate.

$1 to $2.70 Swing Pick +150% gain so far in a weekHere is updated chart from what I shared with you past week on NASDAQ:VOR
Awesome runner!

WTI CRUDE OIL (USOIL): More Growth Ahead
Crude Oil broke and closed above a significant resistance.
The price is now retesting that.
I think that the market is going to rise.
Next resistance - 68.5
❤️Please, support my work with like, thank you!❤️

Quick take on DAXTariffs, no tariffs, tariffs, no tariffs... Let's look at the technical picture...
XETR:DAX
MARKETSCOM:GERMANY40
Let us know what you think in the comments below.
Thank you.
77.3% of retail investor accounts lose money when trading CFDs with this provider. You should consider whether you understand how CFDs work and whether you can afford to take the high risk of losing your money. Past performance is not necessarily indicative of future results. The value of investments may fall as well as rise and the investor may not get back the amount initially invested. This content is not intended for nor applicable to residents of the UK. Cryptocurrency CFDs and spread bets are restricted in the UK for all retail clients.

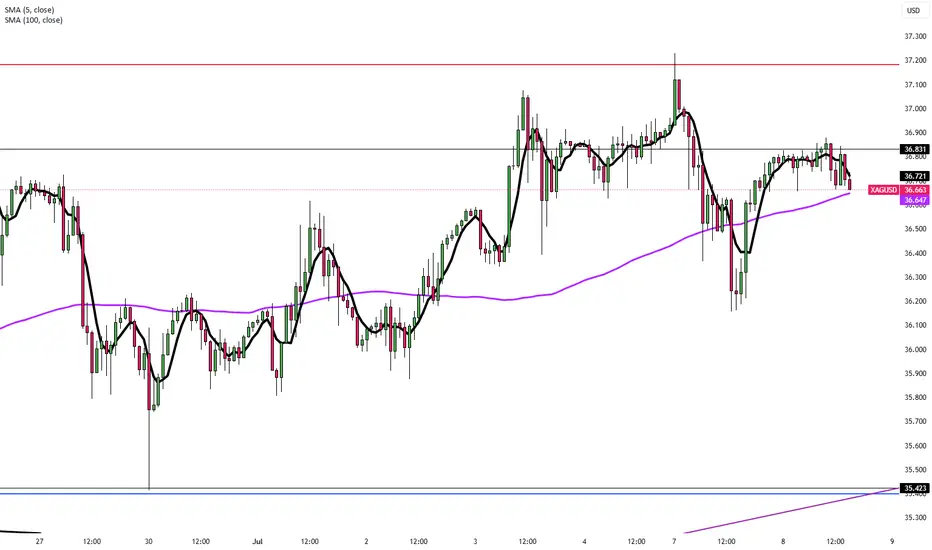
Silver Holds Near $36.80 on Tariff FearsSilver remains steady just below $37.00, hovering around $36.80 in Tuesday’s Asian session after a sharp rebound from the $36.15 level seen late Monday. The metal continues to trade in a tight range as conflicting market signals keep traders cautious.
Global trade tensions and geopolitical uncertainties, fueled by the U.S.’s upcoming tariffs on multiple countries and its hardline stance against BRICS-aligned nations, have elevated market risk perception. This has sparked a modest uptick in safe-haven demand, offering limited support to silver.
The strength of the U.S. Dollar and uncertainty surrounding future interest rate decisions are capping silver’s upside potential. Market participants remain focused on incoming economic data and central bank signals for clearer direction.
In the near term, silver is expected to stay volatile and highly reactive to geopolitical and economic headlines.
Resistance is at 37.50, while support holds at 35.40.
Gold Rebounds Toward $3,350Gold (XAU/USD) rebounded from a five-day low of $3,297, climbing toward $3,350 after Trump announced 25% tariffs on Japan and South Korea effective August 1, with 12 more countries receiving similar tariff warnings ranging between 25% and 40%. The rising risk of a global trade war fueled safe-haven demand, though gold’s gains were capped by simultaneous US Dollar strength.
Resistance is at $3,365, while support holds at $3,300.
GBP/USD Climbs as Trump Targets 14 NationsGBP/USD edged higher to around 1.3630 during Tuesday’s Asian session, posting a modest recovery after two straight days of losses. The British Pound found support as the US Dollar weakened in response to heightened market caution following President Donald Trump’s announcement of new tariff rates targeting 14 countries that have not yet finalized trade agreements with the US.
The Trump administration introduced a 25% tariff on imports from Japan and South Korea, warning of further escalation if these countries retaliate. Other nations affected include Malaysia, Kazakhstan, and Tunisia, each facing a 25% tariff, while South Africa will face a 30% tariff. Tariffs on Laos and Myanmar will rise to 40%, Indonesia faces 32%, Bangladesh 35%, and both Thailand and Cambodia will see tariffs of 36%.
Additionally, Trump signed an executive order delaying the enforcement of these new tariffs until August 1, allowing more time for negotiations, according to Bloomberg.
On social media, Trump issued a firm warning that any country aligning with the anti-American stance of the BRICS bloc would face an extra 10% tariff, stating unequivocally: “There will be no exceptions to this policy.”
Resistance is at 1.3640, while support holds at 1.3500.

EUR/USD at 1.1750 as EU Pushes Trade DealEUR/USD trades around 1.1745 in Tuesday’s Asian session, supported by strong Eurozone retail sales for May. The Euro benefits as the EU aims to finalize a preliminary trade deal with the US this week, seeking to maintain a 10% tariff beyond the August 1 deadline while negotiations continue. The proposed agreement would keep the 10% base tariff but exempt sensitive sectors like aviation and alcohol, which helps lift market sentiment toward the Euro.
Eurostat data showed retail sales rose 1.8% year-on-year in May, beating expectations of 1.2% but slowing from April’s 2.7%. Monthly sales fell 0.7%, matching forecasts.
Resistance for the pair is at 1.1830, while support is at 1.1730.

Yen Falls After Trump's 25% Tariff on JapanThe Japanese yen weakened beyond 146 per dollar on Tuesday, hitting a two-week low after President Trump confirmed a 25% tariff on Japanese imports starting August 1, lower than the earlier 35% threat but still above the standard 10%. Japan’s Prime Minister Ishiba pledged to keep negotiating for a favorable outcome. Although Japan’s May current account surplus came in stronger than expected, disappointing wage growth limited hopes for further Bank of Japan rate hikes, adding pressure on the yen.
Key resistance is at 146.20; major support at 144.85.
