GBPJPY Potential UpsidesHey Traders, in the coming week we are monitoring GBPJPY for a buying opportunity around 193.300 zone, GBPJPY is trading in an uptrend and currently is in a correction phase in which it is approaching the trend at 193.300 support and resistance area.
Trade safe, Joe.
Technicalanlaysis

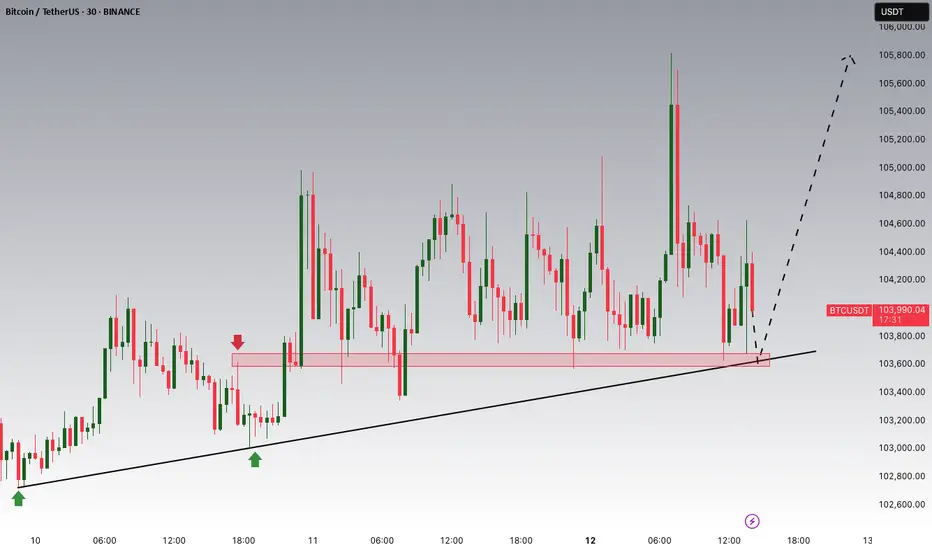
Bitcoin Potential UpsidesHey Traders, in today's trading session we are monitoring BTCUSDT for a buying opportunity around 103,000 zone, Bitcoin is trading in an uptrend and currently is in a correction phase in which it is approaching the trend at 103,000 support and resistance area.
Trade safe, Joe.
DOTUSDT Potential UpsidesDOTUSDT is currently trading within a broader uptrend and is in the midst of a correction. Price action is approaching the $4.60 zone, a key support and resistance level that aligns with the trend structure. This area may act as a pivot point for future movement, as the market continues to respect the prevailing bullish momentum.
Trade safe, Joe.

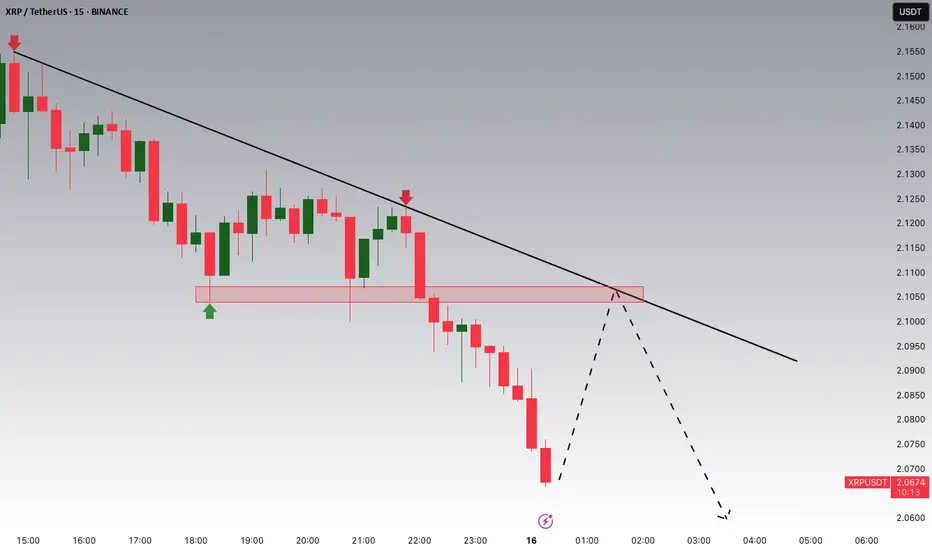
Watching $2.10 for a Potential XRP ReversalRipple (XRP) is currently trading within a clear downtrend, and we’re now seeing a corrective move that’s pushing price back toward a key zone around $2.10, which has acted as both support and resistance in the past.
This area aligns closely with the descending trendline, making it a strong confluence zone to watch for a potential bearish reaction.
CHFJPY Is Trading Under a Strong Japanese Yen pressureHey Traders, in today's trading session we are monitoring CHFJPY for a selling opportunity around 174.800 zone, CHFJPY is trading in a downtrend and currently is in a correction phase in which it is approaching the trend at 174.800 support and resistance area.
Trade safe, Joe.

NZDUSD Potential UpsidesHey Traders, in today's trading session we are monitoring NZDUSD for a buying opportunity around 0.56500 zone, NZDUSD is trading in an uptrend and currently is in a correction phase in which it is approaching the trend at 0.56500 support and resistance area.
Trade safe, Joe.

DXY Most Important Zone To WatchHey Traders, above is an overview on DXY and the most important zone to watch. DXY is trading in an uptrend and currently is in a correction phase in which it is approaching the trend at 106.250 support and resistance area.
It's very important to watch DXY at the beginning of every trading week if not everyday. That will help you to trade USD pairs more professionally and spot some correlations as well.
Trade safe, Joe.

Geopolitical Storms: USOIL's Potential UpsidesIn today's trading session, our focus is on USOIL, where we're eyeing a potential buying opportunity around the 72.30 zone. USOIL has been steadily advancing within an uptrend, and at present, it's navigating a correction phase, gradually nearing the 72.30 support and resistance area. This correction presents an opportune moment to consider a long position, particularly as the broader uptrend remains intact, signaling potential upside momentum.
Adding a fundamental layer to our analysis, geopolitical tensions in the Middle East are worth noting as a factor that could influence oil prices. Ongoing conflicts and heightened geopolitical risks in oil-producing regions like the Middle East often lead to concerns about supply disruptions, consequently driving up oil prices. Given the current state of geopolitical affairs, including the conflict between Israel and Palestine and broader tensions in the region, there's a likelihood of increased volatility and upward pressure on oil prices. Traders should remain vigilant of geopolitical developments as they assess their positions in the oil market.
Trade safe, Joe.

EURGBP Watch: Strategies Amidst the Correction PhaseGreetings Traders,
In today's trading session, our attention is turned towards EURGBP, where we are actively monitoring a potential selling opportunity around the 0.86500 zone. Currently entrenched in a downtrend, EURGBP is navigating a correction phase that brings it closer to the significant 0.86500 support and resistance area.
As EURGBP adheres to its downtrend trajectory, traders are observing the unfolding correction, anticipating a strategic entry point near the 0.86500 level. The support and resistance area represents a critical juncture, offering traders an opportune moment to consider a selling position. Vigilance and careful risk management are crucial as traders navigate the intricacies of EURGBP's correction phase.
The broader economic context, geopolitical events, and central bank policies can further influence EURGBP's movements. Traders should stay informed about relevant developments to make well-informed decisions in this dynamic trading environment. As always, trade safe and remain adaptable to evolving market conditions.
Best regards,
Joe.

GBPUSD Potential UpsidesHey Traders, in today's trading session we are monitoring GBPUSD for a buying opportunity around 1.26300 zone, GBPUSD is trading in an uptrend and currently is in a correction phase in which it is approaching the trend at 1.26300 support and resistance area.
Trade safe, Joe.

USDJPY Breakout and Potential RetraceHey Traders, in today's trading session we are monitoring USDJPY for a selling opportunity around 149 zone, USDJPY was trading in an uptrend and successfully managed to break it out. Currently is in a correction phase in which it is approaching the retrace area at 149 support and resistance area.
Trade safe, Joe.

EURGBP Potential UpsidesHey Traders, in tomorrow's trading session we are monitoring EURGBP for a buying opportunity around 0.86300 zone, EURGBP is trading in an uptrend and currently is in a correction phase in which it is approaching the trend at 0.86300 support and resistance area.
Trade safe, Joe.

EURUSD Potential UpsidesHey Traders, in the coming week we are monitoring EURUSD for a buying opportunity around 1.09400 zone, EURUSD is trading in an uptrend and currently is in a correction phase in which it is approaching the trend at 1.09400 support and resistance zone.
Trade safe, Joe.

GBPAUD Potential downsidesHey Traders, in today's trading session we are monitoring GBPAUD for a selling opportunity around 1.92400 zone, GBPAUD was trading in an uptrend and successfully managed to break it out. Currently is in a correction phase in which it is approaching the retrace area at 1.92400 support and resistance zone.
Trade safe, Joe.

EURGBP Long opportunityHey traders, in today's trading session we are monitoring EURGBP for a buying opportunity around 0.864 zone, once we will receive any bullish confirmation the trade will be executed.
Trade safe, Joe.

ADA : Aiming a 100% profits opportunity in the Mid term.Cardano (ADA) has been on the decline for more than a year now, ever since it reached its all-time high back in September of last year at $3.10. Throughout 2022, the price of ADA has declined by around 80%. More recently, the price of ADA reached as low as $0.33, which was the lowest in 20 months. Nonetheless, despite ADA being bearish and on the decline, ADA has been trending and trading volume has been relatively high, despite the current state of the market.
Following the recent trending nature of ADA, there has been a slight increase in the price in the last few days. ADA increased by 10%, but it is still not enough to suggest a potential reversal in the price of ADA.
Nonetheless, this study goes through the technical and fundamental factors of ADA that could have an impact on the price of ADA for the coming days/weeks.
Technical Analysis
As seen in the ADA/USDT 1-day chart, Cardano is trying to be in favor of bulls but not confirmed yet. Recent price movement suggests that ADA recently found resistance at the lower trendline, meaning that the recent correction was kind of expected. Nonetheless, the price remains bearish from the long term trading perspective and we could expect the price to keep declining in the coming days if the indications fail to fulfill the requirements for a bullish reverse move confirmation.
Indicators
The fear and greed index suggests that there is neutral in the current market, especially for ADA, whose price has been on the decline for more than a year now but showing a good move by the last 48 hours. Though extreme fear in overall crypto market often leads to reversals, that might not be the case in the short run for ADA.
The MACD line of a 1-day chart is currently above the signal line but quite below the baseline. Hence, even though the shorter run momentum is slightly on the bullish end, that could easily change by which our trade needs some strict risk management measures.
The RSI of a 1-day chart was recently below 30 and in the oversold region. This then saw ADA have a slight increase in price in the last few days. Though we could assume that since the RSI is now above 30, the price could keep declining.
The 20-day MA line is currently below the price of ADA, meaning that the trend at least becomes bullish for short term holding for Cardano. This MA line could act as resistance to the price of ADA if the latter attempts an increase. At the same time the scenario is forming on the 9-day MA too.
Fundamental Analysis
Perhaps one reason why Cardano (ADA) has been trending recently is that it was announced that Algorand is now in the Cardano ecosystem. Given the magnitude that Algorand has, it could have a huge impact on the development of Cardano as well. Though it’s essential to point out that as much as Algorand is in Cardano, Cardano is in Algorand, given that the two are interoperable. This comes as a result of the deployment of Milkomeda L2.
Charles Hoskinson, the founder of Cardano, was quick enough to make the announcement on Twitter.
Though Sebastian Guillemot, who is a contributor to both Cardano and Algorand, was also quick enough to correct Hoskinson on the correct way to phrase the announcement.
Community engagement has slightly increased for Cardano as well due to the yearly Cardano Summit that will be held in November. Additionally, Hoskinson recently stated on his Twitter account that something of major significance will be announced in November. No matter what that is, ADA bulls are eagerly waiting for this announcement that could potentially be a pretext for a reversal in the long-term trend. In other news, Cardano is also rumored to soon be listed on FTX. If that happens in the coming months, then it could do wonders to the price of ADA.
ADA Price Prediction
Based on this analysis of Cardano, it is unlikely for ADA to have a sudden surge in price unless we have some huge and powerful community based news prior to the technical analysis study. Currently, ADA may initially face resistance at $0.4148. Assuming the bullish momentum increases soon, then ADA could break this resistance and aim higher. However, as it stands, ADA is likely to keep testing the current resistance depicted by the falling wedge upper side trend line. In such a price surge, to be a healthy move the coin needs some correction and I am expecting a pullback after the current candlestick of the 1D chart closes and if there is going to be any impacting news coming towards the coin including the US stock indices and Bitcoin’s movement we might see a further pullback which is very unlikely at the time of writing this analysis. Though there is strong support at around $0.30, bears may likely continue to have control of ADA.
Takeaways
In the daily timeframe, the price of ADA continues to hold strong and trade above the key Support formed at $0.35 after the price rallied from its daily low, with the current market looking favorable for most crypto assets.
The price of ADA needs to break and hold above 50 EMA, acting as a strong resistance to the price of ADA. The price of $0.4 corresponds to the value of 50 EMA, acting as resistance for the price to break higher to a region of $0.5.
Daily resistance for the ADA price – $0.42.
Daily Support for the ADA price – $0.35.
• Cardano has been trending recently, despite being quite bearish. Now looking bullish for the short term entry but needs some more development to give a confirmation of a long term bullish trend.
• Technical indicators suggest that ADA is unlikely to be bullish any time soon.
• Recent teases by Charles Hoskinson have increased Cardano’s community engagement.
• If support at $0.31 fails, ADA could be heading further down.


Bear flag pattern observed in GBPJPY, will it break?Suggestion: SELL GBPJPY AT CMP 137.10-20 SL ABV 137.90 TGT 136.50/136.60 ELSE BUY ABOVE 138 TGT 139.50/70 SL BELOW 137.20

NZD/CHF High Probable Bullish Setup#nzdchf , nzd speculators are extreme selling levels 52K since last five years. while commercials are on extreme buying level 49k long. nzd bullish seasonal move suspect ahead for long. chf extreme bullish level. so high probability for reversal here.

USDCHF high probable trade setupUSDCHF, large speculators did profit taking on usd by closing both short and long positions. while banks opened both sides positions. in CHF shorts positions increase 1%. suspect strength in chf now.
