EURJPY POSSIBLE EXPECTED MOVEIn this analysis we're focusing on 1H time frame. Today I'm looking for a potential buy move from my marked key levels. This is a higher time frame analysis. Let's analyze more deeply into smaller timeframe and potential outcomes. Confirmation is very important.
Always use stoploss for your trade.
Always use proper money management and proper risk to reward ratio.
This is my analysis.
#EURJPY 1H Technical Analysis Expected Move.
Technicalindicator

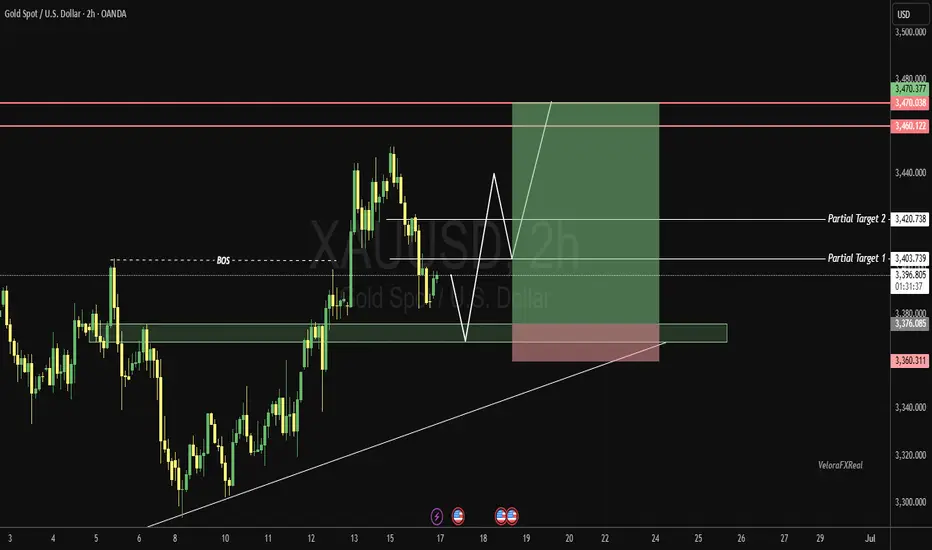
XAUUSD ANALYSISOn gold currently we're analyzing 2H time frame. As we know that current trend was bullish. At this stage, I'm anticipating a retracement towards my Point of Interest (POI), where I’ll be looking for a clear bullish confirmation, ideally through candlestick structure or solid price action. Only upon receiving that confirmation will I consider entering a buy position.
This outlook is based on the higher time frame structure. For now, I'm observing patiently to see how price unfolds. Until the market sweeps the SSL liquidity, I will remain on the sidelines no entries until that key liquidity level has been taken. Confirmation is key.
Always use stoploss for your trade.
Always use proper money management and proper risk to reward ratio.
#XAUUSD 2H Technical Analysis Expected Move.

GBPCAD OUTLOOKIn this analysis we're focusing on 2H time frame for finding possible upcoming movement in price. So as per my strategy today I'm looking for a sell trade opportunity. Confirmation is very important, after confirmation we'll execute our trade. Let's see which opportunity market will give us.
Always use stoploss for your trade.
Always use proper money management and proper risk to reward ratio.
This is my prediction.
#GBPCAD 1H Technical Analysis Expected Move.

#GOLD UPDATESIn this analysis we're focusing on 2H timeframe for finding the upcoming changes in gold price.
Here we can see clearly that gold price creates trendline resistance and also price sweep all the SSL and pre. daily LQ sweep. Now I'm waiting for retracement, If price retest my supply zone and give bearish sign or reversal confirmation than we'll execute our trades. This is a higher time frame outlook. Further analyze more deeply into smaller time frame and place our position from an perfect point.
Always use stoploss for your trade.
Always use proper money management and proper risk to reward ratio.
Keep an eye on these levels. Confirmation is key.
#XAUUSD 2H Technical Analysis Expected Move.

#XAU/USD SELL TRADE SETUP [SHORT]In this analysis we're focusing on 2H timeframe. As we know, Gold is moving in a strong bearish trend. The best selling zone is 3295 - 3305 key levels area. If gold encounters rejection from this zone, we can anticipate a potential decline in price towards its targeted levels.
Target 1:3260
Target 2:3250
Target 3:3240
Wait for a retracement to sell with strong confirmation and proper risk management.
#GOLD 2H Technical Analysis Expected Move.

GOLD REVERSAL POINT [Bearish Bias]According to this analysis, today I'm expecting a sell opportunity. So here we're analyze 1H time frame, Price is currently moving near a strong order flow area, and has also SIBI is pending. If price faces clear rejection from this key levels, So there is a high probability that the market may decline from this level. Wait with patient and maintain discipline, confirmation is key.
Now let's see how our sell zone plays out.
Always use stoploss for your trade.
Always use proper money management and proper risk to reward ratio.
#GOLD 1H Technical Analysis Expected Move.

GOLD 30M ANALYSIS (LONG)In this analysis we're focusing on 30Min time frame. If we look in this 30Min chart, we have supply area and demand area. And we have also a minor resistance level. Now what I'm looking for that price move impulsively upside after sweeping all SSL. I'm expecting that price will come back and retest (3310 - 3305) area at least. So keep an eye on these level, confirmation is key.
Second Condition:
If price break above 3332 and close above 3332 with strong momentum than we will plan a buy trade on retracement.
Always use stoploss for your trade.
Always use proper money management and proper risk to reward ratio.
#XAUUSD 30M Technical Analysis Expected Move.

XAUUSD Bullish OutlookThis chart captures a highly strategic bullish setup on XAUUSD, rooted in Smart Money Concepts (SMC) and institutional trading principles. The market has performed a major liquidity sweep, dipping below previous lows to collect resting sell-side liquidity before reacting sharply from a key demand zone.
Why Bullish? The Confluences:
Liquidity Sweep:
Price manipulated below a significant structural low to trap late sellers and activate institutional orders. This move into deeper liquidity suggests the smart money is building long positions.
Extreme P.O.I. + Demand Zone:
The blue zone marks a high probability reversal area where demand outweighs supply. This zone is validated by historical reactions and refined to align with an Order Block (OB) a clear footprint of institutional accumulation.
Bullish Structure Anticipation:
After the reaction, price is expected to form a series of higher highs and higher lows, confirming bullish market structure. Multiple resistance levels are in sight, each one representing an objective for price to reach in its journey upward.
Entry Point: $3,343 – $3,330
Located inside the OB and demand zone, this is where price is likely to build a base for upward continuation.
Stop Loss: Below $3,324
TP1: $3,363 (first internal structure break)
TP2: $3,375 (mid range target)
TP3: $3,383 (structural high retest)
TP Final: $3,405 (liquidity target above EQH)
Remember confirmation is key before execution.
#GOLD 2H Technical Analysis Expected Move.

EUR/USD 30-MIN ANALYSISThis EURUSD setup showcases a clean bullish continuation scenario following a confirmed Break of Structure (BOS) and a sharp rally driven by momentum and liquidity imbalance.
After sweeping a key low (XXX), price impulsively broke structure to the upside, confirming a potential shift in market intent. A retracement is now expected to mitigate the Buy-Side Imbalance (BISI) zone.
BOS & SSS (Short-Term Structural Shift): Confirmed bullish intent.
Imbalance (BISI): Price left behind an unfilled imbalance zone a likely magnet for a pullback.
Re-Entry Zone: (BISI) provides a high probability area for long re-entry.
Upside Targets:
Target 1: 1.15483 – intermediate structural level.
Target 2: 1.16158 – premium supply / liquidity target.
#EURUSD 30M Technical Analysis Expected Move.

GOLD (XAUUSD) – Wave b Complete? Preparing for Wave c RallyGold tapped into the key demand zone and swept sell-side liquidity (SSL) beneath wave (iii) lows.
A five-wave decline appears complete, with wave (v) of b terminating just below the o.618 fib extension at 3344.86.
🟢 Wave c projection now in focus — looking for a 5-wave impulsive rally to develop.
Targeting the Sell Zone between the 0.5–0.764 retracement (3395.87–3425.07).
🧠 Structure Notes:
✅ Imbalance Zone (IMB) formed during the breakdown has now been tapped
🔻 SSL swept + bullish reaction = potential change of state
🟢 Wave (i) and (ii) projection underway – price needs to maintain structure above 3357.43 for bullish continuation
Targets: 3408.81 (0.618 Fib)
Invalidation below: 3340.31
Momentum and RSI divergence support reversal

ZONE SNIPER SETUP (BEARISH)BTC/USD Supply Zone Reaction Expected...!
Current price action is retracing toward a well defined supply zone between 107,016 and 108,576, an area of previous institutional selling. The expectation is a potential rejection from this zone, leading to a continuation of the broader downtrend.
If price taps into this supply and fails to break above, short opportunities become favorable targeting:
Intermediate support at 104,000.
Final target at 101,565, aligning with prior liquidity sweep.
Invalidation occurs on a strong close above 108,576.
#BTC/USD, #FOREX, @VeloraFXReal

XAU / USD ANALYSIS [Bullish Bias]Gold continues to show strong bullish momentum, supported by key technical levels and favorable market structure. Price action remains constructive above the major support zone, indicating potential for further upside.
I'm closely monitoring the following levels for a high-probability long setup:
Demand Zone / Support Level:
Entry key level: 3375 - 3370
As long as gold holds above this support, the bias remains bullish with potential for a continuation toward higher resistance levels. A break and sustained move above the entry zone would confirm bullish strength and could trigger the next leg up.
Risk management remains key waiting for clear confirmation before entering is advised.
#GOLD, #FOREX , # VeloraFXReal
Bitcoin Correction or Trap? Watch This Support Zone CloselyExclusive #Bitcoin Update
I got lots of DMs, people are asking:
Do you think the bull trend is finished, or is it just a correction and pullback?
Guys, first stop panicking.
This is exactly what the shark wants you to do. Don’t let them shake you out.
Let’s get to the chart:
My previous chart got invalidated, and the current situation is that CRYPTOCAP:BTC is defending strongly around the $104.8K to $104.3K support zone.
According to the FIB level, we’re currently at the 0.383 level. This area has previously served as strong resistance, so it can now function as effective support.
If bulls manage to bounce from this area and push above $107K, we could trigger a sharp move toward the $112K–$113K liquidation zone,
where we have almost $12B in short liquidations acting as a strong magnet!
Let's talk about the worst-case scenario, in case we break down below this supportive area, then we have
200 EMA and a strong support around $101.4k to $101.8k.
I’ll keep you posted as things unfold. If you find my updates helpful, don’t forget to like and follow for more! #Bitcoin2025
CRYPTOCAP:BTC BITSTAMP:BTCUSD BINANCE:BTCUSDT

WATCH OUT FOR VERITASKAPFrom around 0.83, VERITASKAP created an all-time high of around 1.81. This happened between August 2024 and September 2024. Then, price dropped into the discount level where is currently. The current price action shows that price is in a discount level, at a demand zone and within a falling wedge.
From a chart pattern perspective, falling wedge can be seen on the chart and a break out of the downtrend and resistance level around 1.06 with a bullish candle closing above these levels will serve as a strong indication that the stock is ready to rally up as much as the all-time high.
From a technical indicator perspective, awesome oscillator is below 0, showing that the stock is oversold. In addition, there is a bullish indication on the awesome oscillator as shown by its colour and upward movement. This is pointing to the fact that the value of the awesome oscillator is moving towards 0 and can cross over it which can be a good indication for a rise in price as well.
From a smart money concept perspective, a break of the last high (around 1.27) that led to the last bearish internal break of structure will as serve as indication of a bullish trend. Hence, the target will the all-time high.
Either way, the stock has a good potential. An aggressive trader or investor may buy at the current market price. While a conservative trader or investor may wait for a breakout.
Watch out for the confluences indicating potential rise in price so as to not miss out on the benefit.

GBPUSD SHORT IDEAGBPUSD has been rally up for a while. Currently, there's a divergence signal from the awesome oscillator on the daily timeframe. Switching to 4 hours timeframe, there's a clearer view of what's going on. Based on the 4 hours chart, rising wedge has been formed and there's also a bearish divergence signal from the awesome oscillator. In addition to these, price has mitigated a daily supply zone after taking out a significant high as a liquidity. Then, a bearish engulfing candlestick was formed, signifying potential reversal. On 1 hour timeframe, price has broken out of a rising wedge and retested it.
As a retail trader, one can enter a short position after the bearish engulfing candlestick confirmation. This aligns with the 1 hour breakout and retest. While one can wait for price to break out of the 4 hours rising wedge.
As a smart money trader, one can wait for a change of character and break of structure on the 4 hours timeframe to confirm that price has really changed its trend ready for a reversal.
Either way, one can take advantage of the potential short opportunity on GBPUSD.
Confluences for the short signal:
1. Bearish divergence signal from awesome oscillator on daily and 4 hours timeframe.
2. Rising wedge on 4 hours timeframe.
3. Price mitigating daily supply zone.
4. Price has taken out a significant high as a liquidity.
5. Bearish engulfing candlestick formation on 4 hours timeframe.
Disclaimer: This is not a financial advice. The outcome maybe different from the projection. If you can't accept the risk, don't take the signal.

BTCUSD ANALYSISIn this analysis we are focusing on 2H time frame for finding the upcoming movement and changes in price. Today I'm looking for a buyside trade. Here we have two condition if price come at least our base area then buy otherwise when price break trendline resistance after break wait for retracement and confirmation and execute your trade with confidence.
Always use stoploss for your trade.
Always use proper money management and proper R:R ratio.
#BTCUSD 2H Technical Analyze Expected Move.

10 Technical Indicators Every Trader Uses for Trading10 Technical Indicators Every Trader Uses for Trading
Technical analysis indicators are essential tools for traders to analyse every aspect of market movements, including market trends, momentum, volume, and volatility. This article explores ten key technical indicators you could add to your toolkit. Read detailing definitions, uses, and the signals they provide to potentially enhance trading strategies.
To get started with these indicators, head over to FXOpen.
Ichimoku Cloud
The Ichimoku Cloud, also known as Ichimoku Kinko Hyo, is a comprehensive technical analysis tool designed to provide a clear picture of market trends, momentum, and support and resistance levels. Considered one of the best stock market indicators, this Japanese tool is widely used for its ability to offer a panoramic view of the market.
Definition
The Ichimoku Cloud comprises five main components:
- Tenkan-sen (Conversion Line): The average of the highest high and the lowest low over the past 9 periods.
- Kijun-sen (Base Line): The average of the highest high and the lowest low over the past 26 periods.
- Senkou Span A (Leading Span A): The average of the Tenkan-sen/Conversion Line and Kijun-sen/Base Line, offset by 26 periods ahead.
- Senkou Span B (Leading Span B): The average of the highest high and lowest low over the past 52 periods, plotted 26 periods ahead.
- Chikou Span (Lagging Span): The most recent closing price positioned 26 periods behind.
These components create the "Kumo" or cloud, which projects future support and resistance levels.
Signals
1. TK Cross:
- Bullish Signal: Tenkan-sen crosses above Kijun-sen above the Kumo.
- Bearish Signal: Tenkan-sen crosses below Kijun-sen below the Kumo.
2. Kumo Breakout:
- Bullish Signal: Price breaks above the Kumo.
- Bearish Signal: Price breaks below the Kumo.
3. Chikou Span Confirmation:
- Bullish Signal: Chikou Span is above the price and Kumo.
- Bearish Signal: Chikou Span is below the price and Kumo.
4. Kumo Twist:
- Indicates a potential trend reversal when the cloud changes colour (from red to green for bullish, green to red for bearish).
For cryptocurrency* trading, the standard settings (9, 26, 52) are often adjusted to 20, 60, 120 to accommodate the 24/7 trading cycle. More details on using Ichimoku in crypto* markets can be found on the FXOpen dedicated page.
Fibonacci Retracements
Fibonacci retracements are a technical tool that helps traders identify potential areas of support and resistance in a given market. This method is based on the Fibonacci sequence, a series of numbers where each number is the sum of the two preceding ones. In trading, key Fibonacci levels are 38.2%, 50%, and 61.8%, which are used to analyse potential reversal points.
Definition
Fibonacci retracements are widely used stock chart indicators that help traders determine where the price might reverse during a correction in a prevailing trend. The tool involves plotting horizontal lines at these key levels, calculated from a significant high to a significant low when the price corrects after a strong downward movement or from a significant low to a significant high when the price corrects after a strong upward movement.
Signals
1. Support and Resistance Levels:
- 38.2%, 50%, and 61.8% Levels: These are the primary retracement levels where the price is likely to reverse.
2. Trend Identification:
- Uptrend: Place the tool from a swing low to a swing high.
- Downtrend: Place the tool from a swing high to a swing low.
3. Trade Setup:
- Entry Points: Traders often look for the price to reach and react at these levels before entering a trade.
- Stop Loss: Typically set just beyond the nearest Fibonacci level the price targets.
- Take Profit: Targets are often placed at the next Fibonacci level.
For cryptocurrency* trading, settings may vary. We provide a detailed explanation on using Fibonacci retracements in crypto markets with adjustments to fit this unique trading environment.
Volume Weighted Average Price (VWAP)
The Volume Weighted Average Price (VWAP) is a technical indicator that provides the average price an asset has traded at throughout a particular period (usually one day), weighted by volume. It offers a more comprehensive view than simple moving averages by incorporating both price and volume data and is considered one of the best intraday trading indicators.
Calculation
VWAP is calculated using the formula:
- VWAP = Sum(Typical Price * Volume) / SumVolume,
where Typical Price is the average of the high, low, and close prices for each period.
Signals
1. Assessing Fair Value: A price above VWAP indicates overvaluation, while a price below suggests undervaluation.
2. Market Sentiment and Trends:
- Bullish Trend: Price above VWAP.
- Bearish Trend: Price below VWAP.
3. Support and Resistance Levels:
- Support: VWAP acts as support in a bullish market.
- Resistance: VWAP acts as resistance in a bearish market.
4. Entry Quality:
- Entry near VWAP suggests buying or selling at a reasonable market value.
For cryptocurrency* trading, the VWAP settings remain similar to traditional markets, but the tool's application may vary due to the 24/7 nature of crypto* trading. Check out FXOpen’s page on how to use VWAP in crypto markets for more information.
Accumulation/Distribution Indicator (A/D)
The Accumulation/Distribution (A/D) indicator is a volume-based tool that assesses the cumulative flow of money into and out of an asset. It’s widely used as an indicator for day trading. It helps traders determine the underlying buying and selling pressure, making it one of the valuable forex and stock indicators for analysing potential price trends and reversals.
Calculation
The A/D indicator calculates the Money Flow Multiplier (MFM), which ranges from -1 to 1 based on the closing price's position within the period’s high-low range. If the closing price is in the upper half, the MFM is positive; if in the lower half, it is negative. This multiplier is then multiplied by the period’s volume to get the Money Flow Volume (MFV). The A/D line represents the cumulative sum of these MFVs over time, reflecting net volume flow.
Signals
Identifying Reversals:
- Bullish Divergence: Price makes lower lows while the A/D line makes higher lows, indicating waning selling pressure and a potential price increase.
- Bearish Divergence: Price makes higher highs while the A/D line makes lower highs, suggesting decreasing buying pressure and a possible price decline.
Trend Confirmation:
- Uptrend: Both price and A/D line rise, indicating sustained buying pressure.
- Downtrend: Both price and A/D line fall, showing continuous selling pressure.
Trading Breakouts:
- The A/D indicator can confirm breakouts beyond support or resistance levels. A breakout in price aligned with a similar movement in the A/D line signals the start of a new trend.
Average True Range (ATR)
The Average True Range (ATR) is a technical tool used to measure market volatility. It reflects the degree of price movement over a specified period, helping traders understand the level of volatility in an asset.
Calculation
ATR calculation includes several steps. Find more details in our article.
Signals
ATR does not indicate the price direction but rather the degree of price movement. Traders use ATR to make informed decisions about stop-loss levels and to gauge the potential for market moves. It’s one of the popular day trading indicators.
1. Volatility Measurement:
- A high ATR value indicates high volatility, while a low ATR suggests low volatility. This helps traders adjust their strategies based on market conditions.
2. Setting Stop-Loss Levels:
- Traders often set stop-loss orders at a multiple of the ATR value. For instance, a stop loss might be placed at twice the ATR below the entry price in a long position to account for volatility and reduce the risk of being stopped out prematurely.
3. Identifying Potential Breakouts:
- Sudden increases in ATR values can indicate the start of a new trend or a significant price move, alerting traders to potential trading opportunities.
Donchian Channel Indicator
The Donchian Channel is a technical analysis tool designed to identify volatility, market trends, price reversals, and potential breakout points. It consists of three lines based on the highest high and lowest low over a specified period, typically 20 periods.
Definition
- Upper Boundary: The highest high over N periods.
- Lower Boundary: The lowest low over N periods.
- Middle Line: The average of the upper and lower boundaries.
These lines help traders determine market volatility and identify potential buy and sell signals based on price movements.
Signals
1. Tracking Volatility:
- Widening Channel: Indicates high volatility.
- Narrowing Channel: Indicates low volatility.
2. Identifying Trends:
- Bullish Trend: The upper boundary rises while the lower boundary stays flat.
- Bearish Trend: The lower boundary falls while the upper boundary stays flat.
3. Trading Breakouts:
- Above Middle Line: Potential bullish signal.
- Below Middle Line: Potential bearish signal.
4. Trading Reversals:
- In range-bound markets, the upper boundary acts as resistance and the lower boundary as support, guiding traders to close or open positions accordingly.
Chaikin Money Flow (CMF)
The Chaikin Money Flow (CMF) is a volume-weighted average indicator measuring the buying and selling pressure on an asset over a specific period, typically 20 or 21 periods. It combines price and volume data to provide insights into market sentiment and potential price movements, making it one of the key forex and stock market technical indicators.
Calculation
The CMF calculation involves three main steps:
- Money Flow Multiplier (MFM): (Close - Low) - (High - Close) / High - Low. This value ranges from -1 to 1 and is positive when the closing price is in the upper half of the period's range and negative when in the lower half.
- Money Flow Volume (MFV): Calculated by multiplying the MFM by the period's volume.
- CMF Value: The sum of MFVs over the period divided by the sum of volumes over the same period.
The resulting CMF values fluctuate between -1 and +1, providing a visual representation of money flow into and out of the asset.
Signals
1. Trend Strength:
- Positive CMF: Indicates buying pressure, suggesting a bullish trend.
- Negative CMF: Indicates selling pressure, suggesting a bearish trend.
2. Trend Reversal:
- Bullish Divergence: Occurs when the price makes lower lows, but the CMF makes higher lows, indicating a potential reversal to the upside.
- Bearish Divergence: Occurs when the price makes higher highs, but the CMF makes lower highs, indicating a potential reversal to the downside.
3. Breakout Confirmation:
- A breakout in price above/below a key level accompanied by a breakout in the CMF value above/below previous highs/lows can confirm the strength of the move.
Average Directional Movement Index (ADX)
The Average Directional Movement Index (ADX) is an indicator traders apply on a chart to measure the strength of a trend. It is particularly useful for traders who want to determine whether a market is trending or ranging.
Definition
The ADX consists of a single line that fluctuates between 0 and 100. It does not indicate the direction of the trend but rather its strength. The standard ADX setting is a 14-period, but this can be adjusted to suit different trading styles.
- 0-25: Indicates a weak or non-existent trend.
- 25-50: Signals a strong trend.
- 50-75: Suggests a very strong trend.
- 75-100: Reflects an extremely strong trend.
Signals
1. Trend Strength:
- A rising ADX value above 25 indicates a strengthening trend, regardless of whether it is bullish or bearish.
- A falling ADX below 25 suggests a weakening trend or a ranging market.
2. Trend Momentum:
- When ADX peaks and starts to decline, it can signal a potential weakening of the current trend, indicating that traders might consider closing or reducing positions.
Combining ADX with DI Lines
The ADX is often used in conjunction with the Positive Directional Indicator (+DI) and Negative Directional Indicator (-DI) lines:
- +DI > -DI: Suggests a bullish trend.
- -DI > +DI: Indicates a bearish trend.
A rising ADX alongside these signals confirms the strength of the current trend.
Traders use this indicator to enter trades. For this, they look for ADX to rise above 25 to confirm the beginning of a strong trend before entering trades in the direction of the trend indicated by the +DI and -DI lines.
Commodity Channel Index (CCI)
The Commodity Channel Index (CCI) is a momentum-based indicator that measures the deviation of an asset's price from its historical average. It helps traders identify potential overbought or oversold conditions, trend reversals, and divergence signals.
Calculation
- CCI is calculated using the formula:
CCI = (Typical Price − SMA) / 0.015 * Mean Deviation,
where:
- Typical Price = (High + Low + Close) / 3
- SMA = Simple Moving Average of the Typical Price
- Mean Deviation = Average of the absolute differences between the Typical Price and its SMA
The constant 0.015 normalises the CCI values, ensuring that approximately 70-80% of the values fall between -100 and +100.
Signals
1. Overbought and Oversold Conditions:
- Above +100: Indicates the asset is overbought, suggesting a potential price pullback or a downward reversal.
- Below -100: Indicates the asset is oversold, suggesting a potential pullback or an upward reversal.
2. Trend Reversals:
- Bullish Divergence: When the market is making lower lows while the CCI makes higher lows, potentially preceding a bullish reversal.
- Bearish Divergence: When the market is making higher highs while the CCI makes lower highs, potentially preceding a bullish reversal.
3. Trade Entries:
- Traders consider entering long positions when CCI breaks above -100 from below.
- Conversely, traders might enter short positions when CCI moves below +100 from above.
Keltner Channel
The Keltner Channel is a popular technical analysis tool used to determine market trends, price volatility, and potential reversal points. It consists of three lines: an exponential moving average (EMA) in the middle, and upper and lower bands calculated by adding and subtracting a multiple of the Average True Range (ATR) to the EMA.
Definition
The standard settings for Keltner Channels typically use a 20-period EMA and an ATR multiplier of 2. These settings can be adjusted to suit different trading styles and timeframes, making Keltner Channels effective technical indicators for day trading. The EMA provides a smoothed average price, while the ATR measures volatility. The bands expand and contract based on market volatility, creating a channel around the price.
Signals
1. Trend Identification:
- Upward-Sloping Channel: Indicates a bullish trend.
- Downward-Sloping Channel: Indicates a bearish trend.
- Flat Channel: Suggests a ranging market.
2. Dynamic Support and Resistance:
- The upper and lower bands of the Channels serve as dynamic levels of support and resistance. Price action within these bands can help traders identify potential entry and exit points.
3. Breakout Signals:
- Bullish Breakout: Price closing above the upper band.
- Bearish Breakout: Price closing below the lower band.
The Bottom Line
These ten technical indicators could be added to your toolkit to potentially enhance your trading strategies. By understanding their signals and applications, traders can better navigate the worlds of forex, stocks, commodities, and cryptocurrencies*. Open an FXOpen account today to access advanced trading tools and start implementing these indicators in live markets.
FAQs
Which Types of Trading Indicators Are Common to Use?
4 common types of technical indicators include trend (Moving Averages, ADX), momentum (RSI, Stochastic Oscillator), volume (On-Balance Volume, VWAP), and volatility (Bollinger Bands, ATR) indicators. These help traders analyse trends, momentum, volume, and volatility.
How Many Indicators Should a Trader Use?
Traders often use 2-3 indicators to avoid overcomplication and conflicting signals. Combining different types of indicators can provide a more comprehensive analysis.
Why Do Indicators Fail?
Indicators can fail due to market volatility, news events, and their inherent lag. They may also produce false signals in choppy markets. Combining indicators with risk management can potentially improve reliability.
Is It Better to Trade Without Indicators?
Trading without indicators, known as price action trading, can be effective for experienced traders. However, using a few indicators can provide valuable insights and confirm price movements for most traders.
Trade on TradingView with FXOpen. Consider opening an account and access over 700 markets with tight spreads from 0.0 pips and low commissions from $1.50 per lot.
*At FXOpen UK, Cryptocurrency CFDs are only available for trading by those clients categorised as Professional clients under FCA Rules. They are not available for trading by Retail clients.
This article represents the opinion of the Companies operating under the FXOpen brand only. It is not to be construed as an offer, solicitation, or recommendation with respect to products and services provided by the Companies operating under the FXOpen brand, nor is it to be considered financial advice.

#BITCOIN ANALYSISToday I'm looking buy trade opportunity in BTCUSD. We're analyzing 4H time frame. On the basis of SMC concept and price action strategy. Let's see what happens and which opportunity market will give us. Wait for confirmation, once the confirmation was receive trigger your trade.
Always use stoploss for your trade.
Always use proper money management and proper risk to reward ratio.
#BTCUSD 4H Technical Analyze Expected Move.

Why You Should Consider Buying ARKK ETF: A Gateway to InnovationOverview of ARKK
ARKK is the ticker symbol for the ARK Innovation ETF, managed by the investment firm ARK Invest, led by Cathie Wood. The ETF is renowned for its focus on high-growth, innovative companies across various sectors such as technology, healthcare, artificial intelligence, and renewable energy.
Key Features
Focus on Disruptive Innovation:
ARKK invests in companies at the forefront of transformative technologies, including:
Genomic research and biotechnology.
Robotics and automation.
Artificial intelligence (AI).
Blockchain technology.
Electric vehicles (EVs).
Active Management:
Cathie Wood, the fund's visionary manager, is known for her bold and aggressive investment strategies, targeting high-risk, high-reward opportunities in emerging industries.
Portfolio Composition:
ARKK's holdings include trailblazing companies such asTesla, **Roku, Zoom Video Communications, CRISPR Therapeutics, and Block (formerly Square). The portfolio is actively managed and adjusted based on ARK Invest's extensive research.
Risk-Reward Profile:
As a high-risk ETF, ARKK is characterized by significant price volatility. It appeals to long-term investors willing to weather short-term fluctuations in pursuit of substantial growth potential.
Performance:
Boom in 2020: ARKK experienced remarkable growth during the pandemic, fueled by a surge in tech stocks.
Challenges in 2022: The fund faced a steep decline due to corrections in the tech sector, rising interest rates, and economic uncertainties.
Expense Ratio:
ARKK has an annual management fee of approximately 0.75%, higher than the average for ETFs, reflecting its active management approach.
Target Audience:
ARKK is ideal for investors who believe in the long-term potential of disruptive innovation and are comfortable with short-term losses for the prospect of future gains.
Risks to Consider
Sensitivity to macroeconomic factors (e.g., interest rate hikes).
Vulnerability to downturns in the technology sector.
Heavy exposure to companies with low or negative earnings.
Why Buy ARKK?
Investing in ARKK provides exposure to groundbreaking technologies and industries poised for exponential growth. While it carries higher risks, it offers the potential for substantial long-term rewards. Whether you’re an experienced investor or a believer in the future of innovation, ARKK is a compelling addition to a forward-thinking portfolio.

# BULLISH CHANNELGold Analysis - 2-Hour Time Frame
Today, we’re diving into the 2-hour time frame for Gold. As we know, the overall market structure is bullish, signaling strong upward momentum. The price has established a clean and well-structured bullish channel, a clear indication of continued bullish sentiment.
If the price continues to respect the boundaries of this bullish channel, we’ll be looking for a buy opportunity within our key demand zone.
Key Steps:
1: Wait for a Bullish Confirmation: Watch for clear signs of upward momentum to confirm the buying signal.
2: Execute the Trade: Once confirmation is received, enter the trade with confidence.
Patience and precision are key in capturing this potential opportunity!
#GOLD 2H Technical Analyze Expected Move.

Support And Resistance Here we are focusing on 4h time frame for EURUSD. As we know that market local trend was bearish, but here we have fresh support zone so we are look for buy and after taking confirmation we execute trade. Let's analyze more deeply into these levels and potential outcomes.
Use proper risk to reward ratio.

Price ActionOur focus is on GBP/JPY daily time frame. I'm look for buy today and also the trend was bullish.
Let's analyze these levels further in depth so that we can achieve maximum gain.
Must put stoploss for your trade.

BTCUSD FORECASTWe are currently analyzing the 2-hour time frame to identify potential price changes in Bitcoin. The market scenario is bullish, and the trend is also bullish. Today, I am looking for a buying trade opportunity as soon as the price reaches our designated level. We will execute our trade after confirming with the candles.
Make sure to use a stop loss for your trade.
