Potential Upside Breakout or Downside Correction?let's dive into the world of Bitcoin and try to make some sense of the current market situation. As of the latest news, Bitcoin seems to be showing some positive signs, with the price experiencing growth of 1000 dollars in the last 24 hours from the 27900 range. This growth is largely attributed to the positive reaction shown by Bitcoin to two important supports. Currently, the price is approaching a minor resistance in the 28900 - 29000 range. However, given the economic news, the meeting of the Federal Reserve's Free Market Committee, and the new interest rate being announced, there is a high possibility of extreme fluctuations in all financial markets, including digital currency. As such, it is recommended to avoid futures trades with high leverage and manage short-term trades. For the medium term, there is potential for a correction in Bitcoin's price, but there is also a possibility of a positive swing before the correction.
Now, let's look at some key prices on this chart. Based on the 4-hour timeframe, we can see that the local solid supports are at the 0 Fibonacci level of 27666 and the lower Bollinger band of 27637. On the other hand, the minor resistance can be seen at the 0.5 Fibonacci level of 28817 and the upper Bollinger band of 29603. In between these levels, we have the middle Bollinger band at 28620.
As for the bullish scenario, if Bitcoin manages to break through the minor resistance at the 0.5 Fibonacci level of 28817 and the upper Bollinger band of 29603, it could indicate a potential upward trend. This could be further confirmed if the RSI crosses above the 50 level, the MACD starts to rise, and the volume oscillator turns positive. If these indicators all align, we could see Bitcoin testing the 1 Fibonacci level of 29969.
On the other hand, in a bearish scenario, if Bitcoin fails to break through the minor resistance and instead breaks below the local solid supports at the 0 Fibonacci level of 27666 and the lower Bollinger band of 27637, it could indicate a potential downward trend. This could be further confirmed if the RSI crosses below the 50 level, the MACD continues to decline, and the volume oscillator remains negative. If these indicators all align, we could see Bitcoin testing the 24h low of 27910.
In conclusion, the current market situation for Bitcoin seems to be volatile and uncertain. It is important to monitor the various indicators and key prices to determine potential bullish and bearish scenarios. As always, it is recommended to exercise caution and manage risk appropriately.
Technicalindicators

Ethereum's Ups and Downs: What the Charts SayAt the time of writing, Ethereum is trading at $1869, and the 4-hour timeframe is in focus. The Relative Strength Index (RSI) is hovering around the midpoint at 50, which suggests that the coin is neither oversold nor overbought.
Looking at the Fibonacci levels, we see that the 0 Fibonacci level is at $1806, the 0.5 level is at $1872.50, and the 1 level is at $1939. These levels can be used to identify potential support and resistance areas for the price.
The Bollinger Bands are showing that the upper band is at $1916, the lower band is at $1804, and the middle band is at $1860. These bands can also be used to identify potential support and resistance levels.
The volume oscillator is currently at -21.80%, and the MACD is at -5.80. These indicators suggest that the volume and momentum are currently bearish.
Looking at the stochastic oscillators, the %K line is at 81, and the %D line is at 70, indicating that the coin may be overbought in the short term.
The hourly EMA 50 is at $1876, which can be used as another potential support and resistance level.
Finally, the On-Balance Volume (OBV) is at 21M, suggesting that there is some buying pressure in the market.
In recent news, it looks like there has been a massive $505M inflow of Ethereum into Binance, which could signal some selling pressure in the short term. However, it's important to remember that news events like these are just one factor among many that can influence the price of Ethereum.
So, If Ethereum manages to break above the solid resistance at the 4-hour timeframe 1 Fibonacci level at $1939 and the local resistance at the 4-hour timeframe upper Bollinger band at $1916, we may see a bullish momentum in the short term. In this scenario, the next resistance level to watch out for would be the 24-hour high at $1881, followed by the 4-hour timeframe 0.5 Fibonacci level at $1872.50. If the coin manages to break above these levels, we may see a continuation of the bullish trend.
On the other hand, If It fails to break above the 4-hour timeframe upper Bollinger band at $1916 and the 4-hour timeframe 1 Fibonacci level at $1939 and instead drops below the solid support at the 4-hour timeframe 0 Fibonacci level at $1806, we may see a bearish momentum in the short term. In this scenario, the next support level to watch out for would be the 24-hour low at $1824, followed by the 4-hour timeframe lower Bollinger band at $1804. If the coin manages to break below these levels, we may see a continuation of the bearish trend.

INDIGO near the CONSOLIDATION BREAKDOWNThe price trading in tight Consolidation Range of 1800 to 1920 since last 40 days and formed the structure looks like the base formation. If price breaks the level of 1920 and closes and will sustain above the breakout level than we can see target of 1985 Which is a gap space. Gap space can act as strong resistance for the price towards the upside momentum and if price Sustain above the 1990+ level than we can head towards the target of 2055/2100/2150. If price not able to close above the 1920 and price rejection from 1920 will again make it Rangebound.
Breakdown below the 1800 will leads to fall Towards the Level of 1750/1700 ✅

TORRENTPHARM NEAR BULLISH MOMENTUM VIEWThe price trading near weekly demand zone . A significant decline has been seen in the price and the price is now trading near the demand zone. so the price can takes rest from the decline and can move upwards from the support zone and RSI also taking support near 40 level which shows upward momentum of price.
If price respects this levels than price can move for their upper targets of 1560/1595+
#TORRENTPHARM 📊
👉Price at weekly support zone 1430📈📉
👉RSI at 40 support
👉Support seen at 1445/1450✅
👉Reversal sign📈
👉If holds then its can move for 1560/1595+🎯
👉Add to your watchlist👍
Traders, if you liked this idea or if you have your own opinion about it, write in the comments. I will be glad.

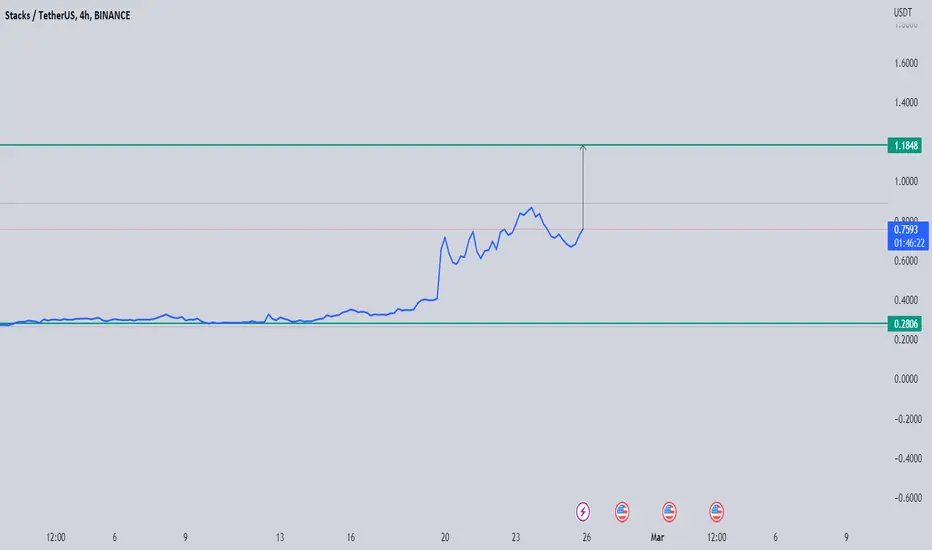
STX : INCREASE VIEWSTX is in an uptrend at this moment on the last volume counting range.
We will follow STX coming time to see if it's able to gain
BluetonaFX - GBPUSD UPDATE 02/05/2023Hi Traders!
Our GBPUSD bear channel setup earlier this morning reached the predicted 1.24364 support level and the market seems to have reacted to this level by having a small rally back to the range. Here we will see whether we continue this small momentum upwards to test the resistance level of 1.25845 or whether we go back to the downside and retest 1.24364 for a second time.
We will continue to let you know of further potential opportunities to come. Please remember to like and comment.
Thank you for your support!
BluetonaFX

M_M near the SUPPORT LEVELWe have seen 20% correction from the All Time High level of 1397 level and now Price near the support zone of 1120 -- 1145. If price consolidate between the range of 1150--1185 and than breaks the 1185 level than we can see upmove towards the upside and target will be 1215/1250+
If price breaks the level of 1120 and closes than target will be 1080/1060+
Traders, if you liked this idea or if you have your own opinion about it, write in the comments. I will be glad.

TATACONSUM DOUBLE BOTTOM FORMATIONThe price corrected 16% from the level of 820 and price continuously formed lower lows & lower highs. And now price formed DOUBLE BOTTOM formation on daily chart which considered as bullish formation for the price. Downward trendline also resisting the price from the upside. If price breaks the level of 810 and closes above it than target will be 722/740/760 towards the upside.
The level of 685 is support level for the price. Breakdown below 685 leads more fall in the price

W9.1-37 AUSUSD BULLISH IDEA (HARMONICS PATTERN)Potential Bullish Entry
Dow Theory In Place - Higher High and Higher Low Expected in Place
Formation of Harmonic Bullish reversal Pattern coupled with bullish divergence at potential reversal zone (PZR)
Entry at the new HH
SL & TP Levels are defined.

W10-9 GBPCADpotential bearish entry
Dow Theory in Place: Lower High and Lower Low Expected in Place
The double top, coupled with bearish divergence (a bearish reversal pattern).
Entry, SL, and TP levels are defined.

W10-3 APT BEARISH IDEA (DOUBLE TOP)Potential Bearish Entry
Dow Theory In Place - Lower High and Lower Low Expected in Place
Formation of double Top coupled with bearish divergence (Bearish reversal pattern)
Bullish Trend Is Still Intact. (careful for your levels)
SL & TP Levels are defined.

📈 4 Ways To Use The Moving Average📍 What Is a Moving Average (MA)?
In finance, a moving average (MA) is a stock indicator commonly used in technical analysis. The reason for calculating the moving average of a stock is to help smooth out the price data by creating a constantly updated average price.
By calculating the moving average, the impacts of random, short-term fluctuations on the price of a stock over a specified time frame are mitigated. Simple moving averages (SMAs) use a simple arithmetic average of prices over some timespan, while exponential moving averages (EMAs) place greater weight on more recent prices than older ones over the time period.
Common moving average lengths are 10, 20, 50, 100, and 200. These lengths can be applied to any chart time frame (one minute, daily, weekly, etc.), depending on the trader's time horizon. The time frame or length you choose for a moving average, also called the "look back period," can play a big role in how effective it is.
An MA with a short time frame will react much quicker to price changes than an MA with a long look-back period. In the figure below, the 20-day moving average more closely tracks the actual price than the 100-day moving average does.
👤 @AlgoBuddy
📅 Daily Ideas about market update, psychology & indicators
❤️ If you appreciate our work, please like, comment and follow ❤️

EUR/USD End of Week AnalysisIn this video I go over the price action for this week (Friday April 28th) and what to look forward to in next week's potential price action.

W9.1_42 NZDCHF BULLISH IDEA (HARMONICS PATTERN))Potential Bullish Entry
Dow Theory In Place - Higher High and Higher Low Expected in Place
Formation of Harmonic Bullish reversal Pattern coupled with bullish divergence at potential reversal zone (PZR)
Entry at the new HH
SL & TP Levels are defined.

PNB AT MONTHLY BREAKOUT RETRACEMENT✔️Monthly box breakout
✔️Monthly breakout retest
✔️PSU BANK SECTOR is strong
✔️Looks good for investment
✔️Target 61/69/88+

W9.1-38 ETHERUM BULLISH IDEA (DOUBLE BOTTOM)Potential Bullish Entry Dow Theory In Place - Higher High and Higher Low Expected in Place Formation of DOUBLE bottom coupled with bullish divergence (Bullish reversal pattern) SL & TP Levels are defined.

W9.1-34 CADHKD BULLISH IDEA (HARMONICS PATTERN)Potential Bullish Entry
Dow Theory In Place - Higher High and Higher Low Expected in Place
Formation of Harmonic Bullish reversal Pattern coupled with bullish divergence at potential reversal zone (PZR)
Entry at the new HH
SL & TP Levels are defined.

A Market in Equilibrium?The current price of Ethereum is 1840 and it's been hovering around this range for a while now. Looking at the 1-hour timeframe, we can see that the change in the past 24 hours is -0.69%. This is a slight dip, but nothing too alarming just yet.
The RSI is currently at 48, which indicates that Ethereum is neither oversold nor overbought at the moment. In terms of Fibonacci levels, the 1-hour timeframe 0 Fibonacci is at 1827, the 0.5 Fibonacci is at 1858, and the 1 Fibonacci is at 1890. So we have some key levels to watch out for here.
Now, let's take a look at the Bollinger Bands. The upper band is at 1877, the lower band is at 1834, and the middle band is at 1856. The current price is close to the middle band, so we might see some consolidation around this level.
The volume oscillator is at -7%, which indicates a slight decrease in volume. The MACD is currently at -3, which is a bearish signal. However, the stochastic oscillator is at 50, which is a neutral signal. So we have some conflicting signals here.
The EMA 50 is at 1863, which is also close to the current price. The On-Balance Volume (OBV) is currently at -284.930K, which indicates that there might be more selling pressure at the moment.
So what does all of this mean for trading? Well, the support levels to watch out for are around 1827 and 1834, while the resistance levels are around 1877 and 1890. If Ethereum breaks above the resistance levels, we might see some bullish movement toward the next resistance level. On the other hand, if Ethereum breaks below the support levels, we might see some bearish movement toward the next support level.
In terms of bullish and bearish scenarios, a bullish scenario would be if Ethereum breaks above the resistance levels and continues to climb toward the next Fibonacci level. The target for this scenario would be around 1920. On the other hand, a bearish scenario would be if Ethereum breaks below the support levels and continues to fall toward the next Fibonacci level. The target for this scenario would be around 1780.
Overall, there are some conflicting signals at the moment, but we have some key levels to watch out for. As always, it's important to keep an eye on the market and adjust your strategy accordingly.

W9.1-13 GOLD BULLISH IDEA (HARMONICS PATTERN)Potential Bullish Entry
Dow Theory In Place - Higher High and Higher Low Expected in Place
Formation of Harmonic Bullish reversal Pattern coupled with bullish divergence at potential reversal zone (PZR)
Entry at the new HH
SL & TP Levels are defined.

W9.1-12 USDJPY BEARISH IDEA (DOUBLE TOP)Potential Bearish Entry
Dow Theory In Place - Lower High and Lower Low Expected in Place
Formation of DOUBLE Top coupled with bearish divergence (Bearish reversal pattern)
SL & TP Levels are defined.

W9.1-11 PALLADIUM BULLISH IDEA (BULLISH FLAG)POTENTIAL BULLISH ENTRY
Dow Theory In Place - higher highs and higher lows Expected in Place (Trend continues)
Formation of bullish flag coupled (continuation pattern)
SL & TP Levels are defined.

Mixed Market Signals Suggest Caution AheadAlright, let's take a closer look at Bitcoin and see what the current market conditions are telling us. Bitcoin is currently trading at $27650 with a 24-hour change of +1.25%. Looking at the Relative Strength Index (RSI), we can see that it's currently sitting at 45, which suggests that the market is neither oversold nor overbought.
Now, let's move on to the Fibonacci levels. The daily timeframe for Bitcoin shows 0.0 at 31018, 0.5 at 25281, and 1.0 at 19545. The support level for Bitcoin is at $25281, which is the 0.5 Fibonacci level. On the other hand, the resistance level is at $31159, which is the upper Bollinger band on the daily timeframe.
The Bollinger Bands are also worth looking at. The upper Bollinger band is currently at $31159, the lower Bollinger band is at HKEX:26768 , and the middle Bollinger band is at $28963. If Bitcoin can break above the upper Bollinger band, we might see some bullish activity in the market.
Moving on to the volume oscillator, we can see it's at -12.65%, which is quite low. This suggests that there is currently low volume in the market. The MACD is at +227, which is a positive signal for Bitcoin. Furthermore, the Stochastic Oscillators are at 13.38, which suggests that the market is oversold.
The Exponential Moving Average (EMA) for 100 days is at 25243, and the On-Balance-Volume (OBV) is at -1.647M. If Bitcoin manages to break above the 100-day EMA, we might see some bullish activity in the market. However, if it falls below the 0.5 Fibonacci level, we might see some bearish activity.
In terms of targets, if Bitcoin breaks above the upper Bollinger band, the next target could be the 0.0 Fibonacci level at $31018. However, if it falls below the 0.5 Fibonacci level, the next target could be the 1.0 Fibonacci level at $19545.
In summary, the market conditions for Bitcoin suggest that it's neither oversold nor overbought, and there is a low volume in the market. The support level is at $25281, and the resistance level is at $31159. If Bitcoin breaks above the upper Bollinger band, we might see some bullish activity in the market, but if it falls below the 0.5 Fibonacci level, we might see some bearish activity.

Bulls Gain Momentum But Key Levels Hold the KeyEthereum is currently trading at HKEX:1872 , with a 24-hour increase of 1.21%. This means that the bulls are starting to gain some momentum, but it's still not enough to break through key resistance levels.
Speaking of resistance levels, Ethereum has two of them to contend with TSE:2136 and $2141. On the other hand, there are two support levels that Ethereum needs to maintain: $1754 and $1367.
Now, let's look at some of the indicators to help us understand the current state of Ethereum. First up are the Fibonacci retracement levels, which are 0, 0.5, and 1. Currently, Ethereum is trading below the 0 Fibonacci level, indicating that the trend is bearish. However, the bulls could turn things around if they can push Ethereum past the 0.5 level at $1754.
Next, we have the Bollinger Bands. Ethereum is currently closer to the lower Bollinger Band, which indicates that the price is nearing oversold levels. This could potentially lead to a reversal in the short term, especially since the Stochastic Oscillator is also in the oversold zone.
Moving on to the MACD, which is currently at +33.68, indicating a potential upward momentum. However, if the MACD falls below the zero line, it could signal a prolonged bearish trend.
In terms of trading volume, the Volume Oscillator is currently at -11.70%, which is lower than the average volume. This could mean traders are waiting to see if Ethereum can break through key resistance levels before jumping in.
Finally, the On-Balance-Volume (OBV) is currently at 43.046M, indicating that the buying pressure is higher than the selling pressure. This is a positive sign for the bulls, but they need to maintain this momentum if they want to see Ethereum reach its potential targets.
So, what are the bullish and bearish scenarios for Ethereum? If Ethereum can break through the upper Bollinger Band and the 0 Fibonacci level at $2141, it could experience strong upward momentum, potentially reaching its next resistance level at $3000. However, if Ethereum fails to break above the upper Bollinger Band and falls below its current support level at $1754, it could experience a downtrend, potentially reaching its next support level at $1367.
In summary, Ethereum is in a precarious position at the moment. While there are some bullish indicators, such as the MACD and OBV, there are also some bearish indicators, such as the fact that Ethereum is trading below the 0 Fibonacci level. Traders should keep a close eye on key support and resistance levels, as well as indicators such as the Stochastic Oscillator and the Volume Oscillator, to determine the best course of action.
