GOLD short term RETRACEMECENTThe price perfectly fulfills my last idea. The price hit the target. The market is ranging after making impulse move at the resistance. In my opinion gold might go down to test support from the resistance because the market is forming a potential triangle pattern or it might ranging market between 1990 - 1950 zone. I expect short term correction from the resistance. My goal is the support level at 1951.
Traders, if you liked this idea or if you have your own opinion about it, write in the comments. I will be glad 👩💻
Technicalindicators

Short-Term Bearish Pressure Despite Bullish Long-Term OutlookEthereum is currently trading at $1756, with a 1.73% decline in the past 24 hours. The Relative Strength Index (RSI) is at 51, indicating that the coin is in a neutral state. The Fibonacci retracement levels indicate that the key levels to watch for are $1841, $1726, $1611, and $1468.
In the 4-hour timeframe, the upper Bollinger band is at $1825, the lower Bollinger band is at $1724, and the middle Bollinger band is at $1775. This suggests that the market is currently in a sideways consolidation phase.
The volume oscillator is at -7.5%, indicating that the trading volume is lower than usual. The Moving Average Convergence Divergence (MACD) is at 8, which suggests that the coin is in a bullish trend.
The stochastic oscillator is at 31, which indicates that the coin is oversold in the short term. The hourly EMA 50 is at $1713, which could act as a support level if the price falls.
The On-Balance Volume (OBV) is at 21.358M, indicating that the buying pressure is still present in the market.
Taking into account the recent news that Ethereum bulls are bracing for a quick drop, it is possible that the coin could see a short-term decline. However, the overall trend remains bullish, as indicated by the MACD.
In conclusion, while the short-term outlook for Ethereum may be bearish, the long-term trend remains positive. Traders should watch the Fibonacci retracement levels and support levels closely, as they could act as key levels in the coming days.

Neutral Territory with Short-Term Bearish Trend Ahead of FOMCBitcoin's current price is $28070 with a -0.87% change in the past 24 hours. The Relative Strength Index (RSI) is at 61.5, which suggests that the coin is currently in neutral territory. Looking at the Fibonacci retracement levels on the 4-hour timeframe, we see that Bitcoin is currently trading below the 0.5 Fibonacci level at $26184, which suggests that the short-term trend is bearish. However, the price is still above the 1.618 Fibonacci level at $21069, indicating that the long-term trend is still bullish.
The upper Bollinger band on the 4-hour timeframe is at $28375, which is acting as resistance for the coin. On the other hand, the lower Bollinger band is at $26780, providing support. The middle Bollinger band, which is currently at $27577, is acting as a neutral zone.
The volume oscillator is at -1.36%, suggesting that the current trading volume is lower than the average volume. The Moving Average Convergence Divergence (MACD) is at 560, indicating that the short-term trend is bullish. The stochastic oscillator is at 73, which is a neutral zone.
The hourly Exponential Moving Average (EMA) 50 is at $26045, acting as support for the price. The On-Balance Volume (OBV) is at 2.598M, suggesting that there is bullish sentiment in the market.
The Federal Open Market Committee (FOMC) meeting is approaching, which could impact the price of Bitcoin. Traders should keep an eye on the news to get a better idea of how the market may move.
Comparing this analysis to the previous analysis, we can see that the current price has decreased from $34543 to $28070. The RSI has shifted from overbought territory to neutral territory, indicating a decrease in buying pressure. The Fibonacci levels have shifted, with the coin currently trading below the 0.5 Fibonacci level, indicating a short-term bearish trend. The volume oscillator has shifted from a positive reading to a negative reading, suggesting that the current trading volume is lower than the average volume. The MACD has shifted from a bearish reading to a bullish reading, indicating a shift in the short-term trend. Finally, the OBV has increased from 1.398M to 2.598M, indicating an increase in buying pressure.

EURUSD FAKEOUT SIGNAL + DIVERGENCEEURUSD BEARISH Signal on 1 Hour Chart FAKEOUT RSI MACD
DEVERGENCE.

GOLD long from the strong SUPPORT levelThe market updated swing highs and price made divergence at the resistance zones then pulled back. The market is pulling back to the previous resistance that became support on the 4H timeframe. The market formed an ascending channel around this level. I think gold will retest the strong support at 1955 1950 zone, which is 50% of the daily candle. My goal is the resistance at 1989.

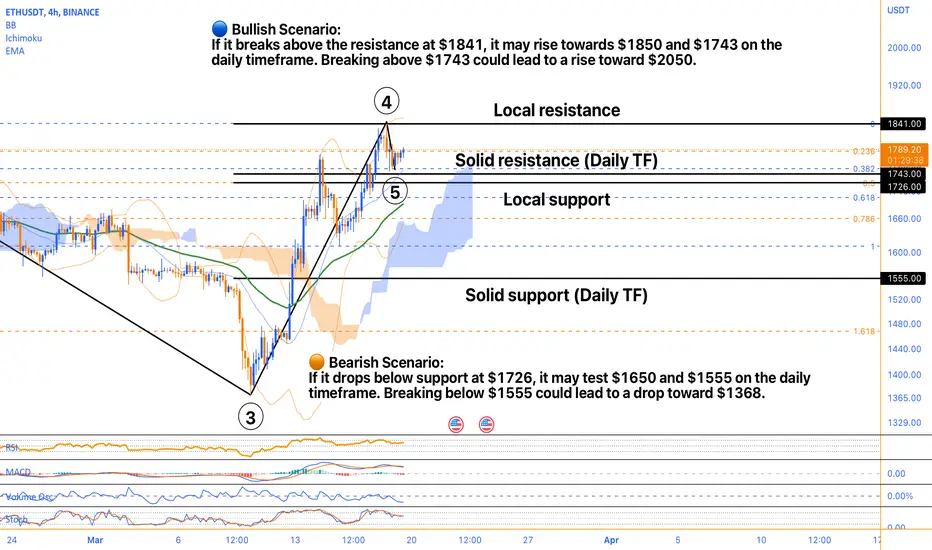
A Comprehensive Analysis of Price ActionAlright, let's dive into Ethereum's current situation and see what we can make of it. Ethereum is currently trading at $1776, and it seems to be playing it safe, consolidating between the upper and middle Bollinger bands on the 4-hour timeframe. However, it's not all smooth sailing as the volume oscillator is at -23.66%, indicating lower than average trading volume. This could make the price more susceptible to sudden moves in either direction.
Looking at the Fibonacci levels on the 4-hour timeframe, we can see that there's resistance at $1841 and support at $1726 and $1611. The price may test these levels, and it's essential to keep an eye on them to make informed trading decisions. Furthermore, the stochastic oscillator is at a low level, suggesting that the price may be oversold. However, the MACD is positive, indicating that the momentum is currently on the bullish side.
On the daily timeframe, the Fibonacci levels show that there's resistance at $1555 and $1743. If the price manages to break above $1743, it may continue to rise towards the upper Bollinger band on the daily timeframe. On the other hand, if the price drops below $1555, it may test the lower Bollinger band on the daily timeframe.
It's essential to consider the recent news about Bitcoin's market dominance hitting a 9-month high while altcoins are turning red. Ethereum is an altcoin, and its price could be impacted by the overall market sentiment towards altcoins. However, it's also important to remember that Ethereum is not just any altcoin. It's one of the most popular and widely used cryptocurrencies, with a strong developer community and a vast range of use cases.
In summary, Ethereum's current situation is a bit of a mixed bag. The price seems to be consolidating, but the lower trading volume could make it more susceptible to sudden moves. The Fibonacci levels and the stochastic oscillator suggest that the price may test certain levels, but the MACD indicates that the momentum is currently on the bullish side. Additionally, the recent news about Bitcoin's market dominance and altcoins turning red could potentially impact Ethereum's price. As always, it's essential to keep an eye on the indicators and market sentiment to make informed trading decisions.
CRUDEOIL WILL BREAKS OR HOLDS THE SUPPORT LEVEL ??? The crudeoil price trading near the strong support zone of 5880--5800 . If price breaks this level and closes below it on daily & weekly chart than we can see targets of 5600--5322---5032 towards the downside And if price respects the support level and shows the momentum of upside than we can see price moment towards the upside levels.

Deciphering SOL's Supports and Resistances in the Crypto MazeSolana (SOL) is currently trading at $21.60, and a variety of indicators suggest a complex picture for this cryptocurrency. On the one hand, the RSI is at 56, indicating that SOL is not currently overbought or oversold. On the other hand, the MACD is at 0.5, suggesting a potential bullish trend. The volume oscillator, however, is negative at -25%, indicating that there is currently a lack of buying pressure.
If we look at the Fibonacci levels in the 4-hour timeframe, we can see that SOL has fallen below the 0.5 level, indicating a possible bearish move. The 0 level is at $22.94, and the 1 level is at $18.70. The Stochastic oscillator is at 59, which is in the neutral zone, suggesting that the price is currently neither overbought nor oversold.
The upper Bollinger band on the 4-hour timeframe is at $23, the middle band is at $21, and the lower band is at $19. The current price is trading above the middle band but below the upper band, indicating a potential resistance level. All of these technical indicators suggest a complex picture of the price of SOL.
Recent news reports suggest that Bitcoin and other cryptocurrencies are bracing for an epic Fed U-turn after a $200 billion Ethereum, BNB, XRP, Cardano, Dogecoin, Polygon, and Solana price boom. This news could potentially impact the price of Solana positively, as it is one of the cryptocurrencies mentioned in the article. However, the market is highly volatile, and any news or event can impact the price of Solana in either direction.
Overall, the current technical indicators and recent news suggest that the future of Solana's price is uncertain. While the MACD suggests a potential bullish trend, the negative volume oscillator indicates a lack of buying pressure, and the Fibonacci levels and Bollinger bands suggest a potential resistance level. The recent news of an epic Fed U-turn could potentially impact the price positively, but it is important to keep an eye on all of the technical indicators to monitor any potential shifts in the price of Solana. The market is highly volatile, and any news or event can have a significant impact on the price.

Potential Targets for Bullish and Bearish ScenariosBitcoin's current price is $26,600, trading above the 0.5 Fibonacci level of $25,142 and close to the upper Bollinger band of $26,573, which may act as solid resistance. However, the 4-hour EMA 50 at $23,719 is a crucial local support level, while the 0 Fibonacci level at $23,897 is a solid support level that has not been tested recently.
The RSI is high at 74, indicating that the asset may be overbought. However, the MACD is bullish at 886, while the stochastic oscillator is at 87, which suggests that there may still be potential for further upside movement.
Bitcoin has already surpassed the 1 Fibonacci level at $26,387, and if it can hold above this level, it may continue to climb toward the 1.618 Fibonacci level at $30,107. Nevertheless, it is crucial to monitor the support levels, as the asset may retrace from the current resistance levels.
The Bollinger bands are another critical indicator to watch. The lower band is at $23,606, which may offer support if the price begins to drop. The middle band at $25,087 can act as a pivot point for traders, and a breakout above or below this level may signal a change in the asset's price movement.
The volume oscillator is currently negative at -5.91%, indicating lower trading activity than previous periods. However, this may change if there is a significant price movement.
Recent news has highlighted that 74% of Bitcoin holders are currently in the money as the asset's price has exceeded $26,000. This suggests that there may be a higher level of confidence among Bitcoin investors, which may further drive the price higher. Moreover, there is speculation that Bitcoin is gearing up for a bullish weekend, which may lead to increased buying pressure and further price appreciation.
In summary, Bitcoin's technical indicators and recent news suggest that the asset may continue to climb higher, although traders should keep an eye on potential resistance levels and support levels for potential trading opportunities and risk management.

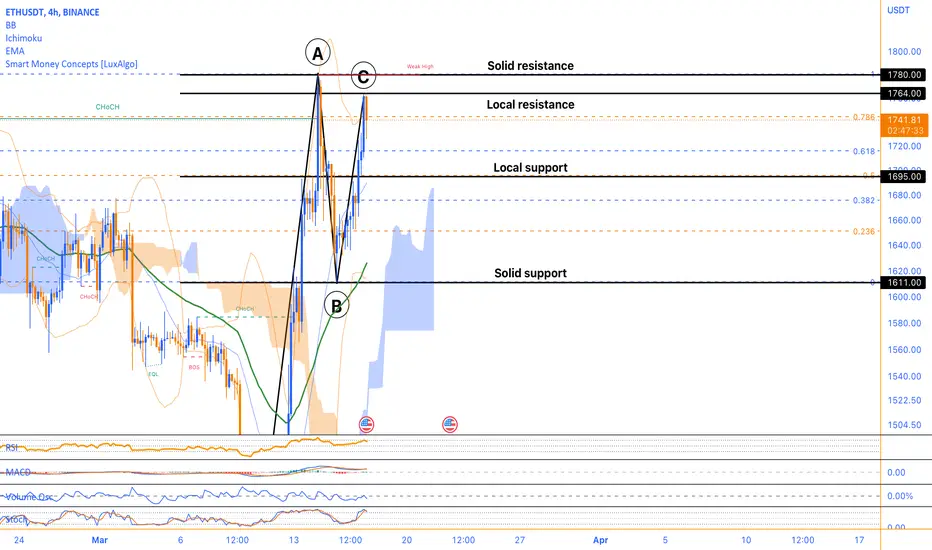
Riding the Bull, Key Support and Resistance LevelsLooking at the Ethereum chart, there are a few key prices that traders should keep an eye on. The current price is $1737, and technical indicators such as the RSI and stochastic oscillator suggest that the asset is currently in a bullish trend. The MACD is also positive, which indicates a strong momentum behind the asset's price movement.
However, there are also potential levels of support and resistance that traders should be aware of. The 0 Fibonacci level at 1611 could be a solid support level for the asset, as it is a significant Fibonacci retracement level. Additionally, the 0.5 Fibonacci level at 1695 could act as a local support level if the price were to experience any dips.
On the other hand, there are also potential levels of resistance to consider. The 1 Fibonacci level at 1780 could act as a solid resistance level for the asset, as it is a significant Fibonacci retracement level and close to the upper Bollinger band at 1764. Additionally, the upper Bollinger band could be a local resistance level to watch.
It is worth noting that the lower Bollinger band at 1615 could provide another level of support for the asset, while the middle Bollinger band at 1689 could provide an indication of the current price range. Furthermore, the volume oscillator is at -10%, which is not a strong indicator either way but is still worth considering.
In conclusion, traders should keep an eye on the potential levels of support and resistance, as well as the technical indicators, to make informed trading decisions. As always, risk management should be a priority to minimize potential losses.
GALA Price Action UnveiledGALA appears to be in a relatively stable position. The current price of $0.04250 is within the range of the upper and lower Bollinger bands. The RSI is at 54.60, indicating that the asset is neither oversold nor overbought. The MACD is slightly negative, which could suggest a potential bearish trend, but this alone should not be used as a signal to buy or sell.
The Fibonacci retracement levels can be used to determine potential support and resistance levels. The daily timeframe 0.5 Fibonacci level is currently at $0.04641, which could act as a strong resistance level. The daily timeframe 0 Fibonacci level is at $0.02990, which could serve as a support level.
The volume oscillator is at 4.22%, which is not particularly high or low, suggesting that there is moderate trading activity. The stochastic oscillator is at 82, which is relatively high and could indicate that the asset is overbought. However, this should be taken in the context of other indicators and should not be used alone to make trading decisions.
So GALA appears to be in a relatively stable position. It's important to consider all available information and conduct further research before making any investment decisions.


A Deep Dive into Bitcoin's Technical Analysis and News ImpactBitcoin's current price is $24700, and it's being analyzed over a 4-hour timeframe. The Relative Strength Index (RSI) is 64, indicating that the cryptocurrency is in slightly overbought territory but still has some room to grow. The Volume oscillator is -8.52%, which indicates lower trading volume than average. The Moving Average Convergence Divergence (MACD) is currently at 1010, which indicates that the bullish momentum is strong, but it could turn into a bearish one if the trend reverses.
On the technical side, the 4-hour timeframe Fibonacci retracement levels suggest that Bitcoin's support levels are at 0.5 Fibonacci level of $22967 and 1 Fibonacci level of $19549, and resistance levels are at 0 Fibonacci level of $26386 and upper Bollinger band of $26813. The lower Bollinger band of $19820 is acting as strong support. The middle Bollinger band of $23317 indicates the average price level.
Bitcoin is facing a sharp correction in its price. The Paxful founder called the recent pump to $26000 as weak, indicating that it could be a bubble. On the other hand, a South Korean trader lost almost $1 million by shorting Bitcoin.
Based on the technical analysis, it seems that the current price of Bitcoin is likely to experience some resistance at the 0 Fibonacci level of $26386 and the upper Bollinger band of $26813. It may also find some support at the 0.5 Fibonacci level of $22967 and the lower Bollinger band of $19820. The sharp correction could have contributed to the lower trading volume indicated by the volume oscillator. The Paxful founder's statement may have added to the bearish sentiment, but the strong bullish momentum indicated by the MACD and Stochastic oscillators suggests that the current price drop may not last for long.
Regarding opening long or short positions, it depends on an individual's trading strategy and risk tolerance. However, here are some possible scenarios:
Long position: If the price bounces off the strong support levels and starts to move upwards, it could be a good spot to open a long position. Additionally, if the price breaks above the strong resistance levels with strong momentum, it could also be an opportunity to open a long position.
Short position: If the price breaks below the strong support levels with strong momentum, it could be a good spot to open a short position. Additionally, if the price reaches strong resistance levels and shows signs of rejection or reversal, it could also be an opportunity to open a short position.
It's essential to keep in mind that any trading decision should be made with proper risk management techniques in place, such as setting stop-loss orders and taking profits at predetermined levels. Additionally, traders should keep an eye on any relevant news or events that could impact the price of Bitcoin.

Riding the WavesLooking at the current price of Ethereum, it is trading at $1666, which is below the upper Bollinger band of $1808 but above the 4-hour EMA 50 of $1585. The RSI of 57.72 indicates that Ethereum is currently in a neutral zone and not overbought or oversold. However, the volume oscillator of -14.66% suggests that there is a lack of interest in the market, which could be a concern.
Despite the lack of interest in the market, Ethereum's MACD of 53.32 and Stochastic oscillator of 48.40 suggests that the price is in an uptrend. This could be good news for investors looking to open long positions. Additionally, the news article predicting that Ethereum's price could reach $1800 in the near future further supports the bullish sentiment.
Looking at the Fibonacci levels, Ethereum has strong support at the 0.5 Fibonacci level of $1574. If the price were to drop below this level and rebound, it could be a good spot for traders to open long positions with a stop-loss below the support level. On the other hand, if Ethereum breaks above the upper Bollinger band of $1808 with strong bullish momentum, it could be a good spot to open long positions with a stop-loss above the resistance level.
It is also important to consider the solid support level at the 1 Fibonacci level of $1368. This level could be a good spot for long-term investors to accumulate more Ethereum in case of a price decline. Additionally, traders should keep an eye on the psychological level of $2000, which could act as a solid resistance level. Breaking above this level could indicate a strong bullish trend and a good opportunity to open long positions.
In summary, Ethereum's current price, RSI, and volume oscillator suggest a neutral market sentiment, but the MACD and Stochastic oscillator indicates an uptrend. Traders should consider the support and resistance levels mentioned above when opening positions, and investors may want to accumulate more Ethereum at the solid support level of $1368. Keeping an eye on the psychological resistance level of $2000 is also important for traders.

The Battle of the Supports and ResistanWe're looking at Ripple's current price of $0.3630. Looking at the RSI, it's sitting pretty in the neutral zone at 45.60, so there's not a lot of indication of which direction it might be headed. However, the volume oscillator is down at -17.47%, which suggests that there hasn't been a lot of trading activity lately.
Moving on to the Fibonacci retracement levels, the 0.5 level at 0.3672 could be an important support level if the price drops. If it falls below that, it could head toward the 1 level at 0.3473. But if it bounces back up, we might see it head toward the 0 level at 0.3870.
The Bollinger bands on the 4-hour timeframe are showing that the middle band is at 0.3685, with the upper band at 0.3814 and the lower band at 0.3557. So if the price is able to break through that upper band, we might see some resistance there, and if it falls below the lower band, there might be some support.
Now, let's talk about the news. Apparently, the US Fed is launching FedNow in July to counter Ripple. This could have a significant impact on Ripple's price, as it might reduce the demand for its services. So it's definitely something to keep an eye on.
Ripple's price is currently in a bit of a holding pattern. It's hard to say which way it might go, but if it does start to move, we should keep an eye on those Fibonacci levels, the Bollinger bands, and the news about FedNow.

PETRONET BREAKOUT SOON !!1 The price was taking resistance from the long time. Price taken support from the support zone and now trading near resistance and resistance area of 226-232.If price breaks the level of 232 and closes than good move possible towards the upside. After breakout can enter in long position for the target of 230/260/300 in next coming trading sessions.
#PETRONET
👉 Chart Setup looks good👍
👉 Breakout Possible Above 232-34📈
👉Above Breakout Good Upmove can be seen📈
👉Buy Above Breakout For 230/260/300+🎯
👉Keep On radar✅
Traders, if you liked this idea or if you have your own opinion about it, write in the comments. I will be glad.

HINDUNILVR AT SUPPORT !!!Hello to everyone
Hindunilvr tradind near demand zone ..2420--2460. If price respects this level than We can see a reversal from the support level in coming days.If price taken support from the support level than we can see target of 2525--2600++ In next coming day's.
If price breaks the level of 2620 than support level will breakdown and price can move towards the downside.
Traders, if you liked this idea or if you have your own opinion about it, write in the comments. I will be glad.

HDFC BANK AT CRUCIAL LEVEL !!!#HDFCBANK ( W TF)
👉 The stock is taking Resistance from weekly supply zone And also Consolidating near the Resistance zone & The support is at 1575.✅
👉Weekly Close below the 1575 will lead the fall to the 1500/1450/1380( i.e Next Demand Zone) in next coming trading sessions.
👉Add to your radar✅

Quick Bitcoin Scan in the Morning Good morning everyone
Grab yourself a cup of coffee and enjoy this quick scan on Bitcoin!
Bitcoin has been consolidating overnight, shedding a lot of volatility, and opening up a window of opportunity for a Long and Short scenario on the coin.
Make sure to check the video out so that you don't miss a potential entry on Bitcoin!
Also, please leave a comment and share if you like videos like that.
Many thanks and have a fantastic one legends
All the best
CH

#BANKNIFTY INTRADAY LEVELS FOR TOMORROW !!!Hello to everyone
The price at crucial level. Downside breakdown and closing below the 39400--39300 will leads target of 38800 & 39400 in next coming sessions. Here sharing intraday levels to trade tomorrow.
Traders, if you liked this idea or if you have your own opinion about it, write in the comments. I will be glad.

Bitcoin's Price on a Roller Coaster!Bitcoin is currently trading at $24,700, and it's looking pretty overbought with an RSI of 77.5. The price has been making some impressive gains recently, surpassing the 0.5 Fibonacci retracement level of $21,105, and the 1 Fibonacci retracement level of $22,662. Now, it's sitting pretty close to the 1.618 Fibonacci retracement level at $24,585, which could act as solid resistance in the short term.
But wait, there's more! The upper Bollinger band on the 4-hour timeframe is at $25,700, which is also close to the current price. This means that Bitcoin could face some significant resistance at this level. On the other hand, the 4-hour EMA 50 is at $22,135, which could provide some support if there's a price correction.
Moreover, the volume oscillator is at -17.63%, indicating that the trading volume is lower than usual, and the stochastic oscillator is at 96, which suggests that Bitcoin is trading near its overbought zone. These two indicators combined could potentially signal a consolidation phase for the cryptocurrency.
However, traders and investors should keep an eye out for potential market-moving events, such as regulatory announcements, institutional buying, or changes in market sentiment, which could cause volatility in the price of Bitcoin.
In terms of support levels, we have local support at $21,105, which is the 0.5 Fibonacci retracement level. But if there's a significant price correction, the 0 Fibonacci retracement level at $19,549 could act as a more solid support level.
To sum it up, Bitcoin's price is currently at a high point, but there's potential for resistance at the 1.618 Fibonacci retracement level and the upper Bollinger band. The trading volume is lower than average, and Bitcoin is trading near its overbought zone, which could lead to a consolidation phase. However, traders and investors should stay alert for potential market-moving events, and keep an eye on the support levels at $21,105 and $19,549, in case of a price correction.

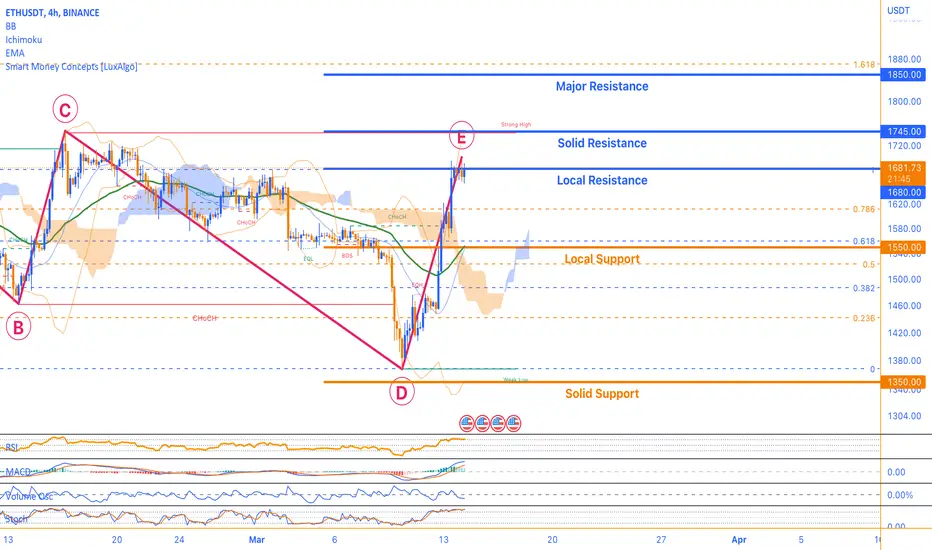
Ethereum's Key Support and Resistance LevelsEthereum is currently trading at the $1,680 area with an RSI of 73 in a 4-hour timeframe. The 4-hour timeframe Fibonacci levels are 0.0 at $1,368, 0.5 at $1,523, and 1.0 at $1,677. The upper Bollinger band is at $1,745, while the lower Bollinger band is at $1,350, and the middle Bollinger band is at $1,547. The volume oscillator is currently at -14.74%, MACD is at 51.5, and Stochastic oscillators are at 93. The 4-hour EMA 50 is currently at $1,551.
According to the news articles, Ethereum's price is holding strong at $1,650, and investors are being advised to buy the dip. The recent dip in the cryptocurrency market has presented an opportunity for investors to buy Ethereum at a discounted price.
The RSI value of 73 suggests that Ethereum is currently overbought, which means that there is a possibility of a price correction. However, the MACD value of 51.5 indicates that Ethereum's price is currently bullish. This suggests that despite the overbought conditions, Ethereum's price could still go up in the short term.
The Fibonacci levels suggest that if Ethereum's price were to correct, the 0.5 Fibonacci level at $1,523 could provide strong support. The upper Bollinger band at $1,745 suggests that Ethereum's price could face resistance at this level. On the other hand, the lower Bollinger band at $1,350 provides a strong support level.
The volume oscillator value of -14.74% indicates that there is currently low trading activity in Ethereum, which could result in a lack of momentum in the short term.
The 4-hour EMA 50 at $1,551 provides an additional support level for Ethereum's price. Overall, the technical analysis suggests that Ethereum's price could face resistance at the upper Bollinger band at $1,745, but the MACD value indicates that the price could still go up in the short term.
Investors should monitor the price closely and consider buying at the dip, as suggested by the news articles. However, they should also be aware of the potential for a price correction due to the overbought conditions indicated by the RSI value.
There are a few key price levels that traders should pay attention to on the Ethereum chart. Firstly, there's a potential support level of around $1,550. This level has acted as support multiple times before and is also located close to the 4-hour EMA 50, making it a potentially significant area of support.
Another potential support level is around $1,350, which is in close proximity to the lower Bollinger band and the 0.0 Fibonacci level on the 4-hour timeframe. Traders may look to buy in around this level if Ethereum were to drop to it.
On the resistance side, there's a potential level around $1,680, which is where Ethereum is currently trading. This level has acted as both support and resistance in the past and could be a significant area to watch for potential price movement.
The upper Bollinger band on the 4-hour timeframe is also a potential resistance level of around $1,745. This level has acted as resistance in the past and could continue to do so in the future.
Finally, there's a major resistance level of around $1,850. This level has proven difficult for Ethereum to break through in the past, but if it were to do so, it could potentially signal a strong bullish trend. Traders should keep an eye on this level, but also be aware of other indicators such as trading volume and RSI before making any trading decisions.
RSI BULLISH DIVERGENCE ON WEEKLY CHART !!!!Hello to everyone
The price perfectly fulfills my last idea. The market was trading at all time high level of 1397 and fell from all--time high price because of RSI Bearish Divergence on weekly timeframe . The price hit the target of 1228. Now the price is near the strong weekly support zone . The level of 1200--1230 is strong demand zone and there is RSI Bullish Divergence on daily timeframe. The 200 day's EMA also at the support level which is performs as strong support . Near the support level RSI Bullish Divergence + 200 EMA can play a crucial role for swing reversal. The price can take support at the mentioned support level and may go upside for the initial upper targets. My first initial target is 1290 & 1330- 1360.
Traders, if you liked this idea or if you have your own opinion about it, write in the comments. I will be glad.
