SNX : INCREASE VIEWSNX is also one of the coins that will get a follow for the next 24H to see if it's able to confirm.
Technicalindicators

BAJAJFINSV RSI BULLISH DIVERGENCE !!!The price near ascending channel support of 1280--1320 and also there is RSI Bullish Divergence on weekly and daily timeframe. We seen a good correction in price an now price forming strong base to go upside. If price respects the channel support than than price can go upside for the targets of 1435--1500-1600 in next trading sessions.

RSI BULLISH DIVERGENCE ON WEEKLY CHART !!!!Hello to everyone
The price perfectly fulfills my last idea. The market was trading at all time high level of 1397 and fell from all--time high price because of RSI Bearish Divergence on weekly timeframe. The price hit the target of 1228. Now the price is near the strong weekly support zone. The level of 1200--1230 is strong demand zone and there is RSI Bullish Divergence on daily timeframe. Near the support level RSI Bullish Divergence can play a crucial role for swing reversal. The price can take support at the mentioned support level and may go upside for the initial upper targets. My first initial target is 1290 & 1330- 1360.
Traders, if you liked this idea or if you have your own opinion about it, write in the comments. I will be glad.

Bitcoin's Volatility and Potential Rebound: A Technical AnalysisBitcoin is currently priced at $20,170, down from its all-time high of $64,863 in April 2021. The recent news of Bitcoin crashing from $20k to $18k in a single day shows that the cryptocurrency is still volatile and subject to sudden price drops. However, some analysts suggest that now may be a good time to buy Bitcoin, as it has hit its bottom and may see an upward trend soon.
Regarding the technical indicators, the RSI is 34.28, indicating bearish sentiment. The volume oscillator is at -12.5%, suggesting that there has been a decrease in trading volume. The MACD is at -569, which is also bearish. However, the stochastic oscillator is at 27.9, which shows that Bitcoin is oversold and may rebound soon.
The Fibonacci retracements give us some price levels to watch. The 0.5 Fibonacci level is at $21,105, above the current price, and the 1 Fibonacci level is at $22,662, even higher. The upper Bollinger band is at $22,552, above the 1 Fibonacci level, and the lower Bollinger band is at $19,084, below the current price. Between the upper and lower bands, the middle Bollinger band is at $20,818.
Overall, the technical indicators suggest that Bitcoin is on a downward trend, but the stochastic oscillator hints that it may soon rebound. The news about long-term holders holding their Bitcoin during the price decline may indicate that there is still a strong belief in the future of the cryptocurrency. If you're considering investing in Bitcoin, it's important to research and assesses the risks involved. Remember, cryptocurrencies are still a relatively new asset class subject to high volatility.
Local support: $18,000 - This is the recent low that Bitcoin dropped to before rebounding slightly. It could be considered a short-term support level.
Solid support: $19,549 (0 Fibonacci level) - This is the first Fibonacci retracement level on the 4-hour timeframe, and it held as support during Bitcoin's previous price decline in January 2021. It could be considered a more significant support level.
Local resistance: $20,818 (middle Bollinger band) - This is the current price level that Bitcoin is hovering around, and it's also the middle Bollinger band on the 4-hour timeframe. It could be considered a short-term resistance level.
Solid resistance: $22,552 (upper Bollinger band) - This is the upper Bollinger band on the 4-hour timeframe and is close to the 1 Fibonacci retracement level. It could be considered a more significant resistance level.
Of course, these support and resistance levels are not set in stone and may shift over time depending on market conditions. Traders and investors should always use multiple indicators and analysis techniques to make informed decisions about buying or selling Bitcoin.

Mapping Ethereum's Key Support and Resistance LevelsEthereum's price is currently at $1,430, significantly lower than its all-time high of $4,362 in May 2021. The recent market-wide correction, concerns over high gas fees on the Ethereum network, and increased competition from other blockchain platforms have all contributed to the current price decline.
Ethereum is oversold in the short term, with an RSI of 37 and a Stochastic oscillator level of 34. The Fibonacci retracement levels also suggest that the 0.5 level at $1,523 could serve as a resistance level in the short term, while the 0 level at $1,368 could serve as a support level.
The Bollinger Bands are also indicating potential support and resistance levels. The middle Bollinger Band, currently at $1,474, could act as a support or resistance level, while the upper Bollinger Band, which is at $1,594, could act as a resistance level. The lower Bollinger Band, at $1,355, could act as a support level.
The MACD is currently negative at -35.79, indicating a negative momentum, while the 4-hour EMA 50 is at $1,518, suggesting that Ethereum's price is below its long-term moving average. The volume oscillator value of 2.27% suggests that Ethereum is experiencing low volume, which could lead to increased volatility.
Overall, the combination of technical indicators and fundamental factors suggests that Ethereum's price could continue to experience volatility in the short term. Still, some analysts believe the current correction could be a healthy sign for the long-term sustainability of Ethereum's price. Traders and investors should closely monitor these indicators and consider potential support and resistance levels to make informed trading decisions.
The 0 Fibonacci level, at $1,368, could serve as a local support level. The lower Bollinger Band, at $1,355, could also serve as a local support level.
The 0.5 Fibonacci level, which is at $1,523, could serve as a local resistance level. The upper Bollinger Band, at $1,594, could also serve as a local resistance level.
The 0 Fibonacci level at $1,368 could also serve as a solid support level, as it has historically been strong. The 4-hour EMA 50, currently at $1,518, could also serve as a solid support level, as it represents a longer-term moving average.
The all-time high of $4,362, achieved in May 2021, could serve as a solid resistance level. The 1 Fibonacci level, at $1,677, could also serve as a solid resistance level, representing a major retracement level.
Traders and investors should closely monitor these key prices and consider potential support and resistance levels when trading. It is important to note that support and resistance levels are not set in stone and can change over time, so staying up-to-date with the latest market developments and adjusting trading strategies accordingly is crucial.

M_M Bearish Divergence!!!The Price perfectly respecting the ascending parallel channel. Monthly chart showing 4 bar RSI Bearish Divergence as well as weekly chart also showing bearish divergence between price & its RSI momentum. Good opportunity to sell here as price also trading near all time high price.My target will be 1328---1267 & 1228 in coming day's.

Adding to my btc prediction long termNot sure how to add charts to existing published ideas so making this separate for now, which is just another indicator to use for my point of view and perspective, is the 3day anti gartley formed for anyone into harmonics trading, although I personally do not use them much, but do believe on a more macro chart such as this 3day that they do have some significance, esp when used in confluence for everything already mentioned in my main BTC prediction using fib circles, and fib channels. This ant gartley shows a take profit amount of $9.5k which would perfectly align with my main chart and would be almost pinpoint precise to my exact main target prediction which would take out that CME futures gap that I so strongly see us retracing to as the final bottom of this bear market. Therefore, lets rock n roll and see how this thing plays out over time, accumulating the final bottom sometime very close to our fall equinox. Godspeed and goodluck making that money

GAIL WHAT NEXT MOVE ???The price trading near strong resistance zone of 111--115, this level is strong hurdle for the price. price at make or break level now. What will the next move of price. Will price breaks the resistance zone moves towards the upside level or price gets rejection from the resistance and slopes down towards the downside.
#GAIL (W TF)
👉Price at strong resistance zone 111--115✅
👉If Breakout than good upmove possible
👉 Interesting Chart setup
👉After breakout price can go for targets of 120/125/130+

NZDCAD BULLISH FLAG PATTERN Okay, NZDCAD respect daily time for Support and trade move to continue the channel. NZDCAD builds up DOUBLE BOTTOM Pattern with BULLISH FLAG Pattern and breaking Flag range with retest 30 Mint chart EXPONENTIAL 20, 50, 100, 200, Cross over all EMA and Retest 20 EMA, 50 EMA, MOVE UP SIDE again. then I open Long Trade.

Short-term Bearish Trend with Potential for ReversalLet's look at Bitcoin's current situation in a 4H timeframe. Bitcoin's current price is at $22,080, which is below the 0 Fibonacci level of $22,662 in the 4-hour timeframe. This suggests that there might be some bearish pressure in the short term. However, the RSI is only at 37.15, which indicates that the asset is not yet oversold. Nonetheless, it's still close to the oversold threshold of 30.
On the other hand, the volume oscillator is at -4.17%, implying a decreasing trading volume. Furthermore, the MACD is at -149, which suggests bearish momentum. However, the stochastic oscillators are at 32, which is relatively low, indicating a possible bullish reversal.
Additionally, looking at the Fibonacci levels, Bitcoin is trading below the 0.5 Fibonacci level of $22,316 and the 1 Fibonacci level of $21,971. This indicates that there may be more bearish momentum in the short term.
In terms of Bollinger bands, the upper band is at $22,617, the middle band is at $22,304, and the lower band is at $21,990. Bitcoin's current price is closer to the lower band, which indicates that the price may be oversold and could rebound.
Taking into account the recent news mentioned in the article about Bitcoin facing resistance at the $23,000 level, it is likely that the price will continue to face resistance at this level, which could cause a price correction. Nonetheless, if the price breaks above this resistance level, it could indicate a bullish trend reversal.
Bitcoin is currently in a short-term bearish trend, with a possible bullish reversal. Traders should monitor the key levels, such as the $23,000 resistance level and the 4-hour EMA 50 at $22,600. This will help them to identify potential buying or selling opportunities in the coming days.
There are a few key support and resistance levels to watch for Bitcoin.
The first resistance level to watch is $23,000, which was mentioned in the news article as a level where Bitcoin faces resistance. If Bitcoin breaks above this level, it could indicate a bullish trend reversal.
On the downside, the 4-hour timeframe at 0 Fibonacci level of $22,662 and the 4-hour EMA 50 at $22,600 are important to support levels to watch. If Bitcoin breaks below these levels, it could continue the short-term bearish trend.
The upper Bollinger band at $22,617 is a solid resistance level to watch, while the lower Bollinger band at $21,990 is a strong support level. If the price moves towards the upper band and fails to break above it, it could indicate further bearish pressure. Conversely, if the price approaches the lower band and manages to rebound, it could mean a potential reversal.
Finally, the 0.5 Fibonacci level at $22,316 and the 1 Fibonacci level at $21,971 are also important to support levels to keep an eye on. If Bitcoin breaks below these levels, it could suggest that the bearish momentum is gaining strength.
These support and resistance levels are important for traders to monitor when making trading decisions. By paying close attention to these levels, traders can identify potential buying or selling opportunities, manage risk, and make informed trading decisions.

Bullish Momentum Amidst Bearish PressureLet's take a look at Ethereum's current situation. ETH is currently priced at $1,560, which is a good sign. The RSI is at 44.80, indicating that the market is not oversold or overbought and is in a neutral zone. The Fibonacci retracement levels for Ethereum are also showing a potential bullish momentum.
The current price of Ethereum is above the 0 Fibonacci level, which is at $1,536. Additionally, the upper Bollinger band is at $1,576, the lower band is at $1,563, and the middle band is at $1,550—the current price hovers above the middle band, also a good sign for the bulls.
However, we can see some indicators that may suggest a bearish trend. The MACD is currently at -7, indicating a short-term bearish trend. Additionally, the volume oscillator is at -6.85%, which suggests low trading activity is happening right now.
On the other hand, the stochastic oscillator is at 48, which means there is still a potential for the price to move up or down soon. The 4-hour EMA 50 for Ethereum is at $1,582, above the current price, indicating the potential to continue moving upwards.
Bears are in action, and the price may drop to $1,580. However, based on the technical analysis, the current price is still above the middle Bollinger Band, indicating bullish momentum. So, while there may be some bearish pressure, the bulls are still in control.
Overall, monitoring these indicators closely is essential to make informed trading decisions. The current situation for Ethereum is a mix of bullish and bearish signals, and it's important to consider them before making a move.
Local support: The 4-hour EMA 50 is currently at $1,582, a key local support level. If the price of Ethereum drops below this level, it could indicate a bearish trend.
Solid support: The 0.5 Fibonacci level at $1,607 is a solid support level for Ethereum. If the price of Ethereum drops below this level, it could indicate a more significant bearish trend.
Local resistance: The upper Bollinger Band at $1,576 is a local resistance level for Ethereum. If the price of Ethereum surpasses this level, it could indicate a potential bullish momentum.
Solid resistance: The 1 Fibonacci level at $1,677 is a solid resistance level for Ethereum. If the price of Ethereum surpasses this level, it could indicate a strong bullish momentum.
It's important to note that these key prices are not set in stone and can change based on the market's behavior. Traders should continuously monitor these levels and use them to guide informed trading decisions.

Solana appears to be in a bearish trendSolana is a cryptocurrency asset currently trading at 19.19. The timeframe for this analysis is 4 hours, and the Relative Strength Index (RSI) is at a level of 28. The RSI is a momentum indicator that measures the speed and change of price movements. A reading below 30 is considered oversold, meaning the asset may be undervalued, and a buying opportunity might arise.
Traders widely use the Fibonacci levels to identify potential support and resistance levels. In the 4-hour timeframe, the 0 Fibonacci level is 21.72, and the 1 Fibonacci level is 20.20. These levels can be used as potential support levels if the price moves upward.
The Bollinger Bands are a technical indicator that measures the volatility of an asset's price. The upper Bollinger band for the 4-hour timeframe is at 21.73, which indicates a resistance level if the price moves upwards. The lower Bollinger band is at 19.22, which could be a support level if the price drops. The middle Bollinger band is at 20.48, which indicates the asset's average price.
The volume oscillator is a technical indicator that measures the volume of an asset traded over a specific period. It is currently at 27.82%, indicating moderate trading activity for Solana. A high volume can indicate strong buying or selling pressure, whereas a low volume can indicate a lack of interest or uncertainty among traders.
The Moving Average Convergence Divergence (MACD) is a trend-following momentum indicator that shows the relationship between two moving averages. A negative MACD value of -0.52 suggests that the asset is in a bearish trend and that the price will likely continue to fall.
Lastly, the Stochastic oscillator is a technical indicator that measures the momentum of the asset's price. The Stochastic oscillator for Solana is at 20, indicating that the asset is oversold, and the price may be due for a reversal.
Solana appears to be in a bearish trend, with the price falling toward the lower Bollinger band and oversold levels indicated by the RSI and Stochastic oscillator. However, the Fibonacci levels and the middle Bollinger band can be used as potential support levels if the price starts to move upwards. Traders also want to pay attention to changes in the volume oscillator and MACD for further insights into the market sentiment.

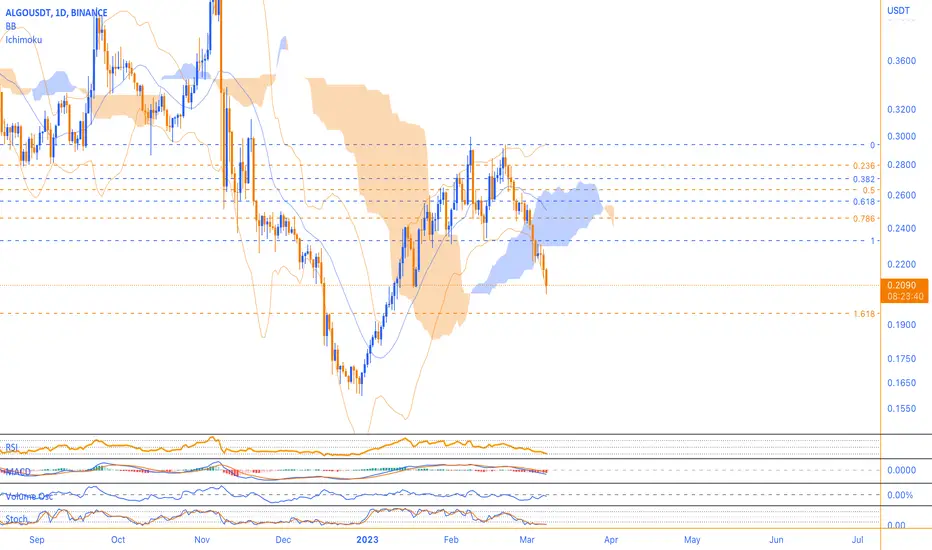
ALGO is in a downtrend and oversoldALGO's current price is 0.2070, below the 0.2938 Fibonacci retracement level, indicating that the asset is a downtrend. Additionally, the RSI is at 30.95, below the 50 level, meaning that the asset is oversold.
The upper Bollinger band on the daily timeframe is currently at 0.2950, while the lower Bollinger band is at 0.2063, indicating a wide range for potential price movements. The middle Bollinger band, at 0.2506, represents the 20-day moving average and is currently acting as a resistance level for the asset's price.
The volume oscillator is at -6.30%, which indicates a decrease in trading volume. The MACD is currently at -0.0104, below the signal line, showing bearish momentum. The stochastic oscillator, at 2.41, is below the oversold level of 20, indicating that the asset is oversold.
It's worth noting that the Algorand Foundation has recently issued an action statement on a security exploit, which could impact the asset's price in the short term. Traders and investors should monitor the situation closely to determine if further action is necessary.
Overall, ALGO is in a downtrend and oversold, with a wide range of potential price movements. Traders and investors should exercise caution and closely monitor the situation to determine if further action is necessary.
COROMANDEL FORMS NEW HH and HL !!!1Hello to everyone
As we can see on the chart the stock was trading in downtrend and has seen a sharp decline in the price. Stock continuously formed LH and LL , which confirms that price was trading in downtrend as per the Dow Theory , But this time the price has formed a higher low instead of making lower low, which indicates that the downtrend of the price has ended and now the trend reversal can happen in the price and price can go upside in next coming trading sessions. The upper targets of price are 970---1008--1055.
#COROMANDEL 📊
👉Ascending Parallel Channel Breakout
👉Retasted at upper parallel line
👉Price Made First HH and HL
👉Bullish Structure
👉Trend reversal after long decline period
👉Support 880/883
👉Targets --971/1008/1057
Traders, if you liked this idea or if you have your own opinion about it, write in the comments. I will be glad.

INVERTED HEAD & SHOULDER FORMATION !!!#OBEROIRLTY📊
👉Inverted Head & Shoulder Pattern📈📉
👉Breakout above 890+ Closing✅
👉Entry after Breakout
👉After Breakout possible targets 930/950/1000+🎯
👉Add to your watchlist👍

PFC FRESH BREAKOUT !!!Hello to everyone
The price consolidating in tringle from last 12 years and given fresh breakout towards the upside, also retested in lower timeframe. Chart looking strong in all time frames. Its good opportunity as an investment point of view. Expecting good upmove towards the upside.
#PFC
👉PSU Stock on radar.✅
👉12 years triangle consolidation.📈📉
👉Big upmove possible as investment
👉Support at 130
Traders, if you liked this idea or if you have your own opinion about it, write in the comments. I will be glad.

ISMT MULTIPLE YEARS CUP BREAKOUT!!!Hello to everyone
The price given multiple years cup pattern breakout with massive volume buildup. Breakout also done by good candle above the resolution point.
price consolidated for very long time near the resolution point an finally given the breakout above the resolution point. RSI also taking strong support at the 60 level and the price holds itself perfectly which is showing that price has enough momentum and potential to go upside for their upward targets.
The range of 40--42 is strong support zone for the price. After breakout we can expect targets of 100--130 in next coming days. After multiple years breakout expecting good move in price. Keep the stock to your radar list for good returns.
ISMT LTD
👉Multiple Years Cup Breakout ✅
👉Breakout after long time consolidation👍
👉Good volume Buildup✅
👉Strong Breakout
👉RSI at 60 support
👉After Breakout Possible Targets-- 100/130+
👉Keep on radar✅
Traders, if you liked this idea or if you have your own opinion about it, write in the comments. I will be glad.

NIFTYPSE INDEX >>MAKE OR BREAK LEVEL ??Hello to everyone
NIFTY PSE INDEX Trading near all time level Of 4687 and strong resistance zone of 4380-- 4580. This zone is acted as strong resistance in past trading sessions. Price resisted number of time at this zone and slopes down towards the support zone . If price able to break this zone and ATH level than we can see new all time high level of the nifty pse index , and if price respects the resistance zone than price again slopes down. As per the chart setup , Here the higher probability of that price will breach the resistance zone and ATH level and will makes new high price.
If this breakout happen than all PSE Stocks can show good momentum and can give good returns
Traders, if you liked this idea or if you have your own opinion about it, write in the comments. I will be glad.

GBPNZD - I've got a trade idea for you!GBPNZD - I've got a trade idea for you!
As we await for Powell! I found a this great trade idea, it's a break to either direction...Now remember, we could get false break out!
Highs: 1.94570
Lows: 1.93620
Pattern: Triangle
A break to either direction, break of 200 EMA area takes you to 0.382 & 0.236Fib areas. However, if we break above the trendline down, I expect target areas 1.95 half areas and perhaps even 1.96 half area matching the 1.618 area!
Have a great day ahead,
Trade Journal

HAVELLS TRENDLINE BREAKOUT !!! The price following descending trendline resistance from a very long time. Whenever the price reaches near the trendline price taking resistance and slopes down. Now finally price breaks the trendline and closes above the trendline with good breakout candle. Price can retest the level of 1200 after breakout and than go up towards the upper targets. Above the level of 1245 price will show good strength and potential towards upside.
HAVELLS 📊
👉 Trendline Breakout👍
👉Strong Closing✅
👉Bullish Structure
👉More Strength above 1245+
👉Support ---1185
👉Keep on radar✅👍

IGL BREAKOUT SOON !!!Hello to everyone
#IGL 👉👉Daily + Weekly chart✅
👉 Ascending Traingle Pattern📈
👉Price Consolidating from long time📈📉
👉Breakout above 455+ Closing✅
👉Entry after Breakout
👉After Breakout possible targets 510/530/560+🎯
👉Add to your watchlist👍

Ethereum experienced a significant decline in priceEthereum is currently trading at $1,571, with an RSI of 41. The 4-hour timeframe Fibonacci retracement levels suggest potential support at $1,544.39 and resistance at $1,677.86. The Bollinger Bands suggest that the upper limit of expected price movements is $1,642.96, while the lower limit is $1,521.24. The middle Bollinger band is currently at $1,582.11, which is near the current market price and may provide support or resistance depending on price movements.
Ethereum experienced a significant decline in price from the $1,665 resistance zone, falling below key support levels at $1,620 and $1,600. This led to a price drop of over 5%, with the price experiencing a sudden spike below $1,550. The analysis suggests that the asset might retest the $1,500 level if the price declines. Furthermore, if the price breaks below this level, it may continue its downward trend, possibly testing the $1,420 level.
The MACD is currently negative, with a reading of -15.25, indicating a bearish trend for the asset. The Stochastic Oscillators provide a reading of D% 45.01 and K% 60, suggesting that the buying and selling pressures are reasonably balanced and that the asset is in a neutral position. Additionally, the volume oscillator shows a negative reading of -23.45%, indicating a decrease in interest in the asset.
In conclusion, Ethereum is in a neutral position, with potential support and resistance levels provided by the Fibonacci retracement levels and Bollinger Bands. The negative MACD reading and decreasing trading volume suggest a bearish trend for the asset, supported by the recent decline in price. Traders should pay close attention to the support and resistance levels provided by the Fibonacci retracement levels and the potential support and resistance provided by the Bollinger Bands. Caution should be exercised in trading decisions, especially considering the decreasing trading volume and negative MACD.

ABFRL AT CIP LEVEL +DEMAND ZONE !!Hello to everyone
The price trading near weekly demand zone . A significant decline has been seen in the price and the price is now trading near the demand zone . so the price can takes rest from the decline and can move upwards from the support zone .
If the price respects the support zone and if any bullish candle or formation is formed then we can build our position to the upside.
#ABFRL
👉Do Or Die level
👉Support seen at 222-220
👉Reversal sign
👉If holds then its can move for 260/280/300
👉Add to your watchlist
Traders, if you liked this idea or if you have your own opinion about it, write in the comments. I will be glad.
