GBP/CAD SHORT MOMENTUM POSITION ON DAILY TIME FRAMEThis is the position based on Edger trading system on daily time frame,
This setup is 1:1 RR, entry has to be done on the candle close, the entry can be refined by your own knowledge.
This is only for educational purpose and no financial advice.
SELL STOP ENTRY : 1.58663 STOP LOSS : 1.62010
TAKE PROFIT 25% : 1.57827
TAKE PROFIT 50% : 1.56990
TAKE PROFIT 75% : 1.56132
TAKE PROFIT 100% : 1.55316
FOLLOW RULES:
1. IF TAKE PROFIT 25% HITS, THEN MOVE THE STOP LOSS AT BREAK EVEN AND CLOSE 25% OF THE POSITION.
2. IF TAKE PROFIT 50% HITS, THEN MOVE THE STOP LOSS AT 25% TP LEVEL AND CLOSE 50% OF THE POSITION.
3. IF TAKE PROFIT 75% HITS, THEN MOVE THE STOP LOSS AT 50% TP LEVEL AND CLOSE 50% OF THE POSITION.
4. IF FULL TAKE PROFIT HITS, THEN CLOSE THE TRADE AND ENJOY.
ALSO, HIT LIKE, SHARE AND FOLLOW FOR MORE IDEAS. YOU CAN ALSO RAISE QUESTIONS ON TRADINGVIEW.
Technicalindicators

USD/CAD LONG MOMENTUM ON DAILY TIME FRAMEThis is the position based on Edger trading system on daily time frame,
This setup is 1:1 RR, entry has to be done on the candle close, the entry can be refined by your own knowledge.
This is only for educational purpose and no financial advice.
ENTRY : 1.29087 STOP LOSS : 1.27137
TAKE PROFIT 25% : 1.29574
TAKE PROFIT 50% : 1.30062
TAKE PROFIT 75% : 1.30549
TAKE PROFIT 100% : 1.31037
FOLLOW RULES:
1. IF TAKE PROFIT 25% HITS, THEN MOVE THE STOP LOSS AT BREAK EVEN AND CLOSE 25% OF THE POSITION.
2. IF TAKE PROFIT 50% HITS, THEN MOVE THE STOP LOSS AT 25% TP LEVEL AND CLOSE 50% OF THE POSITION.
3. IF TAKE PROFIT 75% HITS, THEN MOVE THE STOP LOSS AT 50% TP LEVEL AND CLOSE 50% OF THE POSITION.
4. IF FULL TAKE PROFIT HITS, THEN CLOSE THE TRADE AND ENJOY.
ALSO, HIT LIKE, SHARE AND FOLLOW FOR MORE IDEAS. YOU CAN ALSO RAISE QUESTIONS ON TRADINGVIEW.

Bitcoin against the SPX, overlayed with the NASDAQBitcoin against the SPX, overlayed with the NASDAQ
As shown in the analysis, we can clearly see the correlation of the NASDAQ CURRENCYCOM:US100 / NASDAQ:QQQ to the returns of Bitcoin.
When the QQQ/NASDAQ is in an uptrend, Bitcoin is in an uptrend.
I have purposely valued Bitcoin against the US500/SPX for 2 main reasons:
1) The US500/SPX is the benchmark we all need to beat.
2) The US dollar and other fiat currencies are being printed at an alarming rate and therefore we need a "stable" denominator for our analysis.
Using the BTC/SPX ratio, we can clearly see that bitcoin did not make a higher high in the Oct/Nov period, therefore signalling a slow down in the bullish momentum.
Using the Gaussian channel on the 5 day chart, we can clearly see the when an asset is below the channel, we are in a "Bearish" market and this is typically the best time to dollar cost average into the respective asset class.
We should look to the SPX and the QQQ for signs of a market recovery.

$CYNCyngn Inc., an autonomous vehicle (AV) technology company, develops autonomous driving software. The company is developing Enterprise Autonomy Suite, which consists of DriveMod, a modular industrial vehicle autonomous driving software; Cyngn Insight, a customer-facing tool suite for monitoring and managing AV fleets and aggregating/analyzing data; and Cyngn Evolve, an internal tool suite and infrastructure that facilitates artificial intelligence and machine learning training to enhance algorithms and models, and provides a simulation framework to ensure that data collected in the field can be applied to validating new releases. Cyngn Inc. was incorporated in 2013 and is headquartered in Menlo Park, California.

BITCOIN - There is no sign of strengthBitcoin continues the dump, and there is no sign of strength yet from bulls. It is unable to hold the support of the $34,000 area. We might see more downward movement in the coming days.
The next strong support is the $32,500, and it has major support in the $28,500 - $30,000 area.
Be sure to use a tight stop loss in all of your trades.

USD/JPY LONG MOMENTUM ON DAILY TIME FRAMEThis is the position based on Edger trading system on daily time frame,
This setup is 1:1 RR, entry has to be done on the candle close, the entry can be refined by your own knowledge.
This is only for educational purpose and no financial advice.
BUY STOP ENTRY : 130.858 STOP LOSS : 126.952
TAKE PROFIT 25% : 131.834
TAKE PROFIT 50% : 132.810
TAKE PROFIT 75% : 133.786
TAKE PROFIT 100% : 134.764
FOLLOW RULES:
1. IF TAKE PROFIT 25% HITS, THEN MOVE THE STOP LOSS AT BREAK EVEN AND CLOSE 25% OF THE POSITION.
2. IF TAKE PROFIT 50% HITS, THEN MOVE THE STOP LOSS AT 25% TP LEVEL AND CLOSE 50% OF THE POSITION.
3. IF TAKE PROFIT 75% HITS, THEN MOVE THE STOP LOSS AT 50% TP LEVEL AND CLOSE 50% OF THE POSITION.
4. IF FULL TAKE PROFIT HITS, THEN CLOSE THE TRADE AND ENJOY.
ALSO, HIT LIKE, SHARE AND FOLLOW FOR MORE IDEAS. YOU CAN ALSO RAISE QUESTIONS ON TRADINGVIEW.

$COSMCosmos Holdings Inc. operates as a vertically integrated pharmaceutical company. It offers proprietary line of branded and generic pharmaceuticals, nutraceuticals, over-the-counter (OTC) medications, health care, baby products, medical devices, and other products through its distribution channels and e-commerce market place. The company identifies, acquires, develops, and commercializes products that enhance patients' lives and outcomes, as well as has distribution centers in Greece, and the United Kingdom; and warehousing facility. It serves wholesale pharmaceutical distributors and independent retail pharmacies. The company was formerly known as Prime Estates and Developments, Inc. and changed its name to Cosmos Holdings Inc. in November 2013. Cosmos Holdings Inc. was incorporated in 2009 and is based in Chicago, Illinois.

SMC with price action This is my Technical Analysis using suport & resistance, rsi, fib retrace to add more confluence if its bullish & bearish I will use Fundamental Analysis

Long on GBPAUDGBPAUD BUY @ 1.77718
TP: 1.78824
SL: 1.77238
Today we are looking at going long on GBPAUD with a target of about 100 pips and tight stop loss.

$TWTR consolidating.. to the up side?$TWTR rises after Elon musk bought a 9.2% of Twitter a few days ago and slowly pulls back, and the price consolidate for a few days. despite the 2 day selloff in the market especially in technology stocks, Twitter held up the price between $44-49 and close slightly higher before the market close last Friday.
From a technical perspective, there's a high possibility that twtr could break out next week if it continues to consolidate and if the market decides to bounce after last week's selloff. also, keep in mind that #TWTR earnings are coming up. so play cautiously. in my experience when the company has earnings announcement after market close. the stock usually rises when the stock misses the earning estimate and pulls back after-hours after the announcement. but when the stock has good earnings the stock sells off and rises after the announcement after the market closes. it also sometimes consolidates for the whole day before earning announcement after market close. but this is just my observation of every earnings announcement and I'm sure you notice this kind of movement before.
Below is my strategy for day trading or scalp play for TWTR
TWTR: Day trade or scalp target play: 04/25/22
Buy call above 49.43 sell at 50.70 or above.
Buy puts below 47.70 sell at 46.77 or below.
option open interest: ideal expiration date: 4/29/22 (risky) 5/06/22, 5/20/22, 6/17/22
Hello everyone,
Welcome to this free technical analysis . ( mostly momentum play )
I am going to explain where I think this stock might possibly going the next day or week play and where I would look for trading opportunities
for day trades or scalp play.
If you have any questions or suggestions on which stock I should analyze, please leave a comment below.
If you enjoyed this analysis, I would appreciate it if you smash that LIKE button and maybe consider following my channel.
Thank you for stopping by and stay tune for more.
My technical analysis is not to be regarded as investment advice. but for general informational proposes only.

Tk - Principle of PolarityNYSE:TK
Please correct me if I am wrong. I am just a beginner
What I see:
- 8-4-22 We broke out of a symmetrical triangle.
- The breakout occurred on above average volume.
- The breakout was followed by a small rally, up to the high of 19-1-22, TK then pulled back to a former resistance level near the breakout point, hopefully this former level will become support.
Today (21-4-22) and the following days will tell us if the Principle of Polarity is valid on this chart. What are your expectations for Teekay Corporation?
This is no financial advice.

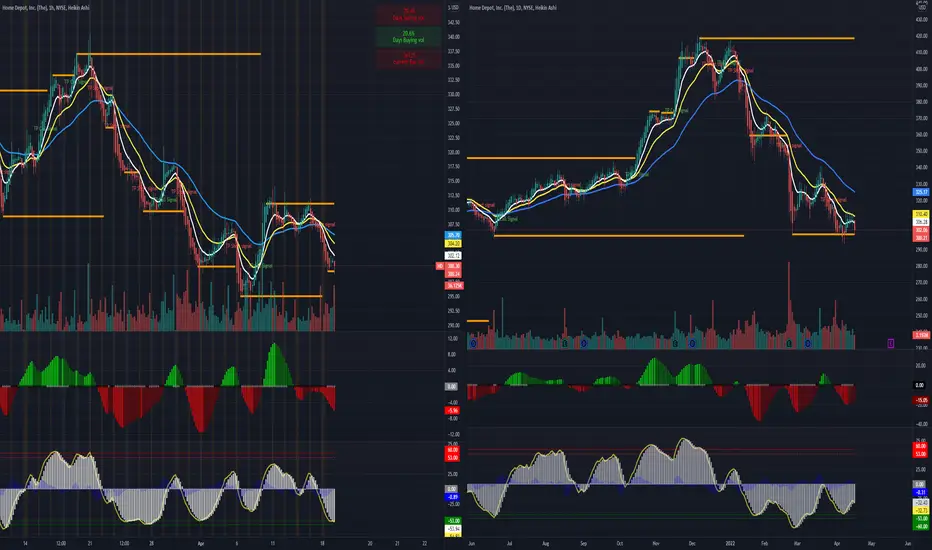
$HD bearish continuation? $HD slowly plunges since the beginning of this year. not much negatives news besides the overall supply chain issues and inflations. but the most reason why it took a dive is the short sellers.
there's been high percentage of short seller since the beginning of this year making $HD to a bearish mode until now. but the percentage of short seller starts to fade about 21% since march. but we still don't know
how many institution finish their shorts positions. In my opinion this is a good buying opportunity for long since its sitting in support line at 299.00 after its long rally.
HD average move per day is $5.00-7.00 per day.
Below is my ideal entry for day trading or scalp play.
HD: Day trade or scalp target play: 04/19/22
Buy call above 303.36 sell at 305.20 or above.
Buy puts below 297.19 sell at 295.17 or below.
option open interest: ideal expiration date: 5/20/22 6/17/22 8/19/22
Hello everyone,
welcome to this free technical analysis . ( mostly momentum play )
I am going to explain where I think this stock is going to go over the next day or week play and where I would look for trading opportunities
for day trades or scalp play.
If you have any questions or suggestions which stock I should analyze, please leave a comment below.
If you enjoyed this analysis, I would definitely appreciate it if you smash that LIKE button and maybe consider following my channel.
Thank you for stopping by and stay tune for more.
My technical analysis is not to be regarded as investment advice. but for general informational proposes onlY
$HYMC Next Target PTs 3.25-3.75 and higherHycroft Mining Holding Corporation, together with its subsidiaries, operates as a gold and silver development company in the United States. The company holds interests in the Hycroft mine covering an area of approximately 70,671 acres located in the state of Nevada. As of December 31, 2021, its Hycroft mine had measured and indicated mineral resources of 9.6 million ounces of gold, and 446.0 million ounces of silver. Hycroft Mining Holding Corporation is headquartered in Winnemucca, Nevada.

AMC trend reversal confirmation we got rejected at 33.89$, we didn't hold our support above the 25$, and bear wear in control, now we want to confirm if we ready to reverse , which will be confirmed the moment we over come our resistant around the 20.90$, and hold 4h candle above it, other wise the bears momentum will continue too drive the price low, till near the 11$ support area, or above the 10 the psychological level .

EUR/CHF SHORT MOMENTUM POSITION ON 4HThis is the position based on Edger trading system on four time frame,
This setup is 1:1 RR, entry has to be done on the candle close, the entry can be refined by your own knowledge.
This is only for educational purpose and no financial advice.
PLACE SELL STOP
ENTRY : 1.01268 STOP LOSS : 1.02058
TAKE PROFIT 25% : 1.01071
TAKE PROFIT 50% : 1.00872
TAKE PROFIT 75% : 1.00676
TAKE PROFIT 100% : 1.00478
FOLLOW RULES:
1. IF TAKE PROFIT 25% HITS, THEN MOVE THE STOP LOSS AT BREAK EVEN AND CLOSE 25% OF THE POSITION.
2. IF TAKE PROFIT 50% HITS, THEN MOVE THE STOP LOSS AT 25% TP LEVEL AND CLOSE 50% OF THE POSITION.
3. IF TAKE PROFIT 75% HITS, THEN MOVE THE STOP LOSS AT 50% TP LEVEL AND CLOSE 50% OF THE POSITION.
4. IF FULL TAKE PROFIT HITS, THEN CLOSE THE TRADE AND ENJOY.
ALSO, HIT LIKE, SHARE AND FOLLOW FOR MORE IDEAS. YOU CAN ALSO RAISE QUESTIONS ON TRADINGVIEW.

NZD/USD SHORT MOMENTUM POSITION ON 4 HOURThis is the position based on Edger trading system on 4 Hour time frame,
This setup is 1:1 RR, entry has to be done on the candle close, the entry can be refined by your own knowledge.
This is only for educational purpose and no financial advice.
PLACE SELL STOP
ENTRY : 0.68267 STOP LOSS : 0.68564
TAKE PROFIT 25% : 0.68193
TAKE PROFIT 50% : 0.68119
TAKE PROFIT 75% : 0.68045
TAKE PROFIT 100% : 0.6797
FOLLOW RULES:
1. IF TAKE PROFIT 25% HITS, THEN MOVE THE STOP LOSS AT BREAK EVEN AND CLOSE 25% OF THE POSITION.
2. IF TAKE PROFIT 50% HITS, THEN MOVE THE STOP LOSS AT 25% TP LEVEL AND CLOSE 50% OF THE POSITION.
3. IF TAKE PROFIT 75% HITS, THEN MOVE THE STOP LOSS AT 50% TP LEVEL AND CLOSE 50% OF THE POSITION.
4. IF FULL TAKE PROFIT HITS, THEN CLOSE THE TRADE AND ENJOY.
ALSO, HIT LIKE, SHARE AND FOLLOW FOR MORE IDEAS. YOU CAN ALSO RAISE QUESTIONS ON TRADINGVIEW.

AEI Squeeze Area the 0.77$ was a perfect support as we did from the last video and hold it last Friday , if we still hold above our support that will make us break the 1$, and test first the 1.30$+, then the 1.61$+.
if we didn't hold the 1.77$, we have other support that will confirm that we still in bullish trend, which is the 1.60$, which is inside our ascending bluish channel.

AMC last support to squeezewe got rejected at 33.80$ where we got shorted by short sellers , now we have a last line of support to confirm the reversal which is above the 17.77$, if we hold we going to see an accumulation phase to test the first resistant around the 20.80$.

GBP/JPY LONG MOMENTUM POSITION ON 4HThis is the position based on Edger trading system on daily time frame,
This setup is 1:1 RR, entry has to be done on the candle close, the entry can be refined by your own knowledge.
This is only for educational purpose and no financial advice.
BUY STOP ENTRY : 160.985
STOP LOSS : 159.443
TAKE PROFIT 25% : 161.37
TAKE PROFIT 50% : 161.756
TAKE PROFIT 75% : 162.141
TAKE PROFIT 100% : 162.527
FOLLOW RULES:
1. IF TAKE PROFIT 25% HITS, THEN MOVE THE STOP LOSS AT BREAK EVEN AND CLOSE 25% OF THE POSITION.
2. IF TAKE PROFIT 50% HITS, THEN MOVE THE STOP LOSS AT 25% TP LEVEL AND CLOSE 50% OF THE POSITION.
3. IF TAKE PROFIT 75% HITS, THEN MOVE THE STOP LOSS AT 50% TP LEVEL AND CLOSE 50% OF THE POSITION.
4. IF FULL TAKE PROFIT HITS, THEN CLOSE THE TRADE AND ENJOY.
ALSO, HIT LIKE, SHARE AND FOLLOW FOR MORE IDEAS. YOU CAN ALSO RAISE QUESTIONS ON TRADINGVIEW.

EUR/SEK SHORT MOMENTUM POSITION ON 4HThis is the position based on Edger trading system on daily time frame,
This setup is 1:1 RR, entry has to be done on the candle close, the entry can be refined by your own knowledge.
This is only for educational purpose and no financial advice.
SELL STOP ENTRY : 10.2635
STOP LOSS : 10.4049
TAKE PROFIT 25% :10.31653
TAKE PROFIT 50% : 10.29885
TAKE PROFIT 75% : 10.28118
TAKE PROFIT 100% : 10.2635
FOLLOW RULES:
1. IF TAKE PROFIT 25% HITS, THEN MOVE THE STOP LOSS AT BREAK EVEN AND CLOSE 25% OF THE POSITION.
2. IF TAKE PROFIT 50% HITS, THEN MOVE THE STOP LOSS AT 25% TP LEVEL AND CLOSE 50% OF THE POSITION.
3. IF TAKE PROFIT 75% HITS, THEN MOVE THE STOP LOSS AT 50% TP LEVEL AND CLOSE 50% OF THE POSITION.
4. IF FULL TAKE PROFIT HITS, THEN CLOSE THE TRADE AND ENJOY.
ALSO, HIT LIKE, SHARE AND FOLLOW FOR MORE IDEAS. YOU CAN ALSO RAISE QUESTIONS ON TRADINGVIEW.

CHF/JPY LONG MOMENTUM POSITION ON 4HThis is the position based on Edger trading system on 4H time frame,
This setup is 1:1 RR, entry has to be done on the candle close, the entry can be refined by your own knowledge.
This is only for educational purpose and no financial advice.
BUY STOP ENTRY : 132.608
STOP LOSS : 131.429
TAKE PROFIT 25% : 132.901
TAKE PROFIT 50% : 133.195
TAKE PROFIT 75% : 133.488
TAKE PROFIT 100% : 133.787
FOLLOW RULES:
1. IF TAKE PROFIT 25% HITS, THEN MOVE THE STOP LOSS AT BREAK EVEN AND CLOSE 25% OF THE POSITION.
2. IF TAKE PROFIT 50% HITS, THEN MOVE THE STOP LOSS AT 25% TP LEVEL AND CLOSE 50% OF THE POSITION.
3. IF TAKE PROFIT 75% HITS, THEN MOVE THE STOP LOSS AT 50% TP LEVEL AND CLOSE 50% OF THE POSITION.
4. IF FULL TAKE PROFIT HITS, THEN CLOSE THE TRADE AND ENJOY.
ALSO, HIT LIKE, SHARE AND FOLLOW FOR MORE IDEAS. YOU CAN ALSO RAISE QUESTIONS ON TRADINGVIEW.

NZD/CAD SHORT MOMENTUM POSITION ON 4HThis is the position based on Edger trading system on daily time frame,
This setup is 1:1 RR, entry has to be done on the candle close, the entry can be refined by your own knowledge.
This is only for educational purpose and no financial advice.
SELL STOP ENTRY : 0.86505
STOP LOSS : 0.87227
TAKE PROFIT 25% : 0.86325
TAKE PROFIT 50% : 0.86145
TAKE PROFIT 75% : 0.85964
TAKE PROFIT 100% : 0.85783
FOLLOW RULES:
1. IF TAKE PROFIT 25% HITS, THEN MOVE THE STOP LOSS AT BREAK EVEN AND CLOSE 25% OF THE POSITION.
2. IF TAKE PROFIT 50% HITS, THEN MOVE THE STOP LOSS AT 25% TP LEVEL AND CLOSE 50% OF THE POSITION.
3. IF TAKE PROFIT 75% HITS, THEN MOVE THE STOP LOSS AT 50% TP LEVEL AND CLOSE 50% OF THE POSITION.
4. IF FULL TAKE PROFIT HITS, THEN CLOSE THE TRADE AND ENJOY.
ALSO, HIT LIKE, SHARE AND FOLLOW FOR MORE IDEAS. YOU CAN ALSO RAISE QUESTIONS ON TRADINGVIEW.

TSLA Bull-run continuation we have one Resistant lift at 1200$, which will be another breakout, and seeing all time high for tsla, but we expect a bit of fighting back from the short around this area , but we need to hold our first support to confirm the strength of our trend , other wise we will go back to the second support .
holding above the 1200$ will confirm the bull-run contention for tsla .
