XRPUSD(4Hr) : XRP moving in a strong bullish momentumMarket in the last 24hrs
The price has been moving in bullish momentum and moved above the upper Bollinger band. Trading volume has been very high in the last 24 hours.
Today’s Trend analysis
The price is expected to continue to move in bullish momentum till the price accepts the upper Bollinger band as a resistance line after which we can expect a consolidated movement with a slight indication of bullish momentum.
Price volatility was moderate at approximately 4.76%, with the day's range between $1.23 — $1.32.
Price at the time of publishing: $1.3
XRP’s market cap: $60.68 Billion
However, the Indicator summary is giving a 'STRONG BUY' signal on XRPUSD.
Out of 11 Oscillator indicators, 0 are giving a SELL signal, 9 are neutral and 2 are giving a BUY signal.
Out of 15 Moving average indicators, 0 are giving SELL signal, 1 is giving neutral and 14 are giving a BUY signal.
Trading volume has been high in the last 24 hours. If we don't see a sudden spike in volume then we can expect the above analysis to hold true.
----------------------------------------------------------------------------------------
The analysis is based on signals from 26 technical indicators, out of which 15 are moving averages and the remaining 11 are oscillators. These indicator values are calculated using 4Hr candles.
----------------------------------------------------------------------------------------
Any feedback and suggestions would help in further improving the analysis!
Technicalindicators

XRPUSD(4Hr) : XRP moving in a strong bullish momentumMarket in the last 24hrs
XRPUSD moved in an upward momentum along with the upper Bollinger band. Trading volume has been very high in the last 24 hours.
Today’s Trend analysis
The price is expected to move in an upward momentum till the price moves above the upper Bollinger band after which a consolidated momentum is expected.
Price volatility was moderate at approximately 4.76%, with the day's range between $1.23 — $1.32.
Price at the time of publishing: $1.3
XRP’s market cap: $60.68 Billion
However, the Indicator summary is giving a 'BUY' signal on XRPUSD.
Out of 11 Oscillator indicators, 3 are giving a SELL signal, 7 are neutral and 1 is giving a BUY signal.
Out of 15 Moving average indicators, 0 are giving SELL signal, 1 is giving neutral and 14 are giving a BUY signal.
Trading volume has been high in the last 24 hours. If we don't see a sudden spike in volume then we can expect the above analysis to hold true.
----------------------------------------------------------------------------------------
The analysis is based on signals from 26 technical indicators, out of which 15 are moving averages and the remaining 11 are oscillators. These indicator values are calculated using 4Hr candles.
----------------------------------------------------------------------------------------
Any feedback and suggestions would help in further improving the analysis!

ETHUSD(1D) : ETH saw boost as the daily trading volume roseMarket in the last 1 week
The price saw a major jump as it moved from the middle Bollinger band to above the upper Bollinger band. Trading volume has been moderate but saw a major jump due to which there was a sudden jump in the price.
Next Week's Trend analysis
The price moved above the upper Bollinger band suggesting a momentum reversal so the price is expected to mode in a consolidated movement with a slight indication of bullish momentum.
The price change was low at approximately 1.95%, with the week's range between $3696 — $3837.
Price at the time of publishing: $3774
ETH’s market cap: $443 Billion
However, the Indicator summary is giving a 'BUY' signal on ETHUSD.
Out of 11 Oscillator indicators, 4 are giving a SELL signal, 5 are neutral and 2 are giving a BUY signal.
Out of 15 Moving average indicators, 0 are giving SELL signal, 1 is giving neutral and 14 are giving a BUY signal.
Traded volume has remained high in the past week. If we don't see a sudden spike in volume then we can expect the above analysis to hold true.
----------------------------------------------------------------------------------------
The analysis is based on signals from 26 technical indicators, out of which 15 are moving averages and the remaining 11 are oscillators. These indicator values are calculated using 1 Day candles.
----------------------------------------------------------------------------------------
Any feedback and suggestions would help in further improving the analysis!

DOGEUSD(4Hr) : Doge to move sideways after seeing a jumpMarket in the last 24hrs
The price moved above the middle Bollinger band and can be seen oscillating between the middle and the upper Bollinger band. Trading volume has been very high in the last 24 hours and the volume can be seen decreasing with an increase in prices suggesting a trend reversal suggesting a sideways momentum.
Today’s Trend analysis
The price is expected to continue to move sideways between the middle and the upper Bollinger band. The price volatility is expected to be low as the Bollinger band can be seen converging.
Price volatility was low at approximately 2.57%, with the day's range between $0.274 — $0.286.
Price at the time of publishing: $0.281
DOGE’s market cap: $36.88 Billion
However, the Indicator summary is giving a 'BUY' signal on DOGEUSD.
Out of 11 Oscillator indicators, 1 is giving a SELL signal, 9 are neutral and 1 is giving a BUY signal.
Out of 15 Moving average indicators, 4 are giving SELL signal, 1 is giving neutral and 10 are giving a BUY signal.
Trading volume has been very high in the last 24 hours. If we don't see a sudden spike in volume then we can expect the above analysis to hold true.
----------------------------------------------------------------------------------------
The analysis is based on signals from 26 technical indicators, out of which 15 are moving averages and the remaining 11 are oscillators. These indicator values are calculated using 4Hr candles.
----------------------------------------------------------------------------------------
Any feedback and suggestions would help in further improving the analysis!

Supply and Demand Zones - An Approach to Identifying Key LevelsIn this video I will break down my process in identifying supply and demand zones through technical analysis.
Being able to identify these key areas allows for the trader to recognize potential levels of resistance and/or support.
I also go over a few other technical analysis approaches I use when looking to identify similar key levels on a chart. From my experience, it works best for me to stick with the first technical approach that I am able to identify when looking at a particular symbol's chart. The more you look at a chart the more you will find an opportunity to squeeze in another form of technical analysis, often leading to clutter and uncertainty.

XRPUSD(4Hr) : XRP saw a big jumpMarket in the last 24hrs
The price moved from the bottom bollinger band and to above the upper Bollinger band as the volume saw a major increase. The trading volume has been high and saw a sudden increase in the last 24 hours.
Today’s Trend analysis
The price is expected to continue to move in upward momentum and oscillate between the upper and middle Bollinger band as support and resistance lines.
Price volatility was high at approximately 7.3%, with the day's range between $1.09 — $1.24.
Price at the time of publishing: $1.19
XRP’s market cap: $55.26 Billion
However, the Indicator summary is giving a 'STRONG BUY' signal on XRPUSD.
Out of 11 Oscillator indicators, 1 is giving a SELL signal, 7 are neutral and 3 are giving a BUY signal.
Out of 15 Moving average indicators, 0 are giving SELL signal, 1 is giving neutral and 14 are giving a BUY signal.
Trading volume has been high in the last 24 hours. If we don't see a sudden spike in volume then we can expect the above analysis to hold true.
----------------------------------------------------------------------------------------
The analysis is based on signals from 26 technical indicators, out of which 15 are moving averages and the remaining 11 are oscillators. These indicator values are calculated using 4Hr candles.
----------------------------------------------------------------------------------------
Any feedback and suggestions would help in further improving the analysis!

DOGEUSD(4Hr) : Doge in a sideways momentumMarket in the last 24hrs
The price can be seen moving along the middle Bollinger band in the last 24 hours. Trading volume has been very high in the last 24 hours
Today’s Trend analysis
The price is expected to continue to move sideways along the middle Bollinger band and is expected to continue to move in a similar momentum until there is a sudden change in the volume or any other fundamental factor.
Price volatility was low at approximately 0.34%, with the day's range between $0.278 — $0.29.
Price at the time of publishing: $0.281
DOGE’s market cap: $38 Billion
However, the Indicator summary is giving a 'SELL' signal on DOGEUSD.
Out of 11 Oscillator indicators, 1 is giving a SELL signal, 9 are neutral and 1 is giving a BUY signal.
Out of 15 Moving average indicators, 12 are giving SELL signal, 1 is giving neutral and 2 are giving a BUY signal.
Trading volume has been very high in the last 24 hours. If we don't see a sudden spike in volume then we can expect the above analysis to hold true.
----------------------------------------------------------------------------------------
The analysis is based on signals from 26 technical indicators, out of which 15 are moving averages and the remaining 11 are oscillators. These indicator values are calculated using 4Hr candles.
----------------------------------------------------------------------------------------
Any feedback and suggestions would help in further improving the analysis!

DOGEUSD(4Hr) : DOGE saw some upward momentumMarket in the last 24hrs
DOGEUSD saw a rise with price moving above the midline and reaching the upper Bollinger band. Trading volume has been high in the last 24 hours.
Today’s Trend analysis
As the Bollinger band is converging, the price volatility is expected to be low. Thus the price is expected to oscillate between the upper and lower Bollinger band while moving sideways with a slight indication of bullish momentum.
Price volatility was high at approximately 6.31%, with the day's range between $0.272 — $0.3.
Price at the time of publishing: $0.29
DOGE’s market cap: $37.99 Billion
However, the Indicator summary is giving a 'NEUTRAL' signal on DOGEUSD.
Out of 11 Oscillator indicators, 1 is giving a SELL signal, 8 are neutral and 2 are giving a BUY signal.
Out of 15 Moving average indicators, 7 are giving SELL signal, 1 is giving neutral and 7 are giving a BUY signal.
Trading volume has been very high in the last 24 hours. If we don't see a sudden spike in volume then we can expect the above analysis to hold true.
----------------------------------------------------------------------------------------
The analysis is based on signals from 26 technical indicators, out of which 15 are moving averages and the remaining 11 are oscillators. These indicator values are calculated using 4Hr candles.
----------------------------------------------------------------------------------------
Any feedback and suggestions would help in further improving the analysis!

The Boeing (BA) Company to 300?Boeing $BA about to kiss trendline support that originated in March lows. 1 year 5 month old trend. March lows may have been the ultimate support. I believe based on this trendline data that it will bounce on the trendline and ROCKET to $240. I do believe it is strong enough to reach $280 for a real test. If it breaks through, final target is $320.
Fundamentally, I believe COVID is being figured out with our expert scientists who develop these vaccines.
My targets is ultimately $320 posing over a 44% return (this is not financial advice). At 280 it is still 26%+. Other shorter targets 240 250 260.
THIS IS A CASE STUDY FOR EDUCATIONAL PURPOSES ONLY. THIS IS NOT FINANCIAL ADVICE. THIS IS BASED ON MY OWN EXPERIENCE AND FROM PAST CASE STUDIES. THIS IS NOT FINANCIAL ADVICE.

XRPUSD(4Hr) : XRP seeing a major downtrendMarket in the last 24hrs
The price saw a major downtrend in the last 24 hours with the price continuously rejecting the bottom Bollinger band as a support line. Trading volume has been high in the last 24 hours and can be seen increasing with a decrease in price suggesting a strong bearish momentum.
Today’s Trend analysis
The price is expected to continue to move in a bearish momentum until the price accepts the bottom Bollinger bands as a support line after which a consolidated movement is expected.
Price volatility was high at approximately 6.98%, with the day's range between $1.07 — $1.19.
Price at the time of publishing: $1.09
XRP’s market cap: $50.58 Billion
However, the Indicator summary is giving a 'SELL' signal on XRPUSD.
Out of 11 Oscillator indicators, 2 are giving a SELL signal, 7 are neutral and 2 are giving a BUY signal.
Out of 15 Moving average indicators, 11 are giving SELL signal, 1 is giving neutral and 3 are giving a BUY signal.
Trading volume has been high in the last 24 hours. If we don't see a sudden spike in volume then we can expect the above analysis to hold true.
----------------------------------------------------------------------------------------
The analysis is based on signals from 26 technical indicators, out of which 15 are moving averages and the remaining 11 are oscillators. These indicator values are calculated using 4Hr candles.
----------------------------------------------------------------------------------------
Any feedback and suggestions would help in further improving the analysis!

DOGEUSD(4Hr) : DOGE moving sideways with low volatilityMarket in the last 24hrs
The price moved sideways in the last 24 hours as the price accepted the lower Bollinger band as a support line. Trading volume has been very high in the last 24 hours.
Today’s Trend analysis
The price is expected to continue to move sideways and continue to oscillate between the middle and the lower Bollinger band. The price volatility to be low as the Bollinger bands can be seen converging.
Price volatility was low at approximately 1.25%, with the day's range between $0.28 — $0.3.
Price at the time of publishing: $0.293
DOGE’s market cap: $38.45 Billion
However, the Indicator summary is giving a 'SELL' signal on DOGEUSD.
Out of 11 Oscillator indicators, 1 is giving a SELL signal, 9 are neutral and 1 is giving a BUY signal.
Out of 15 Moving average indicators, 10 are giving SELL signal, 1 is giving neutral and 4 are giving a BUY signal.
Trading volume has been very high in the last 24 hours. If we don't see a sudden spike in volume then we can expect the above analysis to hold true.
----------------------------------------------------------------------------------------
The analysis is based on signals from 26 technical indicators, out of which 15 are moving averages and the remaining 11 are oscillators. These indicator values are calculated using 4Hr candles.
----------------------------------------------------------------------------------------
Any feedback and suggestions would help in further improving the analysis!

EURJPY short trade ideaLooking for a quick intra day trade and possible further continuation swing low... I prefer obviously the continuation moves as there's a lot more potential for profit and you are trading with the trend...

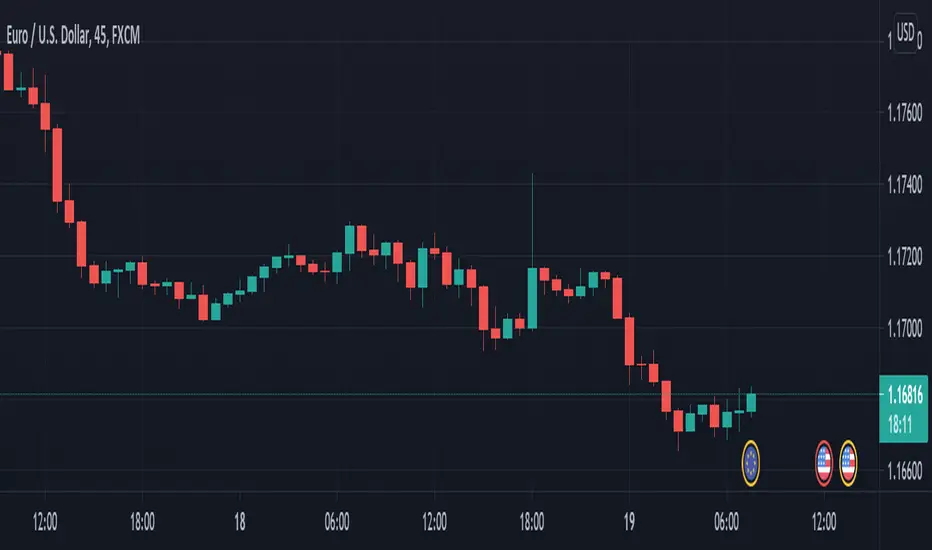
Create Alerts And Wait PatientlyCreate Alerts And Wait Patiently
There are two key steps to creating alerts:
1. Find Important Price Levels
Do your research. Find a price level that looks important and wait. Patience is everything. You have all of the tools available to you to research and follow markets. Whether it's a simple trend line , moving average or a custom Pine Script, use the tools to make better decisions.
2. Create The Alert
Once you've found a level that interests you, create an alert and walk away. Right-click on that exact price level and then select "Create Alert" from the menu. You can also use the keyboard shortcut Alt + A or on a Mac option + A. Lastly, at the top of every chart is an alarm clock icon ⏰. Click that to open your alert menu and get started.
The chart in this example shows a level we're watching. It also shows the alert we created. We have our eyes on a possible Double Bottom and we made an alert to watch that level. We'll get notifications on our TradingView mobile app, through email, and on our desktop. We won't miss it. 😁
Alerts can help you plan ahead and wait. We all know patience is important. So use alerts to express that patience.
Thanks for reading and we look forward to hearing your feedback in the comments below!

ATOM Price PredictionAtom( Cosmos ) is a blockchain project that was built to address some of the challenges facing the cryptocurrency industry. Among these challenges are scalability and increasing the speed of throughput.
The Cosmos price is scorching hot today as demand for the coin rises. The ATOM price jumped to the highest level since May even as other cryptocurrencies paused. Its price is about 142% above the lowest level in July this year. It has a market capitalization of more than $4.34 billion and is the 32nd biggest coin in the world.
Is ATOM a good investment? Using technical analysis, we can decipher the chart pattern to predict how the Cosmos price will move in the near term.
Now, turning to the daily chart, we see that the Cosmos price has staged a strong recovery in the past few days. This rally happened after the coin found strong support at the $8.9 level. It struggled to move below the support several times in the past three months.
The Cosmos price has managed to move above the 25-day and 50-day weighted moving averages. Also, it has risen above the resistance at $14.7, which was the neckline of the double-bottom pattern.
Therefore, the ATOM price will likely maintain the bullish trend as bulls target the all-time high of $32. Still, I can’t rule out a break and retest situation where the coin retests the support at $14.7 and then resumes the bullish trend.

USDCAD above support + supported by trendline, price to growUSDCAD
The price is above support structure , and price is supported by Asc. trendline, if price continues to hold above the support I expect the price to move higher towards the next resistance..
Push LIKE & SUPPORT the Idea...
*The content on this analysis is subject to change at any time without notice, and is provided for the sole purpose of assisting traders to make independent investment decisions

Improve Forex TradingWhen I was learning how to trade and when I was watching and reading different trading educators, these words naturally pissed me off. What the hell are you talking about? What confirmation?
It was a full-blown mystery...🤯
Then, once I started to mature in trading and trade full-time, I became an author on TradingView.
Posting my forecasts and trading setups, I frequently mentioned the confirmation.
And now the newbies that are reading me and learning from me are pissed off...🤬
That is so funny I guess.
But the truth is that the confirmation must become a fundamental part of your trading strategy. It is your key to successful trading.
What exactly is the confirmation?
It depends on many many different things, in this article I will discuss with you the 4 main types of confirmation and give you detailed examples.
1️⃣ - PRICE ACTION CONFIRMATION
That is actually what I prefer.
Analyzing different markets and searching for decent trading opportunities often times we find some peculiar instruments to watch.
Identifying the market trend and key levels we find the potential spots to trade from.
But do we just open the trade once the "ZONE" is spotted?
I wish it could be that simple...
Trading just the zone, without additional clues brings very negative figures. We definitely need something else.
Price action & candlestick patterns can be those clues.
Accurate reflection of the current local market sentiment makes the patterns a very reliable confirmation.
Dodji's, pin bars, double tops/bottoms ...
Proven by history, the skill of identification & reading the patterns will pay off quickly.
Being in some sense the language of the market, the patterns are the fundamental part of my trading strategy.
2️⃣ - FIBONACCI LEVELS
Fibonacci levels are a very popular technical tool. Being applied properly it helps the trader to confirm or, alternatively, disqualify the identified "ZONE".
With multiple different methods like confluence trading, fibs are applied in hedge funds and various banking institutions.
The main problem with the fibs, however, is complexity and a high degree of subjectivity. Meeting different traders and watching different posts on TradingView I noticed that all traders tend to have their own vision. There is no universal system to apply here, a proper fib.confirmation technique can be built only with long-lasting backtesting and practicing.
3️⃣ - FUNDAMENTAL NEWS
The figures in the economic calendar, news, tweets. Actual fundamental news can become your best confirmation tool.
However, the main obstacle right here is the promptness, validity and reliability of the data that you get.
The information shouldn't be delayed and it must be objectively true.
The search for such a source is by itself is a very time-consuming and labor-intensive business not even mentioning its potential costs.
And that is not all. Knowing how to make sense of that data, its proper perception, and understanding requires a solid economical and financial background and experience.
At the end of the day, becoming an expert in fundamental analysis , the trader can easily sort the trading zones and trade only the ones that are confirmed by a decent fundamental trigger.
4️⃣ - TECHNICAL INDICATORS
I believe all the traders apply some indicators. From a simple moving average to some complex composite algorithms, indicators play a very important role in trading.
Being 100% objective and providing up-to-date real numbers and figures, they are our allies in a battle against subjectivity.
For many traders, the various signals from indicators are considered to be accurate and reliable confirmations.
Many algotrading solutions are operating simply relying on such signals and being able to bring consistent profits proves the power of technical indicators.
What confirmation type should you rely on?🧐
I guess the main rule right here is that the confirmation must MAKE SENSE to you. You should feel the logic behind that. It must make you confident in your action, even in case of the occasional losses, it must keep you calm and humble.
Let me know in a comment section what confirmation do you prefer!
DOGEUSD(4Hr) : DOGE expected to see some volatilityMarket in the last 24hrs
The price oscillated between the middle and the bottom Bollinger band in the last 24 hours. Trading volume has been very high in the last 24 hours.
Today’s Trend analysis
The price breaking below could be an indication of a bearish momentum while oscillating between the middle and the bottom Bollinger band. There is a chance that this might be a false breakout and we can expect the price to move above the trend line and continue to move in bullish momentum.
Price volatility was low at approximately 1%, with the day's range between $0.282 — $0.324.
Price at the time of publishing: $0.319
DOGE’s market cap: $41.98 Billion
However, the Indicator summary is giving a 'BUY' signal on DOGEUSD.
Out of 11 Oscillator indicators, 2 are giving a SELL signal, 9 are neutral and 0 are giving a BUY signal.
Out of 15 Moving average indicators, 0 are giving SELL signal, 1 is giving neutral and 14 are giving a BUY signal.
Trading volume has been very high in the last 24 hours. If we don't see a sudden spike in volume then we can expect the above analysis to hold true.
----------------------------------------------------------------------------------------
The analysis is based on signals from 26 technical indicators, out of which 15 are moving averages and the remaining 11 are oscillators. These indicator values are calculated using 4Hr candles.
----------------------------------------------------------------------------------------
Any feedback and suggestions would help in further improving the analysis!

ADAUSD(4Hr): Cardano to now move sideways after an uptrendMarket in the last 24hrs
ADAUSD moved sideways from the middle to the bottom Bollinger band in the last 24 hours. Trading volume has been high in the last 24 hours.
Today’s Trend analysis
The price is expected to move between the bottom and the middle Bollinger band while moving in a slight bearish momentum.
Price volatility was low at approximately 3.63%, with the day's range between $2.03 — $2.14.
Price at the time of publishing: $2.06
ADA’s market cap: $66.29 Billion
However, the Indicator summary is giving a 'BUY' signal on DOGEUSD.
Out of 11 Oscillator indicators, 2 are giving a SELL signal, 6 are neutral and 3 are giving a BUY signal.
Out of 15 Moving average indicators, 6 are giving SELL signal, 1 is giving neutral and 8 are giving a BUY signal.
Trading volume has been high in the last 24 hours. If we don't see a sudden spike in volume then we can expect the above analysis to hold true.
----------------------------------------------------------------------------------------
The analysis is based on signals from 26 technical indicators, out of which 15 are moving averages and the remaining 11 are oscillators. These indicator values are calculated using 4Hr candles.
----------------------------------------------------------------------------------------
Any feedback and suggestions would help in further improving the analysis!

AUDUSD broke below strong support, price to fall hard...AUDUSD
The price broke below strong support structure, after a pullback/correction if rejects from the resistance area , I expect the price to move lower..
Push LIKE & SUPPORT the Idea...
*The content on this analysis is subject to change at any time without notice, and is provided for the sole purpose of assisting traders to make independent investment decisions.

Bitcoin – Analysis of 08-17-2021The Algotrading Multiday system is: long since the close of 7/25/2021
position performance: 31.37%
YTD performance: 251.77%
1 year performance: 560.19%
At the end of the day: maintain position
Number of transactions closed the last year 23
Average profit / loss per trade last year 24.36%
Percentage of profitable trades last year 52.17%
Percentage of unprofitable trades last year 47.83%
Graphic Analysis
Yesterday, the prices tested the resistance at $ 47,500, therefore there is no sign of a slowdown in the uptrend.
Support levels:
1 ° 45900
2 ° 43600
Resistance levels:
1 ° 47500
2 ° 51600
Information provided is only educational and should not be used to take action in the market!
MarkRoboTS_Algo_Trading is new for the English trading ideas section, but it has been active for 4 years in the Italian section.
Check it out there if you are interested in the historical data.

XRP(4Hr) : XRP to see some consolidation after moving above 1$Market in the last 24hrs
The price moved below the middle Bollinger band and can be seen touching the bottom Bollinger band. Trading volume has been very high in the last 24 hours.
Today’s Trend analysis
The price is expected to move in a consolidated momentum and oscillate between the bottom and the upper Bollinger band. The price volatility is expected to be low as the Bollinger band can be seen converging.
Price volatility was low at approximately 8.78%, with the day's range between $1.14 — $1.3.
Price at the time of publishing: $1.18
XRP’s market cap: $54.78 Billion
However, the Indicator summary is giving a 'NEYTRAL' signal on XRPUSD.
Out of 11 Oscillator indicators, 2 are giving a SELL signal, 8 are neutral and 1 is giving a BUY signal.
Out of 15 Moving average indicators, 5 are giving SELL signal, 1 is giving neutral and 9 are giving a BUY signal.
Trading volume has been high in the last 24 hours. If we don't see a sudden spike in volume then we can expect the above analysis to hold true.
----------------------------------------------------------------------------------------
The analysis is based on signals from 26 technical indicators, out of which 15 are moving averages and the remaining 11 are oscillators. These indicator values are calculated using 4Hr candles.
----------------------------------------------------------------------------------------
Any feedback and suggestions would help in further improving the analysis!

Total crypto market (CRYPTOCAP:TOTAL) compare to BTC/USD -1DAssumptions – Fib retracement
From 1.98T total market cap to 1.864T total market cap is 116 mld USD. Assuming this correction would be only on Bitcoin - it gives us 7.65% correction of BTC price (why only at BTC? Because this same moment BTC domination will go higher and pump out assets from altcoins).
Currently price of BTC 46 500 $ - 7.65% of correction is approximately stop at 42 950 $ - close to FIB 0.382 at BTC/USD chart. I assume a fast rebound from this level to get above 200 moving average – next move close to drawed path.
Healthly consolidation above 40-43k BTC/USD – very important test 0.5 fibonacci retracement – best 0.618 at 51k

DOGEUSD(4Hr) : DOGE showing great bullish momentumMarket in the last 24hrs
The price moved back above the trend line and moved above the upper Bollinger band. Trading volume has been very high in the last 24 hours.
Today’s Trend analysis
The price is expected to continue to move above the trend line in bullish momentum while oscillating between the middle and the upper Bollinger band.
Price volatility was high at approximately 11.34%, with the day's range between $0.3 — $0.351.
Price at the time of publishing: $0.336
DOGE’s market cap: $43.94 Billion
However, the Indicator summary is giving a 'BUY' signal on DOGEUSD.
Out of 11 Oscillator indicators, 2 are giving a SELL signal, 8 are neutral and 1 is giving a BUY signal.
Out of 15 Moving average indicators, 1 is giving SELL signal, 1 is giving neutral and 13 are giving a BUY signal.
Trading volume has been very high in the last 24 hours. If we don't see a sudden spike in volume then we can expect the above analysis to hold true.
----------------------------------------------------------------------------------------
The analysis is based on signals from 26 technical indicators, out of which 15 are moving averages and the remaining 11 are oscillators. These indicator values are calculated using 4Hr candles.
----------------------------------------------------------------------------------------
Any feedback and suggestions would help in further improving the analysis!
