DOGEUSD(4Hr) : DOGE is fallingMarket in the last 24hrs
DOGEUSD saw consolidated movement with a slight indication of bearish momentum in the last 24 hours. Trading volume has been very low in the last 24 hours.
Today’s Trend analysis
Price has reached the lower Bollinger band which usually acts as a strong support line. The likely situation is that it accepts the bottom band as a support line and we might see some consolidation with bullish indication.
Price volatility was high at approximately 4.51%, with the day's range between $0.21 — $0.219.
Price at the time of publishing: $0.207
DOGE’s market cap: $27.07 Billion
However, the Indicator summary is giving a 'SELL' signal on DOGEUSD.
Out of 11 Oscillator indicators, 1 is giving a SELL signal, 9 are neutral and 1 is giving a BUY signal.
Out of 15 Moving average indicators, 11 are giving SELL signal, 1 is giving neutral and 3 are giving a BUY signal.
Trading volume has been low in the last 24 hours. If we don't see a sudden spike in volume then we can expect the above analysis to hold true.
----------------------------------------------------------------------------------------
The analysis is based on signals from 26 technical indicators, out of which 15 are moving averages and the remaining 11 are oscillators. These indicator values are calculated using 4Hr candles.
----------------------------------------------------------------------------------------
Any feedback and suggestions would help in further improving the analysis!
Technicalindicators

Bitcoin BTC BTC is fighting strong selling pressure. I expect a pullback from here. Good probability something like this plays out

XRP(4Hr) : XRP saw a jump in priceMarket in the last 24hrs
XRPUSD saw a major bullish trend in the last 24 hours with the price moving above the upper Bollinger band. Trading volume has been high in the last 24 hours and can be seen increasing with an increase in prices suggesting a bullish trend in the future.
Today’s Trend analysis
XRPUSD expected to see a slight decline in price as the latest candle suggests that the price has expected the upper Bollinger band as a support line. The price can be expected to reach the middle band and then follow a consolidated movement from there.
Price volatility was high at approximately 3.48%, with the day's range between $0.624— $0.657.
Price at the time of publishing: $0.648
XRP’s market cap: $29.9 Billion
However, the Indicator summary is giving a 'BUY' signal on XRPUSD.
Out of 11 Oscillator indicators, 0 are giving a SELL signal, 8 are neutral and 3 are giving a BUY signal.
Out of 15 Moving average indicators, 3 are giving SELL signal, 1 is giving neutral and 11 is giving a BUY signal.
Trading volume has been high in the last 24 hours and can be seen increasing with an increase in prices suggesting a bullish trend in the future. If we don't see a sudden spike in volume then we can expect the above analysis to hold true.
----------------------------------------------------------------------------------------
The analysis is based on signals from 26 technical indicators, out of which 15 are moving averages and the remaining 11 are oscillators. These indicator values are calculated using 4Hr candles.
----------------------------------------------------------------------------------------
Any feedback and suggestions would help in further improving the analysis!

Bitcoin 3 Week Chart Of DeathIf you were a long-term investor or "Whale" looking to find a nice entry point, would this be it? Would this chart absolutely convince you this is the right time to invest? Is it pump time to new All-Time Highs? Are we even near the bottom?
There have only been 3 times the RSI has broken underneath 20 on the RSI and each time it has signaled a Bear Market.
The MACD has also crossed to the downside which every time previously has followed it with a significant drop thereafter.
The volume is incredibly low.
Listen, im not here to scream BEAR MARKET at everyone because I know a vast majority disconnect as soon as they read it. Im not here to say there won't be a pump. In reality, nobody knows. I am simply pointing out the interesting developments on the 3 Week Time Frame. You can choose to see it however you want to see it, that is up to you! Good luck everyone for the weeks ahead, BE SMART!

Bitcoin BTC Bullish or Bearish?As we can see BTC has formed a pretty clear downtrend channel. I have previously pointed out potential Bear flags, so I will point out the potential Bull Flag. Depending on how you look at it, this could potentially be a Bull Flag forming.
In normal conditions, Bull and Bear flags have about a 60% completion rate. In this scenario, we are looking at a number of bearish patterns which will probably affect its success rate further. It is fighting huge selling pressure.
That being said, if this breaks to the upside, BTC could see a strong move. Volume would have to spontaneously spring to support this. It is not impossible but it is hypothetical and it's important to understand that.

DOGEUSD(4Hr) : DOGE looking to fallMarket in the last 24hrs
DOGEUSD saw a consolidated bearish movement as the price can be seen moving along below the middle Bollinger band and constantly accepting it as a resistance line. Trading volume has been very high in the last 24 hours.
Today’s Trend analysis
DOGEUSD is expected to continue this bearish trend till it reaches the Bottom Bollinger band. If the price accepts the bottom band as a support line then we can expect some consolidation from the price else if the price rejects it as a support line then the bearish trend will continue.
Price volatility was low at approximately 2.77%, with the day's range between $0.211 — $0.228.
Price at the time of publishing: $0.213
DOGE’s market cap: $27.7 Billion
However, the Indicator summary is giving a 'SELL' signal on DOGEUSD.
Out of 11 Oscillator indicators, 1 is giving a SELL signal, 8 are neutral and 2 are giving a BUY signal.
Out of 15 Moving average indicators, 13 are giving SELL signal, 1 is giving neutral and 1 is giving a BUY signal.
Trading volume has been high in the last 24 hours. If we don't see a sudden spike in volume then we can expect the above analysis to hold true.
----------------------------------------------------------------------------------------
The analysis is based on signals from 26 technical indicators, out of which 15 are moving averages and the remaining 11 are oscillators. These indicator values are calculated using 4Hr candles.
----------------------------------------------------------------------------------------
Any feedback and suggestions would help in further improving the analysis!

XRPUSD(4Hr) : XRP moving with low volatilityMarket in the last 24hrs
XRPUSD saw a consolidated momentum with price accepting the middle Bollinger band as a resistance line. The trading volume had been low and can be seen decreasing in the last 24 hours.
Today’s Trend analysis
XRP is expected to see a consolidated movement with a bearish indication. This movement is expected to be continued till the price reaches the Bottom Bollinger band. If the price accepts the bottom band as a support line then the price is expected to move in a bullish manner else the continuation of the bearish momentum is expected.
Price volatility was moderate at approximately 0.92%, with the day's range between $0.606— $0.648.
Price at the time of publishing: $0.627
XRP’s market cap: $28.9 Billion
However, the Indicator summary is giving a 'SELL' signal on XRPUSD.
Out of 11 Oscillator indicators, 2 are giving a SELL signal, 8 are neutral and 1 is giving a BUY signal.
Out of 15 Moving average indicators, 13 are giving SELL signal, 1 is giving neutral and 1 is giving a BUY signal.
The trading volume had been low and can be seen decreasing in the last 24 hours. If we don't see a sudden spike in volume then we can expect the above analysis to hold true.
----------------------------------------------------------------------------------------
The analysis is based on signals from 26 technical indicators, out of which 15 are moving averages and the remaining 11 are oscillators. These indicator values are calculated using 4Hr candles.
----------------------------------------------------------------------------------------
Any feedback and suggestions would help in further improving the analysis!

DOGEUSD(4Hr) : DOGE moving with the BullsMarket in the last 24hrs
DOGEUSD saw an overall bullish trend. We saw the price accepting the lower Bollinger band as a support line which resulted in the said bullish momentum. Trading volume has been high in the last 24 hours.
Today’s Trend analysis
The price has reached the middle Bollinger band which usually acts as a good resistance line. The likely scenario is that the price accepts the middle band as a resistance line and the price will move back to its bearish momentum. If the price doesn't do that then we can expect it to move till it reaches the upper Bollinger band.
Price volatility was high at approximately 3.08%, with the day's range between $0.197 — $0.229.
Price at the time of publishing: $0.221
DOGE’s market cap: $28.83 Billion
However, the Indicator summary is giving a 'SELL' signal on DOGEUSD.
Out of 11 Oscillator indicators, 1 is giving a SELL signal, 8 are neutral and 2 are giving a BUY signal.
Out of 15 Moving average indicators, 11 are giving SELL signal, 1 is giving neutral and 3 are giving a BUY signal.
Trading volume has been high in the last 24 hours. If we don't see a sudden spike in volume then we can expect the above analysis to hold true.
----------------------------------------------------------------------------------------
The analysis is based on signals from 26 technical indicators, out of which 15 are moving averages and the remaining 11 are oscillators. These indicator values are calculated using 4Hr candles.
----------------------------------------------------------------------------------------
Any feedback and suggestions would help in further improving the analysis!

Bitcoin BTC This seems like a very likely scenario on the 30-minute chart. Let's see how it plays out!

XRPUSD(4Hr) : XRP to favor bullsMarket in the last 24hrs
XRPUSD saw a bearish trend in the last 24 hours and can be seen moving in upward momentum. Trading volume has been high in the last 24 hours.
Today’s Trend analysis
The current upward movement of XRPUSD suggests that the price has accepted the lower Bollinger band as a support line, so we can expect the price to reach the middle Bollinger band and then have a consolidated movement after that.
Price volatility was moderate at approximately 6.42%, with the day's range between $0.613— $0.67.
Price at the time of publishing: $0.627
XRP’s market cap: $28.7 Billion
However, the Indicator summary is giving a 'SELL' signal on XRPUSD.
Out of 11 Oscillator indicators, 2 are giving a SELL signal, 8 are neutral and 1 is giving a BUY signal.
Out of 15 Moving average indicators, 13 are giving SELL signal, 1 is giving neutral and 1 is giving a BUY signal.
Traded volume remained high in the past 24 hours. If we don't see a sudden spike in volume then we can expect the above analysis to hold true.
----------------------------------------------------------------------------------------
The analysis is based on signals from 26 technical indicators, out of which 15 are moving averages and the remaining 11 are oscillators. These indicator values are calculated using 4Hr candles.
----------------------------------------------------------------------------------------
Any feedback and suggestions would help in further improving the analysis!

DOGEUSD(4Hr) : DOGE favoring bearish momentumMarket in the last 24hrs
In the past 24 hours, DOGEUSD has been moving in a bearish momentum and has been constantly rejecting the lower Bollinger band. Trading volume has been high in the last 24 hours. The increased volume can be seen decreasing lately with a decrease in price which could indicate a possible trend reversal soon.
Today’s Trend analysis
DOGEUSD is expected to continue this bearish momentum until the price accepts the lower Bollinger band as a support line. Then we can expect some consolidated movement with a slight indication of a bullish trend.
Price volatility was high at approximately 9.57%, with the day's range between $0.208 — $0.232.
Price at the time of publishing: $0.21
DOGE’s market cap: $27.4 Billion
However, the Indicator summary is giving a 'SELL' signal on DOGEUSD.
Out of 11 Oscillator indicators, 2 are giving a SELL signal, 6 are neutral and 3 are giving a BUY signal.
Out of 15 Moving average indicators, 13 are giving SELL signal, 1 is giving neutral and 1 is giving a BUY signal.
Trading volume has been high in the last 24 hours. The increased volume can be seen decreasing lately with a decrease in price which could indicate a possible trend reversal soon. If we don't see a sudden spike in volume then we can expect the above analysis to hold true.
----------------------------------------------------------------------------------------
The analysis is based on signals from 26 technical indicators, out of which 15 are moving averages and the remaining 11 are oscillators. These indicator values are calculated using 4Hr candles.
----------------------------------------------------------------------------------------
Any feedback and suggestions would help in further improving the analysis!

Bitcoin BTC Perspective is such a strange thing. You can live your entire life seeing things and believing in things in a certain way and in one day all of that can change. We are constantly modifying, adapting, and growing which is what makes our potential so complex and special.
What we see with our eyes may not be what's really in front of us. Our eyes fool us on a daily basis and most of all, our minds. Life is a psychological burden that must be constantly fought and persevered against.
Keep your mind clear, strong, and open to all things. Live your life full of mindfulness and live a much more understanding, happy, and peaceful one.
May happiness touch every one of you!

ETHUSD(4Hr) : ETH moving in a overall Bullish trendMarket in the last 24hrs
ETHUSD saw a slightly bullish trend in the last 24 and touched the upper Bollinger band and now can be seen doing in downward momentum. Trading volume has been low in the last 24 hours.
Today’s Trend analysis
Price is expected to see a downtrend till it reaches the middle Bollinger band. Then if the price accepts the middle band as a support line then we might see the price follow the bullish trend line. But if the price rejects it as a support line then we might see the continuation of the downtrend momentum of price.
Price volatility was low at approximately 2.34%, with the day's range between $2281— $2404.
Price at the time of publishing: $2369
ETH's market cap: $276 Billion
However, the Indicator summary is giving a 'BUY' signal on ETHUSD.
Out of 11 Oscillator indicators, 2 are giving a SELL signal, 8 are neutral and 1 is giving a BUY signal.
Out of 15 Moving average indicators, 1 is giving a SELL signal, 1 is neutral and 13 are giving a BUY signal.
Volumes have remained low in the past 24 hours. The above analysis is supposed to hold if we don't see a sudden spike in the volume.
----------------------------------------------------------------------------------------
The analysis is based on signals from 26 technical indicators, out of which 15 are moving averages and the remaining 11 are oscillators. These indicator values are calculated using 4Hr candles.
Note: Above analysis would hold if we do not encounter a sudden jump in trade volume.
----------------------------------------------------------------------------------------
Any feedback and suggestions would help in further improving the analysis!

DOGEUSD(4Hr) : DOGE moving in consolidationMarket in the last 24hrs
DOGEUSD saw a consolidated movement in the last 24 hours with price moving between the middle and lower Bollinger band. The trading volume has been on the lower side of the spectrum and can be seen decreasing in the last 24 hours.
Today’s Trend analysis
The general trend of the price has been bullish for the last couple of days but the price mainly moved in a consolidated manner between the middle and lower Bollinger bands. The price is likely to continue to move in this manner until we see a sudden jump in the volume it any other fundamental factor affecting the price.
Price volatility was extremely low at approximately 0.6%, with the day's range between $0.23 — $0.238.
Price at the time of publishing: $0.253
DOGE’s market cap: $30.6 Billion
However, the Indicator summary is giving a 'SELL' signal on DOGEUSD.
Out of 11 Oscillator indicators, 1 is giving a SELL signal, 9 are neutral and 1 is giving a BUY signal.
Out of 15 Moving average indicators, 12 are giving SELL signal, 1 is giving neutral and 2 are giving a BUY signal.
Traded volume has been on the lower side of the spectrum and is constantly decreasing in the past 24 hours. If we don't see a sudden spike in volume then we can expect the above analysis to hold true.
----------------------------------------------------------------------------------------
The analysis is based on signals from 26 technical indicators, out of which 15 are moving averages and the remaining 11 are oscillators. These indicator values are calculated using 4Hr candles.
----------------------------------------------------------------------------------------
Any feedback and suggestions would help in further improving the analysis!

SHIBUUSDT(4Hr) : SHIBU INU at a turning point.Market in the last 24hrs
SHIBUUSDT saw an overall bullish trend in the last 24 hours but the price can be seen moving down recently in the last couple of candles. Trading volume has been high in the last 24 hours.
Today’s Trend analysis
The price is at a crucial junction as it nears the middle Bollinger band which usually act as a strong support line but the general momentum of the price and indicators suggest a bearish trend in the future. If the price accepts the middle Bollinger band is accepted as a support line then we might see the price resume its bullish trend.
Price volatility remained high at approximately 12.05%, with the day's range between $0.0000093— $0.0000083.
Price at the time of publishing: $0.0000087
SHIBU’s market cap: $3.4 Billion
However, the Indicator summary is giving a 'BUY' signal on SHIBUUSDT.
Out of 11 Oscillator indicators, 0 are giving a SELL signal, 9 are neutral and 2 are giving a BUY signal.
Out of 15 Moving average indicators, 2 are giving SELL signal, 1 is giving neutral and 12 are giving a BUY signal.
Traded volume remained high in the past 24 hours. If we don't see a sudden spike in volume then we can expect the above analysis to hold true.
----------------------------------------------------------------------------------------
The analysis is based on signals from 26 technical indicators, out of which 15 are moving averages and the remaining 11 are oscillators. These indicator values are calculated using 4Hr candles.
----------------------------------------------------------------------------------------
Any feedback and suggestions would help in further improving the analysis!

XRP(1D) : XRP may see some bearish trend in the next 24 hoursMarket in the last 24hrs
XRPUSD saw a slightly bullish trend in the last 24 hours with price touching the middle Bollinger band. Trading volume has been moderate in the last 24 hours.
Today’s Trend analysis
Price is likely to see a bullish trend as it looks like the price has accepted the middle Bollinger band as a resistance line. We can expect the price to see a bearish trend till it reaches the lower Bollinger band and then a consolidated movement after that.
Price volatility remained low at approximately 1%, with the day's range between $0.649— $0.68.
Price at the time of publishing: $0.661
XRP’s market cap: $30.5 Billion
However, the Indicator summary is giving a 'SELL' signal on XRPUSD.
Out of 11 Oscillator indicators, 1 is giving a SELL signal, 9 are neutral and 1 is giving a BUY signal.
Out of 15 Moving average indicators, 13 are giving SELL signal, 1 is giving neutral and 1 is giving a BUY signal.
Traded volume remained moderate in the past 24 hours. If we don't see a sudden spike in volume then we can expect the above analysis to hold true.
----------------------------------------------------------------------------------------
The analysis is based on signals from 26 technical indicators, out of which 15 are moving averages and the remaining 11 are oscillators. These indicator values are calculated using 4Hr candles.
----------------------------------------------------------------------------------------
Any feedback and suggestions would help in further improving the analysis!

DOGEUSD(4Hr) : DOGE may see some bullish trend in the next 24HrsMarket in the last 24hrs
DOGEUSD saw a major downtrend in the last 24 hours with price moving from the upper Bollinger band to below the lower Bollinger band. The trading volume has been on the lower side of the spectrum in the last 24 hours.
Today’s Trend analysis
The price is expected to see a slight uptrend till the price reaches the middle Bollinger band. An exception can also take place which is that price may reject the lower band as a support line then we might see continuation of the bearish trend.
Price volatility was extremely low at approximately 2.22%, with the day's range between $0.24 — $0.251.
Price at the time of publishing: $0.243
DOGE’s market cap: $31.7 Billion
However, the Indicator summary is giving a 'SELL' signal on DOGEUSD.
Out of 11 Oscillator indicators, 1 is giving a SELL signal, 8 are neutral and 2 are giving a BUY signal.
Out of 15 Moving average indicators, 13 are giving SELL signal, 1 is giving neutral and 1 is giving a BUY signal.
Traded volume has been on the lower side of the spectrum in the past 24 hours. If we don't see a sudden spike in volume then we can expect the above analysis to hold true.
----------------------------------------------------------------------------------------
The analysis is based on signals from 26 technical indicators, out of which 15 are moving averages and the remaining 11 are oscillators. These indicator values are calculated using 4Hr candles.
----------------------------------------------------------------------------------------
Any feedback and suggestions would help in further improving the analysis!

Bitcoin Bullish Confirmation, Tringle Patterns & Volume ProfileBINANCE:BTCEUR
At Yellows you see a Bullish confirmation with re-test. Normally this pattern will bull even more.
Green triangle pattern and blue ascending triangle. Waiting the breakout (include the 3 confirmation candles) to see the direction.
Volume profile: It's break upwards after the yellow re-test, waiting to see if it's breakout the 'Point of Control' then normally the price will go upwards or if it's fail to breakout then the price will go back to bear market.

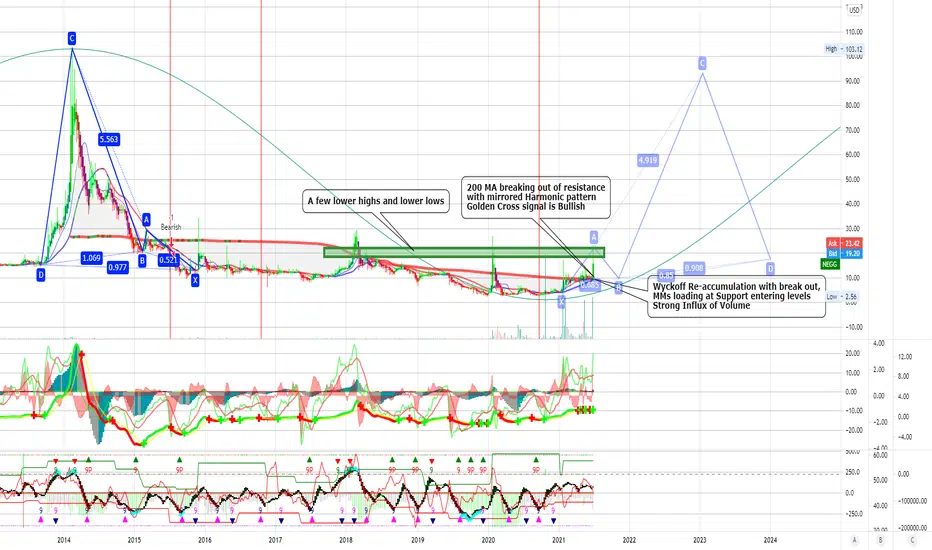
$NEGG 200 MA breaking out of resistance with Harmonic pattern$NEGG
RS Ratio: 1/8 on 10/26/2020
200 MA breaking out of resistance, a few lower highs and lower lows with mirrored Harmonic pattern
Golden Cross signal is Bullish
Golden Cross: The golden cross is a chart pattern that is a bullish signal in which a relatively short-term moving average (MA 50) crosses above a long-term moving average (MA 200). ... As long-term indicators carry more weight, the golden cross indicates a bull market on the horizon and is reinforced by high trading volumes.
Wyckoff Re-accumulation with break out, MMs loading at Support entering levels
Strong Influx of Volume
Newegg Commerce, Inc. owns and operates Newegg.com, an online electronic products retail platform in the United States. The company offers computer hardware products, computers and tablets, electronic products, software, gaming products, cell phones and accessories, home appliances, home living and improvement products, health and beauty products, automotive and industrial products, outdoor and garden supplies, office and point of sale products, sporting goods, watches and jewelry, apparel and accessories, toys, and baby and pet products. The company also provides Newegg Logistics, a logistics solution to help e-commerce sellers and organizations streamline order fulfillment, shipment and returns. It serves corporations, businesses, and individuals. Newegg Commerce, Inc. has a partnership with Payability, Inc. to launch Newegg Capital, a tech-enabled working capital solution for marketplace sellers. The company was founded in 2001 and is based in City of Industry, California. Newegg Commerce, Inc. operates as a subsidiary of Hangzhou Lianluo Interactive Information Technology Co.,Ltd.
XRP(1D) : XRP moving in consolidated momentum this weekMarket in the last 1 week
XRPUSD saw a consolidated momentum with a slight indication of a bullish momentum this week as the price moves between the middle and the lower Billinger band. Trading volume has been moderate and can be seen decreasing with a slight increase in price indicating that there may be a bearish turnaround later.
Next Week's Trend analysis
As the price moves near the middle Bollinger band we reach a crucial point. If the price rejects the middle band as a resistance line then we can see a more prominent bullish trend. But if the price accepts the middle band as a resistance line then we might see a bearish momentum till it reaches the bottom Bollinger band in the next week.
The price change was high at approximately 21.7%, with the week's range between $0.598— $0.728.
Price at the time of publishing: $0.675
XRP’s market cap: $31.2 Billion
However, the Indicator summary is giving a 'SELL' signal on XRPUSD.
Out of 11 Oscillator indicators, 1 is giving a SELL signal, 9 are neutral and 1 is giving a BUY signal.
Out of 15 Moving average indicators, 12 are giving SELL signal, 1 is giving neutral and 2 are giving a BUY signal.
Traded volume has remained high in the past week. If we don't see a sudden spike in volume then we can expect the above analysis to hold true.
----------------------------------------------------------------------------------------
The analysis is based on signals from 26 technical indicators, out of which 15 are moving averages and the remaining 11 are oscillators. These indicator values are calculated using 1 Day candles.
----------------------------------------------------------------------------------------
Any feedback and suggestions would help in further improving the analysis!

DOGEUSD(4 HR) : DOGE continuing its consolidated momentum.Market in the last 24hrs
DOGEUSD saw a consolidated movement between the lower and the middle Bollinger band. The less gap between the bands indicates low volatility. The trading volume has been on the lower side of the spectrum in the last 24 hours.
Today’s Trend analysis
The price is expected to continue to move one a consolidated momentum until it touches either the middle or lower Billinger band. If the price touches the middle band and the price rejects it as a resistance line then we some bullish momentum till the price reaches the upper band. If the price reaches and then rejects the lower Bollinger band as a support line then we see some dominant bearish trend.
Price volatility was extremely low at approximately 2.42%, with the day's range between $0.239 — $0.249.
Price at the time of publishing: $0.242
DOGE’s market cap: $31.5 Billion
However, the Indicator summary is giving a 'SELL' signal on DOGEUSD.
Out of 11 Oscillator indicators, 1 is giving a SELL signal, 9 are neutral and 1 is giving a BUY signal.
Out of 15 Moving average indicators, 13 are giving SELL signal, 1 is giving neutral and 1 is giving a BUY signal.
Traded volume has been on the lower side of the spectrum in the past 24 hours. If we don't see a sudden spike in volume then we can expect the above analysis to hold true.
----------------------------------------------------------------------------------------
The analysis is based on signals from 26 technical indicators, out of which 15 are moving averages and the remaining 11 are oscillators. These indicator values are calculated using 4Hr candles.
----------------------------------------------------------------------------------------
Any feedback and suggestions would help in further improving the analysis!

XRPUSD(4Hr) : XRP to consolidate before setting a trend.Market in the last 24hrs
XRPUSD saw consolidated movement with a slight indication of a bearish trend. The price moved below the middle Bolliger band and rejecting it as a support line. Trading volume has been high in the last 24 hours.
Today’s Trend analysis
The price is expected to continue its consolidated movement with a slight indication of a bearish trend till it reaches the lower Bollinger band. If then the price accepts the lower band as a support line then we can expect some bullish relief. But if the price rejects the bottom band as a support line then we may see some prominent bearish momentum.
Price volatility remained low at approximately 3.48%, with the day's range between $0.647— $0.706.
Price at the time of publishing: $0.664
XRP’s market cap: $30.7 Billion
However, the Indicator summary is giving a 'SELL' signal on XRPUSD.
Out of 11 Oscillator indicators, 2 are giving a SELL signal, 7 are neutral and 2 are giving a BUY signal.
Out of 15 Moving average indicators, 11 are giving SELL signal, 1 is giving neutral and 3 are giving a BUY signal.
Traded volume has remained high in the past 24 hours. If we don't see a sudden spike in volume then we can expect the above analysis to hold true.
----------------------------------------------------------------------------------------
The analysis is based on signals from 26 technical indicators, out of which 15 are moving averages and the remaining 11 are oscillators. These indicator values are calculated using 4Hr candles.
----------------------------------------------------------------------------------------
Any feedback and suggestions would help in further improving the analysis!

DOGEUSD(4 HR) : DOGE teasing us again with the downtrendMarket in the last 24hrs
DOGEUSD saw a major downtrend in the last 24 hours with the price moving from the upper to the lower Bollinger band. The trading volume has been on the lower side of the spectrum in the last 24 hours.
Today’s Trend analysis
As the price touched the bottom Bollinger band and the latest candle can be seen to be green this could mean that the price has accepted the Bottom band and we can see DOGE move in bullish momentum. There is a chance that this might be a false signal and we can see the price to continue its bearish momentum.
Price volatility was low at approximately 5.45%, with the day's range between $0.283 — $0.269.
Price at the time of publishing: $0.252
DOGE’s market cap: $33 Billion
However, the Indicator summary is giving a 'SELL' signal on DOGEUSD.
Out of 11 Oscillator indicators, 2 are giving a SELL signal, 7 are neutral and 2 are giving a BUY signal.
Out of 15 Moving average indicators, 12 are giving SELL signal, 1 is giving neutral and 2 are giving a BUY signal.
Traded volume has been on the lower side of the spectrum in the past 24 hours. If we don't see a sudden spike in volume then we can expect the above analysis to hold true.
----------------------------------------------------------------------------------------
The analysis is based on signals from 26 technical indicators, out of which 15 are moving averages and the remaining 11 are oscillators. These indicator values are calculated using 4Hr candles.
----------------------------------------------------------------------------------------
Any feedback and suggestions would help in further improving the analysis!
