USOIL Oil – April 10, 2025
Price Action & Trend Analysis:
- Current Market Position:
- WTI Crude Oil is showing a bearish trend within a falling wedge pattern, a technical formation that often signals a potential breakout after consolidation. This pattern is visible with converging trendlines (blue), which suggest a potential move to the downside.
- The resistance zone is marked at 61.50, and the price is struggling to break above this level. If it does not break out of this level, further downside momentum may be expected.
Key Levels:
1. Resistance Zone:
- The resistance level is clearly marked near 61.50, and price action has repeatedly struggled to move above this level, showing signs of rejection. A failure to break this l…
ChatGPT: 4. FVG (Fair Value Gap):
- There is a Fair Value Gap (FVG) near 58.12, which indicates a possible area of imbalance where price could potentially retrace to fill the gap before moving in its next direction.
Volume Analysis:
- The volume profile indicates decreasing volume as the price approaches the resistance zone at 61.50, which may suggest a weakening of bullish momentum.
- The increasing volume near the support level at 58.00 suggests that buyers are looking to step in at these levels, but this remains to be seen as the price moves toward this region.
Key Observations:
- The bearish divergence observed between price and momentum suggests that bearish pressure is mounting, especially with the price failing to breach resistance and forming lower highs.
- T
Technicalindicators

GOLD Chart Analysis for Gold (XAU/USD) – April 10, 2025
Key Observations:
1. Price Action and Trend:
- The price is currently in an uptrend, forming a bullish channel (green box) as it moves upwards.
- Resistance is positioned near 3,134.588 and 3,123.580 which are key levels to watch for potential price rejection or breakout.
- Support levels are defined at 3,067.613 and 2,974.936. The price has recently bounced off the support level, suggesting that the trend is still intact and may continue to push higher.
2. Key Levels:
- Resistance: The resistance level near 3,134.588 is being tested currently. A breakout above this level could indicate further bullish momentum.
- Support: The support zone near 3,067.613 is crucial. If the price drops below thi…
ChatGPT: - The volume bars show a spike in activity, suggesting market indecision, but also strong bullish sentiment near the support level.
4. Target Price and Future Projections:
- The target price for this move is 3,134.588, where the price is expected to test resistance. If it breaks this level, the next target could be near 3,150.00.
- The bullish channel suggests that Gold is still trending upward, and the price is likely to continue moving towards the upper boundary of the channel.
Scenario Predictions:
1. Bullish Scenario:
- If Gold successfully breaks the resistance at 3,134.588, it could continue to push higher towards the next resistance zone around 3,150.00.
- Support level at 3,067.613 holds strong, and the price continues to make higher highs…

XAUUSD BUY TARGET SUCCESSFUL HITTING READ IN CAPTIONSHere's a descriptive analysis of the chart you provided, which is a technical analysis chart for Gold (CFDs on Gold, USD/OZ) as of April 9, 2025:
---
Chart Description: Gold (XAU/USD) Price Action Analysis
Time Frame: Intraday (Likely 1-hour or 2-hour candles)
Volume: Displayed at the bottom in green/red bars, showing buying and selling pressure.
Key Highlights:
1. Downtrend Channel:
The price has been moving within a downward channel (marked by red and blue trendlines).
Several lower highs and lower lows were observed until a breakout occurred.
2. Support and Resistance Levels:
Support Level: Around 2,974.936 – This acted as a solid base before the bullish reversal.
Resistance Zone: Around 3,132.939 - 3,137.725 – This area is expected to be a stron…

BTCUSD ChatGPT: Chart Analysis for Bitcoin (1-Hour Timeframe) – April 08, 2025
Key Observations:
1. Price Action and Trend:
- Bitcoin is in a downtrend, as indicated by the blue descending trendlines, creating lower highs and lower lows.
- The resistance zone is near 80,000, with 79,161 acting as a key level of resistance.
- Price is currently approaching the support level, which is in the range of 75,000 to 77,000, indicating a potential area for price reversal or further decline.
2. Order Block and FVG (Fair Value Gap):
- The order block located near 79,161 to $79,000 is an important zone where price rejected and fell previously. This suggests that sellers have been controlling this level, and it may act as a strong resistance again if the price revisits.
- …
ChatGPT: - As Bitcoin approaches the support level, a surge in volume could indicate a possible breakout or a reversal from the support zone.
4. Target and Potential Movement:
- The target for the current setup is 79,161, near the upper resistance zone, with potential upward momentum from the support area.
- Bitcoin is likely to reach the 79,161 target after bouncing from the support zone. However, if the price fails to break through the resistance, a drop back to the support zone or even further downward movement may occur.
Potential Scenarios:
- Bullish Reversal: If Bitcoin bounces from the support level and breaks above the resistance at 79,161, it may push higher towards 80,000 and beyond. The FVG area will be a critical point to monitor for further upward m…
ChatGPT: Currently, Bitcoin is at a pivotal point, testing support while trying to break through resistance. The next price action will depend on how Bitcoin reacts at these key levels. Traders should keep an eye on 79,161, which could be a crucial turning point for the market direction. If the support holds, a reversal is possible, but failure to maintain the support could lead to further declines.

USOIL ChatGPT: Chart Analysis for WTI Crude Oil (1-Hour Timeframe) – April 08, 2025
Key Observations:
1. Trend and Price Action:
- WTI Crude Oil has been trading in a range-bound pattern, as shown by the blue trendlines. The price has been bouncing between the resistance and support levels. Currently, the price is at the lower end of this range near the support level around 58.88.
- The resistance level is at 59.05, and this has been tested multiple times without a sustained breakout, indicating that sellers have been in control around this level.
- The price just tested the support level and bounced slightly higher, which suggests the market may be consolidating before deciding the next move.
2. Order Block and FVG (Fair Value Gap):
- The order block is located…
ChatGPT: - Fair Value Gap (FVG) has been formed around the order block. This means there’s an imbalance in the market that could eventually be filled. Traders should watch for price action near this gap for further insight into whether the gap will be filled or left untested.
3. Volume:
- Volume is relatively low, which suggests a lack of strong momentum in the market. This is typical in range-bound markets, where buying and selling activity are often balanced.
- However, the volume has spiked during the downward move, which could indicate a potential bearish continuation if the price breaks below 58.88.
4. Bearish Setup and Target:
- The chart is showing a bearish setup with the price trading below the resistance zone, and it is testing the support level near

Gold ChatGPT: Chart Analysis for Gold (XAU/USD) – April 08, 2025 – 1-Hour Timeframe
Key Observations:
1. Trend and Price Action:
- The price of Gold is currently in a downtrend, as indicated by the red trendline showing lower highs and lower lows. The price has recently broken below the previous support level, signaling a continuation of the bearish movement.
- The resistance zone near 3,141.64 remains a significant barrier for any upward movement, while the support level at 2,960.00 is holding the price from falling further.
2. Order Block and FVG (Fair Value Gap):
- The order block located at 3,138.95 to 3,141.64 has been a key area where price rejection occurred. The price approached this area but failed to break above, indicating strong selling pressure. This …
ChatGPT: - The target for the current bearish setup is 3,021, which aligns with the support level near 2,987.47. If the price continues to decline, this target could be reached soon, with further downside movement expected.
- If the price holds at the support level and forms a bullish reversal pattern, it may head back towards the resistance zone. However, until the support level holds, the price is likely to continue the downward trajectory.
4. Volume and Market Sentiment:
- The volume shows a consistent decline, confirming the selling pressure. The recent spikes in volume near the support level suggest that the market is reacting to the critical support area.
- Market sentiment remains bearish, with the price currently below its recent highs and the resistan…
ChatGPT: - Bullish Reversal Scenario: If Gold finds support at 2,960 and forms a bullish pattern (such as a reversal candle or engulfing candle), the price might move towards 3,141.64 again.
Conclusion:
The price of Gold is currently in a downtrend, facing resistance around 3,141.64 and support near 2,960. Traders should watch for price action near these levels to assess the next move. The target of 3,021 is the key level to focus on, and a breakout below this could lead to further downside. If the support level holds, there could be a potential for a bullish rebound towards resistance.

USD/CHF Trade Analysis: Potential Reversal & Bullish Setup🔻 Downtrend Phase: The price has been falling sharply, showing a strong bearish move before hitting support. 📉🔥
🟦 Support Zone (0.84458):
🔵 Key level where buyers may step in. If price holds, it could trigger a reversal. 🚀🔄
🟦 Resistance Zone (Mid-Level):
🟡 A minor barrier before price can continue higher. Expect some reaction here. ⚠️📊
🎯 Target Point (0.86190):
✅ Bullish target where price is expected to move if the support holds. 🎯💰📈
⚠️ Stop Loss (0.84458):
❌ If price breaks below this level, the trade setup is invalidated. 🚨🔻
📊 Trade Setup Summary:
✔️ Buy from support (if confirmed)
✔️ Stop Loss below 0.84458 ❌
✔️ Take Profit at 0.86190 🎯💵
🔥 Risk-Reward looks good! Watch for confirmation before entering! 🚀📊

BTCUSD ChatGPT: This chart shows Bitcoin (BTC/USD) on a 4-hour timeframe with key price levels, trends, and targets identified. Let's break down the analysis and potential scenarios for the future price movement:
Key Observations:
1. Price Action & Trend:
- The price of Bitcoin has been in a downward trend, forming a descending channel (shown with blue trendlines). The price has been making lower highs and lower lows, indicating bearish market conditions.
- Recently, Bitcoin tested the resistance zone around 84,067, and after multiple rejections at this level, the price has started to decline.
2. Resistance Zone:
- The resistance zone is marked at 84,067, a key price point where Bitcoin has faced multiple rejections. This level represents a supply zone, and traders …
ChatGPT: 4. Bearish Price Action:
- The chart shows a sharp bearish drop after hitting the resistance zone, suggesting that the market is currently in a correction phase. The price has fallen from higher levels toward the support zone and is likely to experience further downside pressure.
5. Target Level:
- The target for the ongoing bearish move is marked as 78,885, which lies just above the support level at 77,082. This target indicates a potential continuation of the decline towards this support level, and if this support holds, it could be a buying opportunity for a bounce.
Potential Scenarios:
1. Bearish Continuation:
- If the price continues its decline and breaks below 77,082, it would suggest a bearish breakout, with the next target around 78,885 or eve…
ChatGPT: - If the price approaches the 77,082 support level and shows signs of rejection (such as forming a bullish engulfing candle or double bottom pattern), there could be a reversal towards the resistance level at 84,067. In this case, traders may look for a long position, targeting the resistance zone for profit-taking.
3. Consolidation and Range-Bound Behavior:
- There is also a possibility that the price could start consolidating between the resistance and support levels, moving in a sideways pattern. If the price repeatedly tests these boundaries without breaking through, traders can look for range-bound trading strategies with buy orders at support and sell orders at resistance.
4. Breakout Above Resistance:
- If the price breaks above the resistance zone…
ChatGPT: The current chart suggests that Bitcoin is in a downtrend, facing resistance at 84,067 and heading towards the support zone at 77,082. Traders should monitor price action at this support level for potential bounces or breakdowns. If the price rebounds at 77,082, it could move back to test the resistance at 84,067. Conversely, if the price breaks below the support, further downside movement may occur with a target around 78,885 or lower. The descending channel provides a structured view of the market, and a breakout could lead to a bullish reversal or continuation of the bearish trend.

GOLDThis chart represents Gold (XAU/USD) on a 1-hour timeframe. Several key price levels and technical patterns are identified, including resistance zones, FVG (Fair Value Gaps), and target levels. Let's break down the analysis:
Key Observations:
1. Price Action & Trend:
- The price of Gold has been moving downward, as seen from the red trendlines marking a downtrend. The price has faced resistance around the 3,141.644 level, which has acted as a strong supply zone. Following this, Gold showed a sharp decline towards lower levels.
2. Resistance Zone:
- The resistance zone is marked at 3,141.644, which corresponds to a region where the price has previously encountered selling pressure. This level seems to have rejected the price multiple times, confirming it…- The FVG gap is highlighted around the range 3,120.00 - 3,141.644. An FVG represents an area where the price imbalance occurs, typically after a sharp price movement. In many cases, the market returns to fill the gap before continuing in the direction of the initial move. The FVG zone in this chart likely indicates a potential for a price retracement or consolidation before further price action.
- As the price moves downward, the FVG zone is tested, and it might act as a rejection zone if the price moves back into it, suggesting a short trade opportunity.
4. Downward Price Movement:
- The sharp bearish movement observed from the resistance level at 3,141.644 shows a breakdown, confirming a trend reversal. This move pushes the price below the previous su…

#NIFTY Intraday Support and Resistance Levels - 07/04/2025Strong gap down opening expected in nifty near 22050 level. After opening if nifty sustain above 22050 level and gives reversal then expected some correction rally upto 22450 level. This level will act as a strong resistance for today's session. Any bullish side rally can reverse from this level. Downside in case nifty gives breakdown of 22000 level and starts trading below 21950 then expected sharp downside upto 21550 level in today's session.

XAU/USD (Gold) Bullish Trade Setup – Key Levels & Targets📊 XAU/USD (Gold vs. USD) - 1H Chart Analysis
🔹 Entry & Risk-Reward Setup
🟢 Buy Zone: $3,015 - $3,017 ✅
🛑 Stop Loss: $3,003.14 ❌ (Protects against downside risk)
🎯 Target Point: $3,045.40 🚀
🔹 Take Profit Levels (TP)
🟡 TP1: $3,021.01 🥇 (First checkpoint)
🟡 TP2: $3,029.73 🥈 (Second target, stronger resistance)
🔵 Final Target: $3,045.40 🏆 (Major resistance level)
🔹 Market Structure & Price Action
📉 Recent Drop: Found support near $3,003 📌
📈 Potential Upside: Price attempting a bullish reversal 📊
⚠️ Watch for breakout at $3,021+ for confirmation! 🚀📊

Bitcoin (BTC/USD) 4H Analysis: Bullish Breakout or Pullback?🔍 Key Observations:
🔹 📈 Trendline Breakout: The descending trendline (white) has been broken, signaling a potential uptrend.
🔹 📍 Support & Resistance Zones:
🟢 Strong Support (~$80,349 - $82,000): 📉 If price drops, this zone could act as a bounce area. 🛑 Stop-loss is placed below.
🟡 Resistance (~$86,000 - $88,000): 🔄 Currently testing this level—either a breakout or a rejection could follow.
🔵 Next Target (~$94,000): 🚀 If Bitcoin pushes above resistance, this could be the next stop.
📊 Possible Price Action Scenarios:
✅ Bullish Path:
🟢 Breaks Above $86,000 → Targets $94,000 🚀
🔄 Small retest of support before continuing up 📈
❌ Bearish Path:
❌ Rejected at $86,000 → Pullback to $82,000 🔽
📉 If support fails, price may drop further
🎯 Conclusion:
🔥 Bullish Bias: 🟢 A breakout above $86,000 increases the chance of hitting $94,000+.
⚠️ Watch for retests! 🔄 A pullback before an upward move is possible.
🚀 Final Thought: If BTC **

"XAU/USD Price Action Analysis: Targeting $3,063 or Reversal to Alright! Let's break down the chart analysis. 📊
🔹 Chart Overview:
Pair: XAU/USD (Gold vs. US Dollar)
Timeframe: 1-hour (H1)
Price Level: Current price at $3,030.44
Target Point: $3,063.97
🔥 Key Observations:
Supply and Demand Zones:
The highlighted blue zones suggest resistance (supply) where price was rejected twice (blue arrows).
The larger gray zones below indicate potential demand/support.
Double Top Formation:
The double blue arrows point to a possible double-top pattern, hinting at a bearish reversal. However, the price hasn't strongly broken below the neckline yet.
Scenario Analysis:
Bullish Scenario: If the price holds the current demand zone and breaks above the immediate resistance, we could see a rally towards the target of $3,063.97. 💹🚀
Bearish Scenario: If it fails to hold the support zone, it may drop to the lower demand area around $3,000. 🔻
📉 Conclusion:
Entry Idea: Long above the supply zone break with a target of $3,063.97.
Stop Loss: Below the current demand zone at around $3,020.
Risk Management: Watch for strong price action before entering.

#NIFTY Intraday Support and Resistance Levels - 21/03/2025Flat opening expected in nifty. Expected opening near 23200 level. This level will act as an immediate resistance for nifty. Any downside reversal expected from this level. Downside 23000 level will act as a strong support for today's session. Any downside movement can revers from this support level. Strong upside rally expected if nifty starts trading above 23250 level. This rally can be 200-250+ points in today's session.

XAUUSD Gold Analysis: Bounce from Support or Breakout Below?😉
🔹 Support & Resistance Zones:
▫️ Support Area: 📉 Around 3,022.26 — buyers might step in here!
▫️ Target Zone: 🎯 Near 3,070 — potential resistance or profit-taking spot!
🔹 Entry & Stop Loss:
📍 Entry Idea: Near the support area for a bounce!
❌ Stop Loss: Below 3,022.26 — minimizing risk if price dips!
🔹 Price Action & Projection:
🔹 Plan: 📈 Buy from support, aiming for the target zone!
🔄 Retracement: Small dip before pushing up — cautious entry!
🔥 Quick Take:
✅ If price respects the support, it could pop to the target!
❗ If it breaks below, stop loss saves the day!

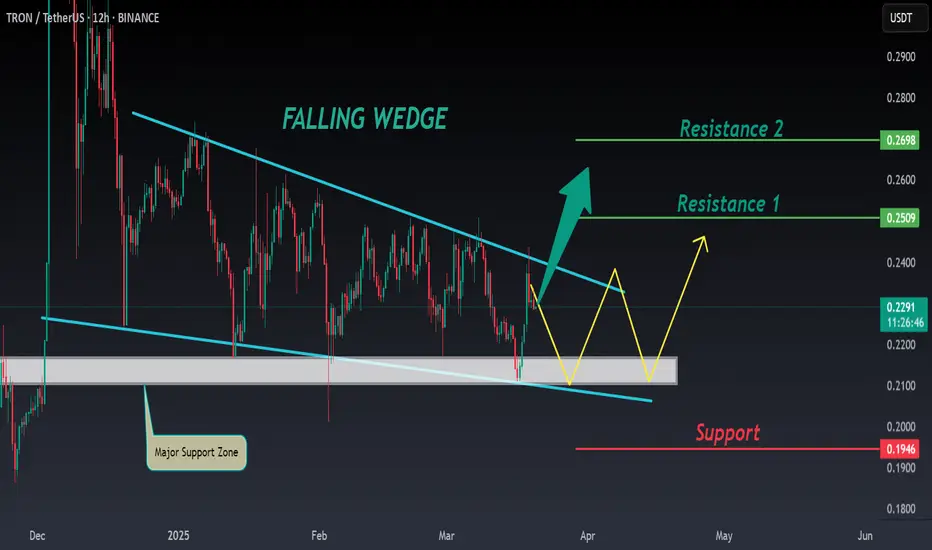
TRX ANALYSIS📊 #TRX Analysis
✅There is a formation of Falling Wedge Pattern on 12 hr chart and currently trading around its major support zone🧐
Pattern signals potential bullish movement incoming after a breakout
👀Current Price: $0.2290
🚀 Target Price: $0.2500
⚡️What to do ?
👀Keep an eye on #TRX price action and volume. We can trade according to the chart and make some profits⚡️⚡️
#TRX #Cryptocurrency #TechnicalAnalysis #DYOR
Understanding the MACD Indicator The MACD (Moving Average Convergence Divergence) is one of the most widely used technical indicators, helping traders identify trend direction, momentum shifts, and potential buy/sell signals.
How the MACD Works:
📌 MACD Line (Blue): The difference between the 12-period EMA and the 26-period EMA.
📌 Signal Line (Orange): A 9-period EMA of the MACD line, smoothing out signals.
📌 Histogram: Measures the difference between the MACD and Signal Line, visually representing momentum.
How to Use It for Trading:
- Bullish Crossover: When the MACD Line crosses above the Signal Line, it indicates a potential buying opportunity.
- Bearish Crossover: When the MACD Line crosses below the Signal Line, it signals a potential selling opportunity.
- Divergences: If price action moves opposite to MACD, it can indicate trend exhaustion and potential reversals.
- Histogram Strength: Expanding bars suggest strong momentum, while contracting bars indicate weakening trends.
MACD in Action (Chart Above)
In this NASDAQ 100 chart, we see a clear bearish crossover followed by strong downward momentum. The histogram confirms the selling pressure, aligning with the price drop.

GOLD TRADING POINT UPDATE > READ THE CHAPTIAN Buddy'S dear friend 👋
SMC Trading Signals Update 🗾🗺 Gold Traders SMC-Trading Point update you on New technical analysis setup for Gold 🪙 💥 Gold Traders Gold 4 Time Frame. Tast diamond zone support level. Close above EMA ) indicator. ) SMC Trading point expect it. Bull 🐂 trend 📈 supply zone 2920 2930. This levels. Expect it selling Arya )
Key Resistance level 2920 + 2930
Key Support level 2852 - 2834
Mr SMC Trading point
Pales support boost 🚀 analysis follow)

[INTRADAY] #BANKNIFTY PE & CE Levels(04/03/2025)Today will be slightly gap down opening expected in market. After opening important level for banknifty is 48050. If it is sustain above this level then expected upside rally upto the 48450 level. Major downside expected below 47950. This downside can be possible of 400-500+ points in index. Upside 48450 level will act as a strong resistance for today's session.

BNB ANALYSIS ( UPDATE ) 📊 #BNB Analysis : Update
✅As we said earlier, #BNB performed same. Now we can see that #BNB is trading around a major support area and following a trendline. We could expect around 10% bullish move if it sustain its major support area
👀Current Price: $673
🚀 Target Price: $745
⚡️What to do ?
👀Keep an eye on #BNB price action and volume. We can trade according to the chart and make some profits⚡️⚡️
#BNB #Cryptocurrency #TechnicalAnalysis #DYOR

Statistically Likely Bitcoin Has A Large Positive Move ComingThe Continuation Indicator by Apex Algo Systems has once again flashed a new buy signal just a few months ago, adding to its strong historical track record on the 1-month chart. Every previous buy signal has preceded a significant market rally before reaching the next major top. Could this be another pivotal moment in the market cycle?
Historically, the indicator has identified powerful trend continuation setups, signaling high-probability opportunities before explosive price movements. By analyzing volatility dynamics, momentum shifts, and long-term price trends, the indicator helps traders recognize statistically extreme conditions that have historically led to major market moves.
In the attached image, you can see how every past buy signal has been followed by a substantial market rally. Now, with a fresh signal printed just a few months ago, history may be repeating itself once again.
🔥 Could this be the start of another massive move? Or will this time be different?
📊 Let’s discuss! Are you bullish after this signal? Do you think the market is following historical trends? Share your thoughts in the comments below! 👇
📌 Disclaimer: This is not financial advice. Trading involves risk, and past performance does not guarantee future results. Always conduct your own research before making investment decisions.

Bitcoin is hunting for liquidity, What's next?📊 After attempting to break $100K, Bitcoin faced another rejection.
What’s happening now?
The SMA shows that Bitcoin is still in a short-term downtrend, struggling to gain momentum.
Right now, it’s hovering around $96,400 – $96,500, trying to stabilize.
The key support to watch is $94,400 – $94,600—if it holds, we could see a bounce. If not, things might get shaky.
On the upside, Bitcoin needs to break $100K first before making a real move toward $103K and beyond.
For now, all eyes are on the $94K support.
Will BINANCE:BTCUSDT hold or dip lower? What do you think?

#AIXBTUSDT continuation of the downtrend📉 SHORT BYBIT:AIXBTUSDT.P from $0.2255
🛡 Stop Loss: $0.2366
⏱ 1H Timeframe
✅ Overview:
➡️ BYBIT:AIXBTUSDT.P continues its downtrend, forming lower highs and lower lows.
➡️ The price has broken the $0.2290 liquidity zone and is holding below it, signaling weak buying pressure.
➡️ If sellers maintain control at $0.2255, a drop towards $0.2040 is likely.
➡️ POC at $0.2566 suggests the main volume accumulation is above the current price, reinforcing the bearish outlook.
➡️ High volume on recent candles indicates selling pressure, which could accelerate the downtrend.
⚡ Plan:
📉 Bearish Scenario:
➡️ Enter SHORT from $0.2255 if price confirms a breakdown.
➡️ Risk management with Stop-Loss at $0.2366, above key resistance.
🎯 TP Target:
💎 TP1: $0.2040 — strong support and profit-taking zone.
📢 BYBIT:AIXBTUSDT.P is in a bearish phase. If the price holds below $0.2255, further downside movement towards $0.2040 is expected.
📢 However, if the price reclaims $0.2366, the bearish scenario could be invalidated, leading to a potential bullish correction.
🚀 BYBIT:AIXBTUSDT.P Expecting a continuation of the downtrend!
