USDJPY Buy set up
Hello everyone
Here's the latest USDJPY analysis.As you can see, this is just price action analysis and you should be patient till get right candle stick confirmation.
good luck
Technicalindicators

Moving Averages Crossover Masterclass Part 1Moving Average Convergence Divergence (MACD)
Created by Gerald Appel
It was designed in order to reveal changes in the direction, strength, momentum, and duration of a trend in a stock’s price
It is a trend-following momentum indicator which shows the relationship between two moving averages of a stock’s price
As the name suggests, MACD is all about the convergence and divergence of two moving averages
Convergence occurs when the moving averages move towards each other while Divergence occurs when the moving averages move away from each other
Three main components of MACD Calculation: MACD line, Signal line, and MACD Histogram
MACD line – Calculated by subtracting 26-day EMA (Exponential Moving Average) from 12-day EMA.
Exponential Moving Average (EMA) is a type of moving average which places a greater weightage on the recent data points when compared to the past data points, making it react more significantly than a simple moving average.
Signal line – 9-day EMA of the MACD line is called the signal line
Histogram – Histogram is the graphical distance between MACD and the signal line, height used to assess how strong the price is moving in the given direction
There are three main parameters of MACD as a whole:
Look-back period of long term EMA to be formulated for MACD
Look-back period of short term EMA to be formulated for MACD
Look-back period of EMA to be formulated for signal line calculation
There are many ways MACD can be used to formulate trading strategy, out of which we will be discussing two in this post:
1. Centerline Crossover
Centerline: Zero lines above and below which the MACD line oscillates, diving the canvas in bullish and bearish regions
Bullish Crossover when MACD line moves above zero i.e. 12-EMA crosses up 26-EMA
Bearish Crossover when MACD line moves below zero i.e. 12-EMA crosses down 26-EMA
Signal Generation
BUY when MACD crosses up 0 while SELL when MACD crosses down 0
2. Signal line crossover
The signal line is 9-day EMA of MACD that means it trails the MACD thereby indicating momentum changes in convergence-divergence
Bullish crossover when MACD turns up and crosses above the signal line
Bearish crossover when MACD turns down and crosses below the signal line
Signal Generation
BUY when MACD crosses up the signal line and SELL when MACD crosses down the signal line
A lot more interesting things can be done using MACD, about which we'll be talking in the next Masterclass on MACD.
STAY TUNED!
----------------------------------------------------------------------------------------
Your questions and comments are most welcome.
If you find the post useful, please like, share, and follow to make sure that you get more information once published.
- Mudrex

New trades today $EWG $EWD $CAR $URI $AMT $O$VIX inched higher to 29.2 and I expect it to hang around the 30 handle going into the election, no exits today, I put on 3 new pairs trades and plan on taking them off next week and most likely flattening my entire portfolio into cash going into election week.
Jared

Relative Strength Index Masterclass Part 2Relative Strenght Index Part 2
In the previous masterclass, we saw the two different ways of using the Relative Strength Index as an indicator. In Part 2, we'll look out for two other ways to use RSI along with other indicators.
The two previous ways were:
1. Oversold-Overbought Region
2. 50-Level RSI Midline
Moving forward the two more ways are:
3. 2-Period RSI + Simple Moving Average (SMA)
2-Period RSI:
2-period RSI is the shortest and most volatile RSI signal which can be used
A 1-period RSI cannot be used as it will merely give just two values, either 0 or 100 as a 1-period RSI will consider values from just the last 1 candlestick
2-period RSI will generate trade signals at the local highs and lows of the predominant trend and will lead to a reversal in the market price
Therefore, 2-period RSI Strategy is also known as Mean-Reversion Trading Strategy
The 2-Period RSI will generate a signal using a Threshold of 95-5, with price above 95 in the overbought region while below 5 in the oversold region
200-Simple Moving Average:
200-SMA is a Simple Moving Average of the past 200-candlestick
When price moves above the 200-SMA, the market is moving above average and indicate a bullish trend
When price moves below the 200-SMA, the market is moving below average and indicate a bearish trend
Thereby, 200-SMA giving the predominant trend and 2-Period RSI generating trade signals.
Thus Buy when the price is above 200-SMA and RSI<5 while, sell when the price is below 200-SMA and RSI>95.
4. RSI + MACD
RSI:
The RSI will generate a signal once a predominant trend is generated using MACD
The threshold for RSI will be 70-30, with price above 70 in the overbought region while below in the oversold region
The lookback period for RSI is taken as default (14)
MACD:
MACD is a trend-following momentum indicator
MACD is calculated by subtracting 26-period EMA from 12-period EMA, resulting in MACD line
A nine-day EMA of MACD results in Signal line
When the signal line is above the MACD line indicates a bullish signal as small period EMA is greater than the long period
When the signal line is below the MACD line indicates a bearish signal as small period EMA is lesser than the long period
Thereby, MACD giving the predominant trend and RSI generating trade signals.
Thus Buy when the Signal line is above MACD and RSI<30 while, sell when the signal line is below MACD and RSI>70.
A lot more interesting things can be done using RSI, but we'll move to the next indicator in our next Masterclass. STAY TUNED
----------------------------------------------------------------------------------------
Your questions and comments are most welcome.
If you find the post useful, please like, share, and follow to make sure that you get more information once I publish it.
- Mudrex

Ichimoku Cloud Indicator MasterclassIchimoku Cloud
Ichimoku Cloud is a set of technical Indicators that show support and resistance levels, momentum as well as trend direction which is done by taking into consideration multiple averages and plotting them over the chart.
It is composed of 5 lines, 2 of which compose a cloud where the difference between the two lines is shaded in where the price may find support or resistance.
The 5 lines include,
a 9-period average (conversion line),
26-period average (baseline),
an average of those 9-period and 26-period averages (Leading Span A),
a 52-period average (Leading Span B) and
a lagging closing price line (Lagging Span)
There are different ways to interprate the Indicator:
Ichimoku Cloud
The cloud is the most prominent feature of the Ichimoku Cloud plots. The leading Span A moves faster than the Leading Span B as Leading Span A, the average of conversion line (9-period average), and base line (26-period average) while Leading Span B, 52-period average making the shorter moving average more sensitive and faster than longer moving averages.
The price is above the cloud indicates an uptrend and it is strengthened when the Leading Span A is moving above and rising from Leading Span B, similar for downtrend.
Ichimoku Crossover
For the crossover strategy there will be use of Conversion Line (9-period moving average) and Base Line (26-period moving average). The crossover line takes lesser data points into consideration and reacts to the price more quickly while the baseline considers more data points tending it away from the market price thereby making the reactions slower.
Therefore, for Ichimoku crossover a buy signal is generated when the conversion line moves above the base line and sell when the conversion line drops back below the base line.
Price-Baseline Trend
As the price moves down below the Base Line representing a short-term oversold situation within a bigger uptrend with the pull back ending when the price moved back above the Base Line to trigger Bullish signal while as the price moves above the Base Line representing a short-term overbought region within a bigger downtrend with the bounce ending when the price moved back below the Base Line trigger to a Bearish signal.
Ichimoku + RSI
The Oscillator indicator is RSI and the moving average is Ichimoku in which we’ll be using RSI to give signal i.e. the signal chart while Ichimoku will provide with the trend i.e. the trend chart.
Buy when Leading Span A is above Leading Span B, and the value of RSI crosses up 30 and sell when Leading Span A is below Leading Span B along with the value of RSI crosses below 70.
Few Limitations of Ichimoku Cloud
Can make chart complex and distracting
There are few points plotted in future which might go in vain
May become irrelevant for long period of time as price remains way above or way below the cloud
Different signals from different elements making it a bit confusing
----------------------------------------------------------------------------------------
Your questions and comments are most welcome.
If you find the post useful, please like, share and follow to make sure that you get more information once I publish it.
- Mudrex

AUDUSD analysis, price close to trendline resistance,sell setupPlease Support this Idea with LIKE if it is Useful....
AUDUSD
The price is close to Support/resistance level,if price breaks the support after a pullback If price shows rejection from the level I expect the price to continue lower,wait for the price to make a pullback if price gives any bearish signal then look for sell opportunity...
For Entry:
Wait for the formation of Bearish Candlestick Pattern to close on 4hr timeframe for confirmation to SELL..
Trade it with proper Sl..
In case, if price breaks above the support/resistance then we have to wait for a clear direction..
Push LIKE & SUPPORT the Idea...
*The content on this analysis is subject to change at any time without notice, and is provided for the sole purpose of assisting traders to make independent investment decisions.

The S&P 500 will be going higherNice long today, and I anticipate the long will continue into the FOMC speech followed by a further melt up. Again downside risk is rather low, as support seems strong and is easy to find.

US30 expect correctionWave 5 & 3 have given divergence. Expecting ABC correction which will complete wave 2.

GBPUSD RUNNING +4% / +400 PIPS SHORT GBPUSD short going well.
Riding the trend down, and will continue to hold until a reverse alert is shown from the indicator strategy.

Divergence on DStrong divergence on D. Ascending trend line should break. Possible closest target is 1.15055, sl @ 1.2013.

GBP/NZD WEEKLY ANALYSISThe pair broke through support level at 1.98237 then acted as a resistance level once the price retested. Resistance held price below and we may see a retest of support level 1.96408


Very nice clear move to the top of the channelAs is in the chart, top of the channel is reached;
Bullish scenario, from here we’ll have some sideway movement for a few candles so that the Tenkan-Sen catchups up a bit, then a successful retest of the Tenkan-Sen to establish a clear baseline and a bullish break of the top of the channel into yet another higher price range.
Bearish scenario this proves to be another bart move like the previous two attempts at the 12k, a triple top is formed, the bottom of the channel breaks and the price goes to fill the CME gap at higher 9k. (unlikely worst case scenario imo.)
(the volume on the 12k break and a quick retest seemed healthy enough to prove sustainable.)

GBPNZD REGULAR DIVERGENCE SPOTTEDThe RSI Divergence has been spotted on the hourly time frame signalling a switch of trend. Shorting from now on would be a good idea.

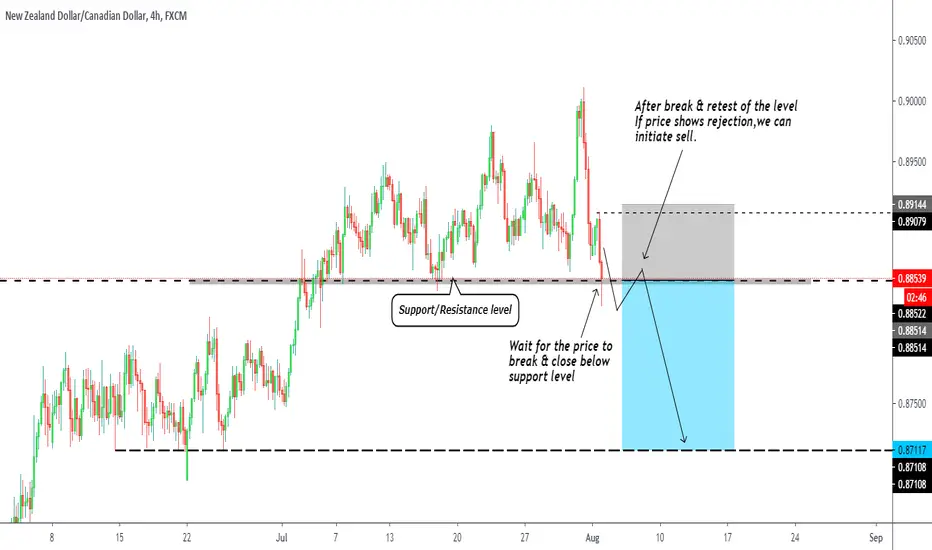
NZDCAD, wait for Break & close below support, sell setup....Please Support this Idea with LIKE if it is Useful....
NZDCAD
The price is close to Support/resistance level,After break & retest of the level then after a pullback If price shows rejection from the level I expect the price to continue lower,wait for the price to make a pullback if price gives any bearish signal then look for sell opportunity...
For Entry:
Wait for the formation of Bearish Candlestick Pattern to close on 4hr timeframe for confirmation to SELL..
Trade it with proper Sl..
In case, if price breaks above the support/resistance then we have to wait for a clear direction..
Push LIKE & SUPPORT the Idea...
*The content on this analysis is subject to change at any time without notice, and is provided for the sole purpose of assisting traders to make independent investment decisions
How to Trade the Tech Cold War? BIG SHORT?
FA:
Global supply chain issues have made the logistics of semi-conductors even more complicated; thus we can expect rising costs and lower profits
The Tech cold war between USA and China if led to Chinese retaliation may lead to US semi-conductor companies being hit hard the most as China contributes to 60% of the market demand of semiconductors
Skyworks Solutions is predicted to release a decline in earnings for the period ending in June 2020
Decrease in Hedge fund interest when you analyze portfolios
TA:
Perfect Gann Set up, with the second pull up providing a perfect shorting area with the Stop loss being defined outside of the Gann area
You can book profits earlier, but when trading with Gann , you usually book profits at the point where there is a bullish crossover which is when it crosses above the 1/1 region.
-Megalodon Whales (Rahim)
Enjoyed doing this chart for you, PLEASE Share/Like and Comment

EURUSD, Price will move down..Please Support this Idea with LIKE if it is Useful....
US30
Price broke above the resistance and then came below the Support/Resistance level this move may be a fakeout,after a pullback I expect the price to continue downward...
For Entry:
Wait for the formation of Bearish Candlestick Pattern to close on 1hr timeframe for confirmation to SELL..
Trade it with proper Sl..
In case, if price breaks above the support/resistance then we have to wait for a clear direction..
Push LIKE & SUPPORT the Idea...
*The content on this analysis is subject to change at any time without notice, and is provided for the sole purpose of assisting traders to make independent investment decisions.

USD/CHF Good ShortGood day snipers. Loving this setup right here. First, after price broke below those ranges, I only consider looking for shorts due to that over all downtrend. Price also rejected the 78.6 Fib Retracement Level previously, and broke through support turned resistance. Long wicks showing price keeps rejecting the resistance zone and price closed below the 78.6 Fib Level. Also, price seems to be on top of a recent downtrend channel .
Follow me on tradingview for more ideas and sniper entries. If you liked this idea please click that thumb's up.
Ideas posted are not financial advise, but merely just to give insights and education for traders.
Past performances do not determine future gains.
As sniper traders, we tread carefully, then we take shots immediately.
Join the discussion down below.

USD/CAD Short Immediately?Good day snipers. I have been monitoring this trade in the past week and looks like price has rejected the resistance zone again with that bearish engulfing candle on the 4H. It also has been rejecting the 23.6 fib level retracement several times now and an overall downtrend on the 4H and 8H time frames. Stop Loss would be just above that resistance and fib level. Decent 2:1 risk:reward ratio where the take profit level would be on the strong support zone .
Follow me on tradingview for more ideas and sniper entries. If you liked this idea please click that thumb's up.
Ideas posted are not financial advise, but merely just to give insights and education for traders.
Past performances do not determine future gains.
As sniper traders, we tread carefully, then we take shots immediately.
Join the discussion down below

AUD/USD to FALL!The AUD/USD lies below the MA of Bolinger Band. Price has entered the high volatility zone , so the fluctuations are going to continue. Moreover , we can observe likely formation of the Head&Shoulders pattern , so the pair will decrease.

USDCHF, Bearish Price Action, Sell setup..Please Support this Idea with LIKE if it is Useful....
USDCHF
I expect the price to decline from the SELL zone,wait for the price to make a pullback to the zone and if price gives any bearish signal look for sell opportunity
For Entry:
Wait for the formation of Bearish Candlestick Pattern to close on 2hr timeframe for confirmation to SELL..
Trade it with proper Sl..
In case, if price breaks above the support/resistance then we have to wait for a clear direction..
Push LIKE & SUPPORT the Idea...
*The content on this analysis is subject to change at any time without notice, and is provided for the sole purpose of assisting traders to make independent investment decisions.

AUDJPY, above support/resistance level,Buy setup....Please Support this Idea with LIKE if it is Useful....
AUDJPY
The price is above key support/resistance level ,after a pullback If price continues to hold the Support then there is a chance that price might continue to grow,wait for the price to make a pullback and if price gives bullish signal and look for buy opportunity..
For Entry:
Wait for the formation of Bullish Candlestick Pattern to close on 4hr timeframe for confirmation to Buy..
Trade it with proper Sl..
In case price breaks below the level then we can look for sell opportunity..
Push LIKE & SUPPORT the Idea...
*The content on this analysis is subject to change at any time without notice, and is provided for the sole purpose of assisting traders to make independent investment decisions

EURO FUTURE TO ANALYSE EUR/USD FX- OPPORTUNITY LONG - 6E!-240MNFrom the history of the 6E! Euro Future which can be used to analyse also the EUR/USD (FX), we can see that there is a strong probability to see the market pushing up to break the lines as it is entering in a very high pressure zone.
The horizontal blue line is a very strong support, very hard to break. We have seen several attempts to brake the blue line with very huge volumes. All Failed!
However, there is a grey horizontal line which shows an hypothetical support under the horizontal blue line.
Potential probable high profits for entry when the market will break the lines and exit this current pattern.
Beware of possible pullback on the top red thick resistance line marked by the green arrow.
----------------------------------------------------------------------------------------------------------------------------------------
We see more and more people happy taking positions and decisions through our analysis.That's great!
Please beware about this DISCLAIMER: this trading idea and all others published here or on any social network, editorial, media and press, can change at anytime without any notice. Trading is risky and losses or profits are the results of your own decisions and not the result of this analysis. Trading assets on financial markets is very risky and this analysis is to provide another point of view.
