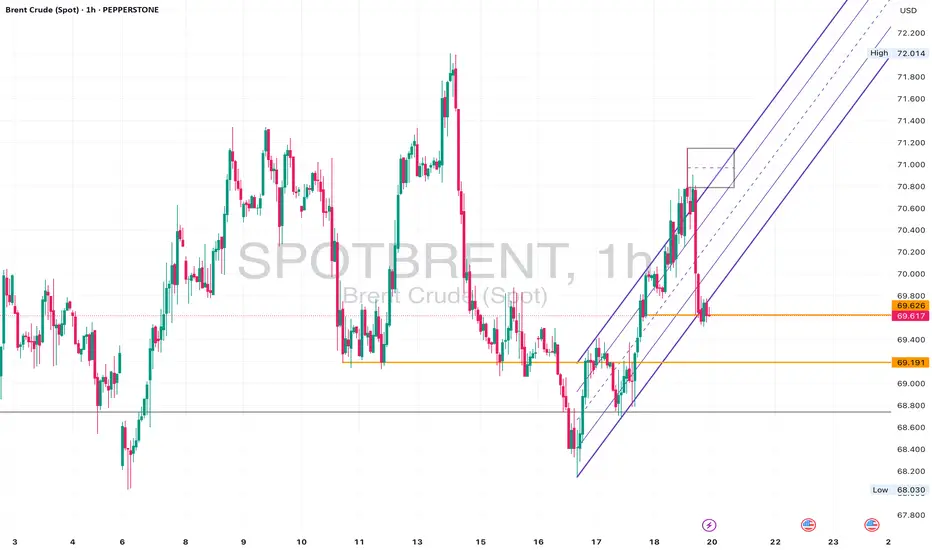
Brent UKOil - Neutral Slightly Bearish • Daily: Price is sitting above long-term trendline support, but momentum is waning.
• 4H: Structure looks indecisive with constant failures near 71.00.
• 1H: Recent break of the upward channel. Now retesting that zone from below.
⚠️ Watch For:
• Retest of 69.60–70.00 as resistance.
• Break and close below 69.20 could signal deeper downside.
• If it holds above 70.20 again, bullish bias resumes.
Technicalsetup
TBO TEK LTD – 19 May Trendline Resistance Test Incoming 📌 Trade Plan (Aggressive Swing Setup):
Buy above: ₹1,250 (on breakout + volume confirmation)
Stoploss: ₹1,195
Target 1: ₹1,310
Target 2: ₹1,385
Sell Below: ₹1,180 (if price rejects the trendline with high volume)
🔎 Technical Insights:
Strong volume buildup near resistance
RSI trending upwards with bullish momentum
Trendline acting as dynamic resistance since Nov 2024
For Education Purposes Only

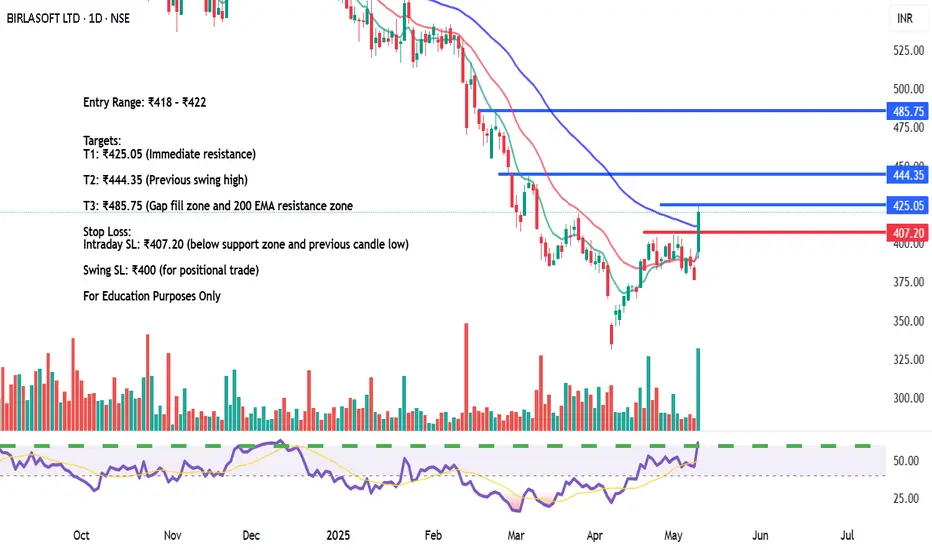
BIRLASOFT LTD – Bullish Reversal with Volume Surge✅ Trade Plan:
Stock gave a bullish breakout with a large green candle & volume spike
RSI crossed 60 level – bullish strength confirmed
Price broke above short-term resistance zone at ₹407 and nearing ₹425
💰 Buy Zone:
Entry Range: ₹418 – ₹422 (on 15min or 1H candle close above ₹420)
🎯 Targets:
T1: ₹425.05 (Immediate resistance)
T2: ₹444.35 (Previous swing high)
T3: ₹485.75 (Gap fill zone and 200 EMA resistance zone)
🛑 Stop Loss:
Intraday SL: ₹407.20 (below support zone and previous candle low)
Swing SL: ₹400 (for positional trade)
🔁 Strategy:
Scalp at ₹425 with 30–40% booking
Hold rest for breakout continuation toward ₹444+
Trail SL to ₹415 once above ₹425
For Education Purposes Only
IRFC - Change in market structure break of double bottom patternIRFC on daily timeframe witness change in market structure by forming higher high and higher lows as well as breakout of the trendline showing a bullish potential up to the retracement level by aiming 1st target of 180 and 2nd target of 192, managing risk by keeping a stoploss of 154

PFC: Bullish Breakout with Raghanseda Project Development 1.Chart Pattern:
The stock has broken out of a downward-sloping trendline after a prolonged consolidation phase within a rectangle pattern (yellow box).
This breakout is supported by higher volumes, signaling strong buying interest.
2.Fundamental Trigger:
Power Finance Corporation has incorporated an SPV for the Raghanseda Transmission Project, enhancing its growth outlook.
3.Technical Levels:
Current Price: ₹512.20
Immediate Support: ₹499.95 (near breakout zone).
Critical Stop-Loss: ₹472.95 (below previous support).
Upside Targets: ₹527.45 (minor resistance) and ₹556.00 (major target, ~11% upside potential).
4.Indicators:
RSI is trending upwards, indicating positive momentum but not overbought.
Moving averages are aligning for a bullish crossover, supporting further upside.
5.Projection:
If the price sustains above ₹500, we could witness a rally towards ₹556 in the near term.
Traders may consider entering on pullbacks near ₹500 with a stop-loss at ₹472.95.
Risk Disclaimer: This is for educational purposes only. Conduct your own research before making any trading decisions.

GBPJPY short trade idea bagged 300 pips! An update to last week’s GJ setup played out beautifully!
Anticipated the pull back before 155.
+300 pips, baby!
