META : Old Peak can be TestedMeta platform has lost altitude from the channel it has formed since 2023, but has gained momentum and re-entered the channel. The possibility of testing the old peak contains a good RR rate.Of course, with a stop-loss close to the 200-period moving average.( Risk/Reward Ratio : 2.48)
Stop-Loss: 605.47
Target : 740.10
Technology

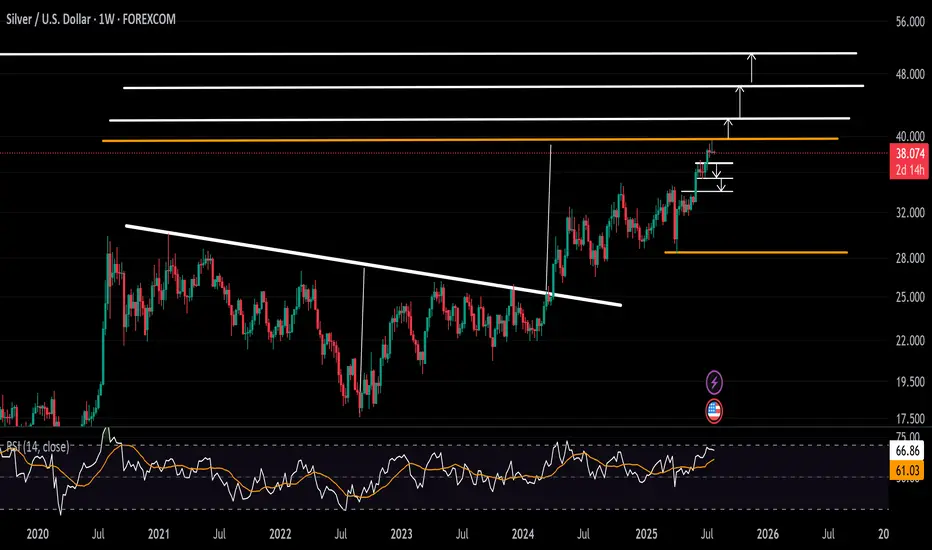
Silver Signals Pullback Risks From $40 BarrierFrom a fundamental standpoint, the strength seen in both tech and silver markets in 2025 may be supported by the structural integration of AI and innovation into global economic agendas. As AI and technology increasingly become the backbone of global infrastructure and development, demand is likely to remain strong.
Silver is currently retreating from the $40 psychological zone, the 39.50 high, which aligns with the target of an inverted head and shoulders pattern formed between August 2020 and March 2024.
• Pullback Scenario: In line with weekly overbought momentum as per the RSI indicator, a retracement may target support levels at $37, $36.20, and $35.20 before resuming its broader bullish trend.
• Breakout Scenario: A confirmed close above $40 may open the door to $42, $46, and potentially a move beyond $50.
Written by Razan Hilal, CMT
Worst Behind GTLB. Do you think the worst is behind for GTLB?
With news of senior management selling stock share and the downgrade, we see a clear test of low since April this year. Since the news always come out the latest, the decline during the last 3 months is likely the explaination to the selling pressure we have seen.
However, the bottom is well defended structural-wise, supported by a slow and steady increase in company revenue.
My expectation is that at least we should see a retest around the 200MA.
I am adding GLTB to my portfolio at a 3% position size.
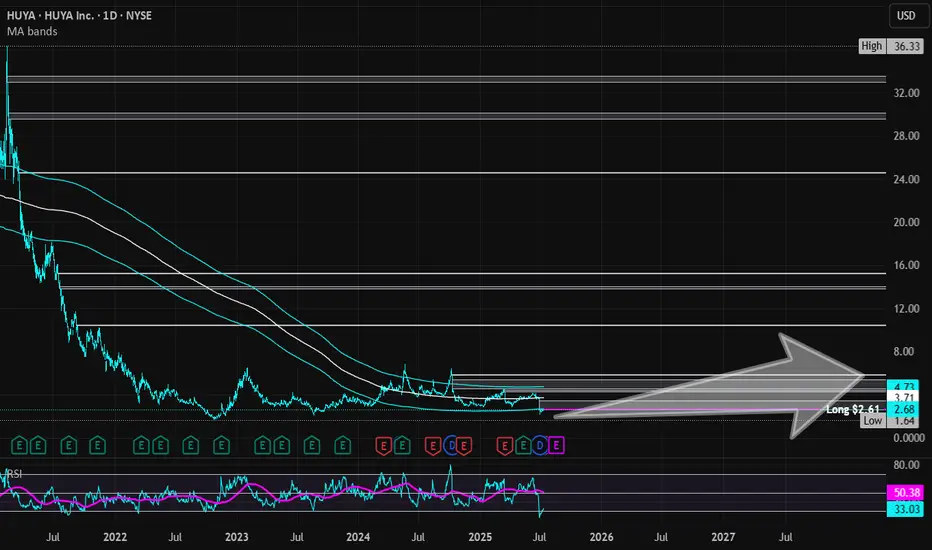
HUYA | HUYA | Long at $2.61HUYA NYSE:HUYA operates game live streaming platforms in China. This stock got my attention based on the reported fundamentals and price position, but moderate "Chinese delisting" risks exist given the US's new political administration.
Book Value = $3.23 (Undervalued)
Forward P/E = 4.1x (Growth)
Debt-to-equity = 0x (Healthy)
Quick Ratio = 1.56x (Healthy)
Altman's Z Score = <1.8 (Bankruptcy risk is relatively high)
From a technical analysis perspective, the stock price momentum has shifted upward based on the historical simple moving average. The price often consolidates within and slightly outside of this simple moving average band before progressing higher (after a long period of selling). While near term-declines are a risk, a longer-term hold (if the fundamentals do not change and delisting doesn't occur) may pay off given the value, growth, and overall health of the company.
Thus, at $2.61, NYSE:HUYA is in a personal buy zone.
Targets into 2028:
$3.45 (+32.2%)
$5.80 (+122.2%)
How expensive is Nvidia today?How expensive is NASDAQ:NVDA today?
❗ You're paying $40 today for $1 of next year's earnings
That's what Nvidia's forward P/E 40x means at current $172 per share
AI might be the future but you're prepaying for it like it's 2060 🤖

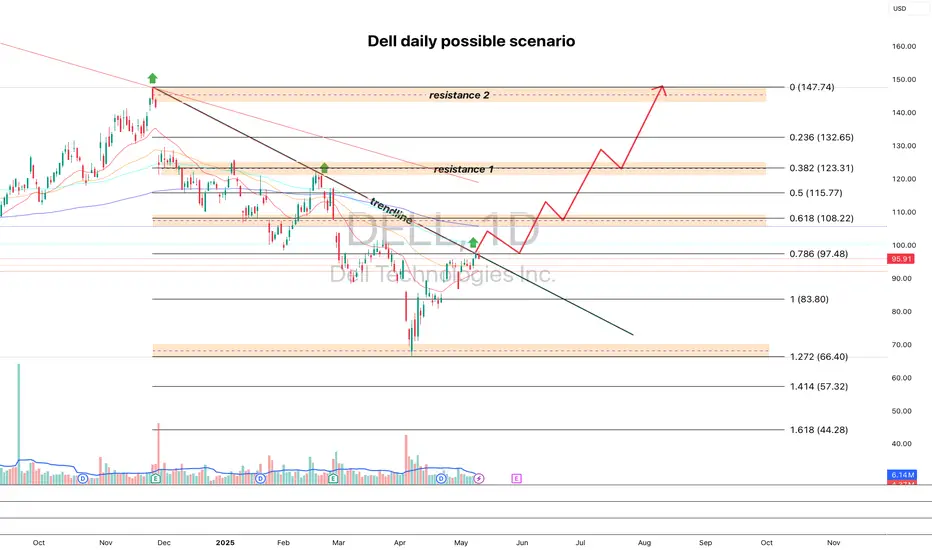
DELL looks good for pump dailyI'm watching DELL for a breakout of the trendline and a cross above the 100 MA — targeting a move toward 108.22, followed by a retest of the breakout and further upside targets at 123.31 and 147.74.
Fundamentally, the company looks strong, and the next earnings report is expected on May 29.
If you like the analysis, hit that rocket 🚀
Is AMD Poised to Redefine the Future of AI and Computing?Advanced Micro Devices (AMD) is rapidly transforming its market position, recently converting a Wall Street skeptic, Melius Research, into a bullish advocate. Analyst Ben Reitzes upgraded AMD stock to "buy" from "hold," significantly raising the price target to \$175 from \$110, citing the company's substantial progress in artificial intelligence (AI) chips and computing systems. This optimistic outlook is fueled by a confluence of factors, including surging demand from hyperscale cloud providers and sovereign entities, alongside colossal revenue opportunities in AI inferencing workloads. Another upgrade from CFRA to "strong buy" further underscores this shifting perception, highlighting AMD's new product launches and an expanding customer base, including key players like Oracle and OpenAI, for its accelerator technology and the maturing ROCm software stack.
AMD's advancements in the AI accelerator market are particularly noteworthy. The company's MI300 series, including the MI300X with its industry-leading 192GB HBM3 memory, and the newly unveiled MI350 series, are designed to deliver significant price and performance advantages over rivals like Nvidia's H100. At its "Advancing AI 2025" event on June 12, AMD not only showcased the MI350's potential for up to 38x improvement in energy efficiency for AI training but also previewed "Helios" full-rack AI systems. These comprehensive, plug-and-play solutions, leveraging future MI400 series GPUs and Zen 6-based EPYC "Venice" CPUs, position AMD to directly compete for the lucrative business of hyperscale operators. As AI inference workloads are projected to consume 58% of AI budgets, AMD's focus on efficient, scalable AI platforms puts it in a prime position to capture a growing share of the rapidly expanding AI data center market.
Beyond AI, AMD is pushing the boundaries of traditional computing with its upcoming Zen 6 Ryzen CPUs, reportedly targeting "insane" clock speeds, well above 6 GHz, with some leaks suggesting peaks of 6.4-6.5 GHz. Built on TSMC's advanced 2nm lithography node, the Zen 6 architecture, developed by the same team behind the successful Zen 4, promises significant architectural improvements and a substantial increase in performance per clock. While these are leaked targets, the combination of AMD's proven design capabilities and TSMC's cutting-edge process technology makes these ambitious clock speeds appear highly achievable. This aggressive strategy aims to deliver compelling performance gains for PC enthusiasts and enterprise users, further solidifying AMD's competitive stance against Intel's forthcoming Nova Lake CPUs, which are also expected around 2026 and feature a modular design and up to 52 cores.

In the 2030's The Nasdaq 100 to 2X the Dow Jones.#CupandHandle don't fight the trend.
Technology vs Industrials.
AI
Robotics
Space Economy
Biotech
Artificial Super Intelligence to power GDP to insane levels.

AMD Major Lower Highs/ 1W MA50 break-out.It was only 9 days ago (June 16, see chart below) when we called for a potential bullish break-out on Advanced Micro Devices (AMD) above the 1W MA50 (blue trend-line):
The break-out did happen, this 1W candle is already considerably above its 1W MA50 and based also on the level the 1W RSI is at right now, it may resemble more the March 13 2023 1W candle instead of the January 30 2023 as previously thought.
The reason is the major break-out of the All Time High (ATH) Lower Highs trend-line that came along with the 1W MA50. As you can see, it was on the March 13 2023 1W candle that AMD broke above that trend-line with the 1W RSI being on the same level (66.00) as today.
This candle formed a short-term Top, with the price initiating a 1.5 month pull-back that re-tested the 1W MA50 as Support and then moved on to complete the +143.12% Bullish Leg from the Channel Up bottom.
As a result, we can't rule out the first wave of short-term profit taking by next week. But a potential 1W MA50 test, will be another long-term buy entry in our view. Our $185.00 Target remains intact.
-------------------------------------------------------------------------------
** Please LIKE 👍, FOLLOW ✅, SHARE 🙌 and COMMENT ✍ if you enjoy this idea! Also share your ideas and charts in the comments section below! This is best way to keep it relevant, support us, keep the content here free and allow the idea to reach as many people as possible. **
-------------------------------------------------------------------------------
💸💸💸💸💸💸
👇 👇 👇 👇 👇 👇

Why Is CrowdStrike's Stock Soaring Amidst Cyber Chaos?The digital landscape is increasingly fraught with sophisticated cyber threats, transforming cybersecurity from a mere IT expense into an indispensable business imperative. With global cybercrime costs projected to reach $10.5 trillion annually by 2025, organizations face severe financial penalties, operational disruptions, and reputational damage from data breaches and ransomware attacks. This escalating threat environment has created an urgent and inelastic demand for robust digital defenses, positioning leading cybersecurity firms like CrowdStrike as critical enablers of economic stability and growth.
CrowdStrike's remarkable ascent is directly tied to this surging demand, fueled by pervasive trends such as widespread digital transformation, extensive cloud adoption, and the proliferation of hybrid work models. These shifts have vastly expanded attack surfaces, necessitating comprehensive, cloud-native security solutions that can protect diverse endpoints and cloud workloads. Organizations are increasingly prioritizing cyber resilience, seeking integrated platforms that offer proactive detection and rapid response capabilities. CrowdStrike's Falcon platform, with its AI-native, single-agent architecture, effectively addresses these needs, providing real-time threat intelligence and enabling seamless expansion across various security modules, which drives high customer retention and significant upsell opportunities.
The company's strong financial performance underscores its market leadership and operational efficiency. CrowdStrike consistently reports impressive Annual Recurring Revenue (ARR) growth, healthy non-GAAP operating margins, and robust free cash flow generation, demonstrating a sustainable and profitable business model. This financial strength, combined with its continuous innovation and strategic partnerships, positions CrowdStrike for sustained long-term growth. As enterprises seek to consolidate security vendors and simplify complex operations, CrowdStrike's comprehensive platform is ideally situated to capture a larger share of global cybersecurity spending, solidifying its role as a cornerstone of the digital economy and a compelling investment in a high-stakes environment.

SOXL 1D — With a base like this, the ride’s worth itOn the daily chart of SOXL, since early March, a textbook inverse head and shoulders pattern has formed and is now in its activation phase. The left shoulder sits at $16.67, the head at $7.21, and the right shoulder at $15.11. The symmetry is classic, with volume stabilization and a narrowing range — all the elements are in place.
The key moment was the breakout through the descending daily trendline around $19.00. Price didn’t just pierce the level — it held above it, signaling a phase shift. There was an attempt to break through the 0.5 Fibonacci level at $19.60, which led to a pullback — not on heavy selling, but on decreasing volume. This wasn’t a rejection, it was a pause.
This pullback serves as a retest of the breakout zone and the 20-day moving average. The overall structure remains bullish: price stays above all key EMAs and MAs, RSI climbs past 60, and the candlestick structure is stable. Volume rises during up moves and fades during pullbacks — classic signs of reaccumulation.
The measured target from the pattern is $32.00, calculated from the head-to-neckline height projected from the breakout point. As long as price holds above $18.40, the setup remains intact. A break above $19.60 with confirmation would open the door to acceleration.
This isn’t a momentum play — it’s a setup months in the making. The structure is there, the confirmation is there, and most importantly — the price behavior makes sense. With a base like this, the ride ahead looks worth taking.

Can Geopolitics Power Tech's Ascent?The Nasdaq index recently experienced a significant surge, driven largely by an unexpected de-escalation of tensions between Israel and Iran. Following a weekend where U.S. forces reportedly attacked Iranian nuclear sites, investors braced for a volatile Monday. However, Iran's measured response - a missile strike on a U.S. base in Qatar, notably without casualties or significant damage - signaled a clear intent to avoid wider conflict. This pivotal moment culminated in President Trump's announcement of a "Complete and Total CEASEFIRE" on Truth Social, which immediately sent U.S. stock futures, including the Nasdaq, soaring. This rapid shift from geopolitical brinkmanship to a declared truce fundamentally altered risk perceptions, alleviating immediate concerns that had weighed on global markets.
This geopolitical calm proved particularly beneficial for the Nasdaq, an index heavily weighted towards technology and growth stocks. These companies, often characterized by global supply chains and reliance on stable international markets, thrive in environments of reduced uncertainty. Unlike sectors tied to commodity prices, tech firms derive their value from innovation, data, and software assets, which are less susceptible to direct geopolitical disruptions when tensions ease. The perceived de-escalation of conflict not only boosted investor confidence in these growth-oriented companies but also potentially reduced pressure on the Federal Reserve regarding future monetary policy, a factor that profoundly impacts the borrowing costs and valuations of high-growth technology firms.
Beyond the immediate geopolitical relief, other crucial factors are shaping the market's trajectory. Federal Reserve Chair Jerome Powell's upcoming testimony before the House Financial Services Committee, where he will discuss monetary policy, remains a key focus. Investors are closely scrutinizing his remarks for any indications regarding future interest rate adjustments, particularly given current expectations for potential rate cuts in 2025. Additionally, significant corporate earnings reports from major companies like Carnival Corporation (CCL), FedEx (FDX), and BlackBerry (BB) are due. These reports will offer vital insights into various sectors' health, providing a more granular understanding of consumer spending, global logistics, and software security, thereby influencing overall market sentiment and the Nasdaq's continued performance.

Who Silently Powers the AI Revolution?While the spotlight often shines on AI giants like Nvidia and OpenAI, a less-publicized but equally critical player, CoreWeave, is rapidly emerging as a foundational force in the artificial intelligence landscape. This specialized AI cloud computing provider is not just participating in the AI boom; it is building the essential infrastructure that underpins it. CoreWeave's unique model allows companies to "rent" high-performance Graphics Processing Units (GPUs) from its dedicated cloud, democratizing access to the immense computational power required for advanced AI development. This strategic approach has positioned CoreWeave for substantial growth, evidenced by its impressive 420% year-over-year revenue growth in Q1 2025 and a burgeoning backlog of over $25 billion in remaining performance obligations.
CoreWeave's pivotal role became even clearer with the recent partnership between Google Cloud and OpenAI. Though seemingly a win for the tech titans, CoreWeave is supplying the critical compute power that Google then resells to OpenAI. This crucial, indirect involvement places CoreWeave at the nexus of the AI revolution's most significant collaborations, validating its business model and its capacity to meet the demanding computational needs of leading AI innovators. Beyond merely providing raw compute, CoreWeave is also innovating in the software space. Following its acquisition of AI developer platform Weights & Biases in May 2025, CoreWeave has launched new AI cloud software products designed to streamline AI development, deployment, and iteration, further cementing its position as a comprehensive AI ecosystem provider.
Despite its rapid stock appreciation and some analyst concerns about valuation, CoreWeave's core fundamentals remain robust. Its deep partnership with Nvidia, including Nvidia's equity stake and CoreWeave's early adoption of Nvidia's cutting-edge Blackwell architecture, ensures access to the most sought-after GPUs. While currently in a heavy investment phase, these expenditures directly fuel its capacity expansion to meet an insatiable demand. As AI continues its relentless advancement, the need for specialized, high-performance computing infrastructure will only intensify. CoreWeave, by strategically positioning itself as the "AI Hyperscaler," is not just witnessing this revolution; it is actively enabling it.

APPLE Big circle building editionSmart phones, some of them look pretty nice tbh.
However, something I read recently about cloud storage really interested me with apple.
Among other things obviously, like big stacks of cash.
Apple has a lot of money essentially.
Apple has a lot of talented people.
SF real estate is scary.
TA and chart description.
basically, we are under a short term trend break and have a lot of indicators pushing a top with a drastic overextension, so you might expect a possible rebound from all of that in alignment. Which you can then notice the gap at 154, and see how it can close that gap and essentially climb in a stable path to nearly 400 after creating some massive support at the 263 mark.
Excited to see how this one moves in price, Excited to see what apple comes out with in the future.
Good luck trading.
Guideline is to show the idea, try not to follow it, instead focus on the price targets and trends.

What Fuels Cisco's Quiet AI Domination?Cisco Systems, a long-standing titan in networking infrastructure, is experiencing a significant resurgence, largely driven by a pragmatic and highly effective approach to artificial intelligence. Unlike many enterprises chasing broad AI initiatives, Cisco focuses on solving "boring" yet critical customer experience problems. This strategy yields tangible benefits, including substantial reductions in support cases and significant time savings for customer success teams, ultimately freeing resources to address more complex challenges and enhance sales processes. This practical application of AI, coupled with a focus on resiliency, simplicity through unified interfaces, and personalized customer journeys, underpins Cisco's strengthening market position.
The company's strategic evolution also involves a nuanced embrace of Agentic AI, viewing it not as a replacement for human intellect but as a powerful augmentation. This shift from AI as a mere "tool" to a "teammate" enables proactive problem detection and resolution, often before customers even recognize an issue. Beyond internal efficiencies, Cisco's growth is further fueled by shrewd strategic investments and acquisitions, such as the integration of Isovalent's eBPF technology. This acquisition has rapidly enhanced Cisco's offerings in cloud-native networking, security, and load balancing, demonstrating its agility and commitment to staying at the forefront of technological innovation.
Cisco's robust financial performance and strategic partnerships, particularly with AI leaders like Nvidia and Microsoft, underscore its market momentum. The company reports impressive growth in product revenues, especially in its Security and Observability segments, signaling a successful transition toward a more predictable, software-driven revenue model. This strong performance, combined with a clear vision for AI-driven customer experience and strategic collaborations, positions Cisco as a formidable force in the evolving technology landscape. The company's disciplined approach offers valuable lessons for any organization seeking to harness the transformative power of AI effectively.

Is Digital LiDAR the Eye of Autonomy's Future?Ouster, Inc. (NYSE: OUST), a key player in the small-cap technology landscape, recently experienced a significant boost in its share price following a crucial endorsement from the United States Department of Defense (DoD). This approval of Ouster's OS1 digital LiDAR sensor for unmanned aerial systems (UAS) validates the company's technology. It highlights the growing importance of advanced 3D vision solutions in both defense and commercial sectors. Ouster positions itself as a foundational enabler of autonomy, with its digital LiDAR distinguishing itself through enhanced affordability, reliability, and resolution compared to traditional analog systems.
The DoD's inclusion of the OS1 sensor within its Blue UAS Framework represents a strategic victory for Ouster. This rigorous vetting process ensures supply chain integrity and operational suitability, making the OS1 the first high-resolution 3D LiDAR sensor to receive such an endorsement. This approval significantly streamlines procurement for various DoD entities, promising expanded adoption beyond Ouster's existing defense engagements. The OS1's superior performance in weight, power efficiency, and rugged conditions further underscores its value in demanding applications.
Looking ahead, Ouster actively develops its next-generation Digital Flash (DF) Series, a solid-state LiDAR solution poised to revolutionize automotive and industrial applications. By eliminating moving parts, the DF series promises enhanced reliability, longevity, and cost-efficient mass production, addressing critical needs for autonomous driving and advanced driver-assistance systems (ADAS). This forward-looking innovation, combined with the recent DoD validation, firmly establishes Ouster as a pivotal innovator in the rapidly evolving landscape of autonomous technologies, driving its ambition to capture a substantial share of the $70 billion total addressable market for 3D vision.

Why QuickLogic? Unpacking its Semiconductor Surge.QuickLogic Corporation, a vital developer of embedded FPGA (eFPGA) technology, currently navigates a rapidly evolving semiconductor landscape marked by intense technological innovation and shifting geopolitical priorities. Its recent inclusion in the Intel Foundry Chiplet Alliance signals a pivotal moment, affirming QuickLogic's expanding influence in both defense and high-volume commercial markets. This strategic collaboration, combined with QuickLogic’s advanced technological offerings, positions the company for significant growth as global requirements for secure and adaptable silicon intensify.
Critical geopolitical imperatives and a profound shift in semiconductor technology fundamentally drive the company's ascent. Nations are increasingly prioritizing robust, secure, and domestically sourced semiconductor supply chains, particularly for sensitive aerospace, defense, and government applications. Intel Foundry's efforts, including the Chiplet Alliance, directly support these strategic demands by cultivating a secure, standards-based ecosystem within the U.S. QuickLogic’s alignment with this initiative enhances its status as a trusted domestic supplier, expanding its reach within markets that value security and reliability above all else.
Technologically, the industry's embrace of chiplet-based architectures plays directly into QuickLogic’s strengths. As traditional monolithic scaling faces mounting challenges, the modular chiplet approach gains traction, allowing for the integration of separately manufactured functional blocks. QuickLogic's eFPGA technology provides configurable logic, perfectly suited for seamless integration within these multi-chip packages. Its proprietary Australis™ IP Generator rapidly develops eFPGA Hard IP for advanced nodes like Intel’s 18A, optimizing power, performance, and area. Beyond defense, QuickLogic's eFPGA integrates into platforms like Faraday Technology's FlashKit™-22RRAM SoC, offering unparalleled flexibility for IoT and edge AI applications by enabling post-silicon hardware customization and extending product lifecycles.
Membership in the Intel Foundry Chiplet Alliance offers QuickLogic tangible advantages, including early access to Intel Foundry's advanced processes and packaging, reduced prototyping costs through multi-project-wafer shuttles, and participation in defining interoperable standards via the UCIe standard. This strategic positioning solidifies QuickLogic’s competitive edge in the advanced semiconductor manufacturing landscape. Its consistent innovation and robust strategic alliances underscore the company’s strong future trajectory in a world hungry for adaptable and secure silicon solutions.

TSLA: Uptrend channel bounce, trading between 50 and 200-day SMAHey guys/gals!
So we all know that Tesla took a massive drop last week. It fell about 14%, and was down even 3% after hours at one point. I think we can all agree this crash wasn't technicals driven - it was clearly headline impacted. This was a clear black swan even t, and even in my case, nothing like this has ever happened to me as a trader. It was unforeseeable, forced me to hedge overnight and I'm still having nightmares (lol). Definitely one to remember as I don't think something like this would happen with any other stock. Tesla is truly unique in this sense.
But looking at the bigger picture, the bounce that we experienced on Friday must've been technicals driven, and psychologically influenced, as I am almost certain that the crash was a massive overreaction. People woke up the next day and thought this was severely discounted over a couple social media tweets (I won't go into the politics of things).
As you see on the chart, Tesla may in a new upward channel. At first I figured this may be a bear flag, however due to the upcoming catalyst like the Robotaxi launch - this would likely only be a bear flag if prices crashes below the lower support trend line.
As long as price is within the channel, I'd say things are holding up. We'd likely see a jump towards the upper side of the channel - however it's important to note that $300 and £360 are major resistance points. Robotaxi launch and any future tweets will definitely move price, and I think those will be a factor in determining whether price goes up or crashes below the trend line.
Another thing to point out is that price is currently trading between the 50-day and 200-day moving averages. The 50-day SMA is acting as vital support, whereas the 200-day SMA is the resistance. If there is a break above the 200-day SMA, price will likely go higher. The opposite may happen if price crashes below the 50-day SMA.
Either way, headlines and technicals mentioned above will continue to influence price.
Note: not financial advice.

TSLA: Continues to form a Cup and Handle reversal patternHey folks,
Just a quick analysis of NASDAQ:TSLA on the daily chart. Compared to my last analysis, price has fallen a bit since, as a new flag (handle) continues to form following a cup pattern.
- Cup and Handle pattern forming. The handle would also count as a bull flag. This is known as
a cup and handle reversal pattern, after a downtrend. So yes, it is possible for a stock to
reverse its trend through the formation of a cup and handle reversal pattern (as you can see
in the chart).
- Major resistance at $366 which marks the peak of the flag (handle) pattern. This would have
to be broken in order for the cup and handle to be valid.
- Volume has also been decreasing during the formation of this pattern: this is typical amongst
Cup and Handle patterns, and generally a positive sign.
Note: Not financial advice.

Is C3.ai the Quiet Giant of Enterprise AI?C3.ai (AI), an enterprise artificial intelligence software provider, has operated somewhat under the radar despite its foundational role in delivering advanced AI solutions to large organizations. While the broader AI market has seen significant attention on hardware innovators, C3.ai has steadily scaled its platform usage and secured marquee contracts. The company's core strength lies in its sophisticated, patented C3 Agentic AI platform, developed through a multi-billion-dollar investment, which effectively tackles critical business challenges such as AI hallucinations, data security, and multi-format data integration.
A pivotal development underscoring C3.ai's growing influence is the expanded contract with the U.S. Air Force Rapid Sustainment Office (RSO). This agreement significantly increased its ceiling to $450 million through 2029, supporting the widespread deployment of C3.ai's PANDA predictive maintenance platform across the Air Force fleet. This substantial commitment not only provides a robust, long-term revenue stream but also serves as a powerful validation of C3.ai's technology at an unprecedented scale, potentially representing the largest production AI deployment within the U.S. Department of Defense.
Financially, C3.ai demonstrates compelling momentum. The company recently reported record Q4 earnings, with revenue reaching $108.7 million, a 26% year-over-year increase, driven by strong growth in both subscription and engineering services. Strategic alliances with industry giants like Baker Hughes, Microsoft Azure, and Amazon Web Services continue to accelerate new deal flow and expand market access, shortening sales cycles and enhancing overall reach. While profitability remains a near-term focus, C3.ai's solid liquidity and projected revenue growth of 15%-25% for fiscal 2026, coupled with an average analyst price target suggesting significant upside, position it for a compelling ascent in the enterprise AI landscape.

NVIDIA 1D — When “Head & Shoulders” Aren’t Just for the GymOn the daily chart, NVDA has broken out of the descending channel and reclaimed the 50-day moving average (MA50), triggering a classic inverted head and shoulders formation. Price is now holding above the key $113–$114.50 zone, confirming a structural shift. As volume picks up, buyers are eyeing the next levels of resistance.
Near-term upside targets: – $119.80 (0.5 Fibonacci) – $127.62 (0.382) – $137.28 (0.236) — primary resistance zone – Extended target — $152.91 (1.0 Fibonacci projection)
Technical setup: — Breakout from channel + above MA50
— Inverted head and shoulders pattern completed
— $114.50–$118.00 now acts as buyer support
— EMA and MA convergence supports trend reversal
— Increasing volume on rallies supports bullish momentum
Fundamentals: NVIDIA remains the AI and semiconductor sector leader. Growing demand for high-performance GPUs in AI and data centers positions NVDA as a core tech play. Expectations of strong earnings and continued institutional accumulation support the bullish narrative.
The confirmed breakout and inverted H&S setup mark a clear structural reversal. As long as price stays above $114.50, the path toward $127–$137 remains the primary target zone, with $152.91 in sight if momentum continues.

What Fuels Microsoft's Unstoppable Rise?Microsoft Corporation consistently demonstrates its market leadership, evidenced by its substantial valuation and strategic maneuvers in the artificial intelligence sector. The company's proactive approach to AI, particularly through its Azure cloud platform, positions it as a central hub for innovation. Azure now hosts a diverse array of leading AI models, including xAI’s Grok, alongside offerings from OpenAI and other industry players. This inclusive strategy, driven by CEO Satya Nadella's vision, aims to establish Azure as the definitive platform for emerging AI technologies, offering robust Service Level Agreements and direct billing for hosted models.
Microsoft's AI integration extends deeply into its product ecosystem, significantly enhancing enterprise productivity and developer capabilities. GitHub's new AI coding agent streamlines software development by automating routine tasks, allowing programmers to focus on complex challenges. Furthermore, Microsoft Dataverse is evolving into a powerful, secure platform for AI agents, leveraging features like prompt columns and the Model Context Protocol (MCP) server to transform structured data into dynamic, queryable knowledge. The seamless integration of Dynamics 365 data within Microsoft 365 Copilot further unifies business intelligence, enabling users to access comprehensive insights without switching contexts.
Beyond its core software offerings, Microsoft's Azure cloud provides critical infrastructure for transformative projects in highly regulated sectors. The UK's Met Office, for instance, successfully transitioned its supercomputing operations to Azure, improving weather forecasting accuracy and advancing climate research. Similarly, Finnish startup Gosta Labs utilizes Azure's secure and compliant environment to develop AI solutions that automate patient record-keeping, significantly reducing administrative burdens in healthcare. These strategic partnerships and technological advancements underscore Microsoft's foundational role in driving innovation across diverse industries, cementing its position as a dominant force in the global technology landscape.

zSpace (IPO) NEW LISTINGA tech company called zSpace priced very low inline with the types of people that like to buy low cost stock, i.e. cryptocurrency investors. As for what the company does and if the company will succeed, only time will tell.
