Frontkn Simple Chart AnalysisHow to view the guidance via chart ( Refer back to pin message guidance if to trade )
Red Line = Support
Blue Line = Resistance
Light Blue = bullish/bearish pattern
Arrow = Double/Trip top/bottom
Red Chip = $$
Green Chip = XX
Technology

MI Simple Chart AnalysisHow to view the guidance via chart ( Refer back to pin message guidance if to trade )
Red Line = Support
Blue Line = Resistance
Light Blue = bullish/bearish pattern
Arrow = Double/Trip top/bottom
Red Chip = $$
Green Chip = XX

Technology Index Simple Chart AnalysisTechnology index - More or less, we need to respect the main klse tech index also. If this area break, tech sector will continue its run. That's the reason I take profit most of my tech sector today & wait for another round.
Prove of selling source that I am earning Rm200k = USD45k can visit my link in my signature.

Winners and Losers in NASDAQ's November RallyIts been a poor year for American equity markets, and this is especially true for the tech-heavy NASDAQ exchange. For most of 2022, NASDAQ has been down double-digits, featuring a November 3rd bottom where the exchange was trading down nearly 40% YTD. That said, there has been some relief for tech watchers over the course of November as indications begin to emerge that the macroeconomic climate is shifting in a slightly more optimistic direction. Last week, Jerome Powell indicated a slowdown in rate hikes, with the next bump up to be 50 as opposed to 75 base points. A stabilization of the fluid situation in China, as well as initial signals that inflation is cooling down all contributed to a modest comeback for NASDAQ in recent weeks.
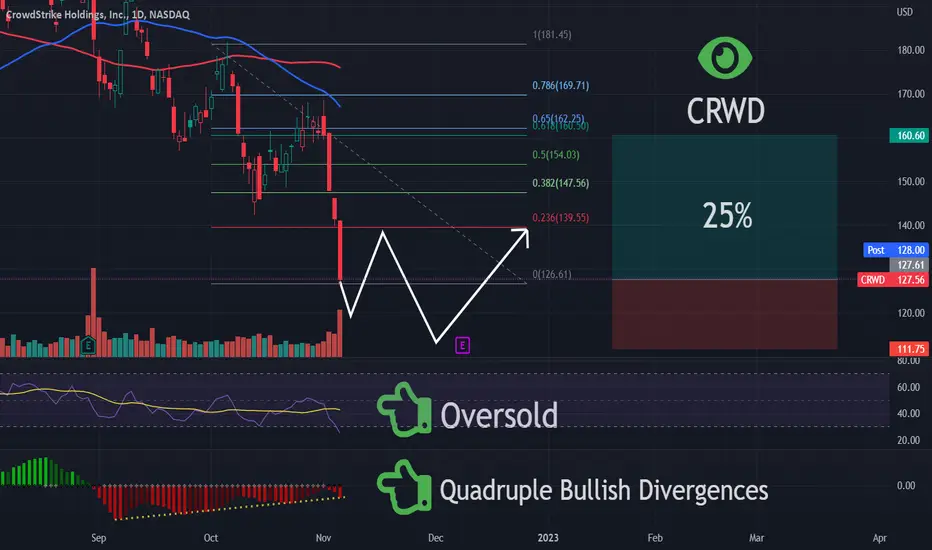
Directing our attention to the chart, I've taken a few of my blue chip tech holdings and measured their performance against the broader market trend. The big picture is that most of the companies are in the green over the past month--IBM, which was +8%, led the charge as this darling US computing stock continues a mult-month uptrend. The LVP of November was CRWD, which shed ~20% of its SP on November 30th following disappointing Q3 financials.
Mid-range gainers include RDWR (+5%), CHKP (+4%), INTC (+3%), and HUB.TA (+2%). One factor I cite as contributing to these gains is the US current prioritization of subsidizing the computing/cyber industry while it works to secure global supply lines and manufacturing hubs. US chip and cyber players, after a significant bout of Q2 volatility, are regaining their footing and beginning to witness gains. Another dark horse to keep an eye on is HUB.TA, which is in the final stages of a SPAC listing (RNER) for a likely Q1 '23 NASDAQ listing and simultaneous TASE delisting. Though I'm not holding onto much these days, PANW also had a very bullish November and is trading up some 15% from its YTD bottom on November 3rd.
In sum, despite the overall gloomy mood most equity investors have been in recently, there are still abundant opportunities for gains in the current NASDAQ/tech rally. Though I think we're yet to yet the bottom (eyes on Q1/2 '23), there are still bullish plays for the discerning trader. DYOR, this is not financial advice.

The Santa Rally Continues - Don't get stuck in Perma-Bear modeFar too many people got burned over the past 24 hours by betting the FARM on the Fed coming out Hawkish.
I was chatting with a guy on Twitter last week about his call for a deep selling phase (possibly reaching COVID lows) in the US markets. His followers got burned by today's move (some really badly).
You have to shift with the market trends and prepare for the unexpected.
My research kept my followers away from risks and has been pointing towards a Wave-5 rally setting up in the US markets for many months.
I use my Custom Indexes to get a better "feel" for how the markets are reacting to various inputs/outcomes.
My Rotational Modeling system has been cautious for more than 14+ months - off only -6% for 2022. Many other Hedge funds are off by at much as -40% to -60%.
Days like today, if you were lucky enough to survive them, will teach you a few lessons...
Don't get married to a trend
Protect capital at all times
READ THE DATA - not the emotions
Price can fool you - so protect your position.
Follow my research.. Or, at least, check out my content before you decide to place your trade.
Check out my SPY Cycle Pattern posts. Ask questions if you have them.
This move isn't over yet.

Oracle Corp (ORCL) bearish scenario:The technical figure Rising Wedge can be found in the daily chart of the US company Oracle Corp (ORCL). Oracle Corporation is an American multinational computer technology corporation. The company sells database software and technology (particularly its own brands), cloud engineered systems, and enterprise software products, such as enterprise resource planning (ERP) software, human capital management (HCM) software, customer relationship management (CRM) software (also known as customer experience), enterprise performance management (EPM) software, and supply chain management (SCM) software. The Rising Wedge broke through the support line on 29/11/2022. If the price holds below this level, you can have a possible bearish price movement with a forecast for the next 10 days towards 77.63 USD. Your stop-loss order, according to experts, should be placed at 83.48 USD if you decide to enter this position.
Oracle is expected to post earnings of $1.17 per share for the current quarter, representing a year-over-year change of -3.3%.
The consensus earnings estimate of $4.96 for the current fiscal year indicates a year-over-year change of +1.2%. This estimate has changed -0.4% over the last 30 days.
For the next fiscal year, the consensus earnings estimate of $5.55 indicates a change of +11.8% from what Oracle is expected to report a year ago. Over the past month, the estimate has changed -0.2%.
Risk Disclosure: Trading Foreign Exchange (Forex) and Contracts of Difference (CFD's) carries a high level of risk. By registering and signing up, any client affirms their understanding of their own personal accountability for all transactions performed within their account and recognizes the risks associated with trading on such markets and on such sites. Furthermore, one understands that the company carries zero influence over transactions, markets, and trading signals, therefore, cannot be held liable nor guarantee any profits or losses.

BLND | Good Entry Point | LONGBlend Labs, Inc. provides cloud-based software platform solutions for financial services firms in the United States. It operates in two segments, Blend Platform and Title365. The company offers a suite of white-label products for mortgages, home equity loans and lines of credit, vehicle loans, personal loans, credit cards, and deposit accounts. It also provides a suite of mortgage products that facilitates homeownership journey for consumers comprising close, income verification for mortgage, homeowners insurance, and realty. In addition, the company offers title search procedures for title insurance policies, escrow, and other closing and settlement services, as well as other trustee services; and professional and consulting services. It serves banks, credit unions, financial technology companies, and non-bank mortgage lenders. Blend Labs, Inc. was incorporated in 2012 and is headquartered in San Francisco, California.

Nasdaq 100 will keep falling. Here are some key levels to trade!The chart shows my macro plan on the Nasdaq. I believe with fed rate hikes today we will start again another decent lower in the markets. The Nasdaq has great potential to see a nice relief bounce off of the Golden Pocket noted on the chart. This small rally will most likely be stopped in its tracks at the descending trendline (if it even gets that far). After a solid rejection at the trendline the Nasdaq will head lower into the .786 fib retracement and into a major uptrend support line. If this line holds and the fed has stopped hiking rates it is very possible that the Nasdaq could breakout of the descending parallel channel.

semiconductors daily bounce or continued downsidewe are at the low end of top anchored vwap. if we get over this pivot and support meaningfully we could see a test of sss moving average or signal around upper horizontal and gap close. if we remain beneath and resist with sss signal and qqe staying red id look for that lower horizontal.

We need energy storage…and companies are respondingRecently, the following headline caught my eye:
‘Tesla Supplier Panasonic Plans Additional $4 Billion EV Plant in U.S.’ 1
Even in an environment with significant inflation, and a monetary policy that may continue raising rates for some time, significant capital expenditure continues within the battery space.
Panasonic is particularly notable because, in July 2022, it announced a plan to build a roughly $4 billion plant in Kansas. Now, it is announcing another plan for a roughly $4 billion plant in Oklahoma2.
The concept of securing certain supply chains globally has been a major theme in 2022, even if it’s been obscured by inflation, US Federal Reserve activities or the possibility of a recession. Semiconductors have been a big focus on that list, but so have the batteries that support the ongoing adoption of electric vehicles.
Geopolitics are always in the background of these supply chain considerations. While Panasonic (Japan) and LG Energy Solution Ltd. (South Korea) have made announcements in 2022 about plans to build plants directly in the US, Contemporary Amperex Technology Co. (CATL)—China’s top electric vehicle (EV) battery maker—has not been able to do the same. There was a plan in place, but US-China tensions have recently intensified, leading to postponement3.
Whilst drafting this blog, another headline appeared:
‘Honda, LG Energy Plan $4.4 Billion EV Battery Factory in U.S4.’
It’s certainly an area in focus.
Where is EV adoption in the US currently?
For the full US market, roughly 6% of new vehicles are electric. In California, this number was 16% in the second quarter of 20225.
There is an interesting contrast between California and other states in the US. The European Union (EU) announced that new cars must be free from emissions after 20356. Many of the individual countries had already made similar plans. Norway’s government has a plan to not sell any new petrol or diesel cars from 2025 onwards, and 70% of new cars sold in Norway in 2020 were electric7.
The individual states across the US, on the other hand, have not signalled commitments anywhere close to this, at least not yet…with the exception of (you guessed it), California!
New regulations applying to new cars, pickup trucks and SUVs would establish annual thresholds for the share of zero-emissions vehicles automakers must sell in the state each year8.
35% in 2026
68% in 2030
100% in 2035
The Clean Air Act of 1970 granted California a waiver to set its own environmental rules, and this allows for stricter standards than other states across the US. Other states can adopt California’s rules. For those following politics9:
The Trump Administration in 2019 stripped California of its waiver. Some companies still voluntarily sought to meet California’s stricter standards, but there was a division.
The Biden Administration then gave California back its waiver in March 2022, which allowed for these new rules.
Depending on the path of US politics, we’ll have to see how the story continues to evolve but, with each passing year, it is doubtful that politicians would be able to fully stop the trend of EV adoption. Maybe it would slow and certain states would hold out, but even the automakers themselves are noting a desire to go fully electric in their production within the coming decades.
Hydrogen?
One thing we know about hydrogen is that the market loves to ‘hype’ this concept. Even though the full development of an infrastructure that would support use of hydrogen at scale will take years—possibly a lot of years—at the end of 2020 and start of 2021 many of the firms focused on hydrogen had sky-high valuations10. The market wanted to price these firms as though the potential had already been realised, so we know that returns have been much harder to come by in the space in most of 2021 and 2022 so far.
Plug Power is one such company and, on 25 August 2022, it agreed to provide 10,950 tonnes per year of liquid green hydrogen starting in 202511. ‘Green hydrogen’ refers to hydrogen that has been produced using renewable, carbon-emission-free energy. If Amazon wants to decarbonise its operations and use hydrogen to do it, it’s important that the production of the hydrogen isn’t simply moving the emission generation from Amazon’s operations toward Amazon’s energy suppliers. Amazon has committed to be net-zero in terms of carbon emissions by 2040.
As a rough guide, this amount of hydrogen that Plug Power would supply could power between 1,000 and 2,000 heavy duty trucks over the course of a year12. It is an area of active debate and development regarding the best way to decarbonise heavy-duty trucks:
Current lithium-ion battery technology could work, but batteries would be very heavy and the need to stop for charging could prove a challenge on longer-haul trips. Charging massive, semi-truck sized batteries could also take much longer than passenger cars.
Hydrogen offers interesting alternative benefits but, currently, the discussion should focus on the supply chain. First, the infrastructure of hydrogen fuelling stations needs to be build out, securing the supply of hydrogen on major routes. Second, the production of hydrogen needs to be green, or else all the companies trying to use hydrogen as part of net-zero emissions plans would have to look elsewhere.
Our take on hydrogen for the moment is one of reasonable optimism, recognising the benefits but, at the same time, not getting too excited too quickly.
Conclusion: countries want to be energy independent
Decades ago, the only way countries could be energy independent was to find massive deposits of oil. While we still use fossil fuels globally, energy independence in the coming decades will likely look quite different, and the countries that secure the best possible energy storage technologies could be in the best position as they deploy all sorts of renewable energy technologies to power their needs.
To this end, there are going to be a lot of advances in regulations, energy storage technologies and all the while capital expenditures to build out all sorts of infrastructure and production capability.
Sources
1 Source: Davis, River & Rebecca Elliott. “Tesla Supplier Panasonic Plans Additional $4 Billion EV Battery Plant in U.S.” Wall Street Journal. 26 August 2022.
2 Source: Davis, 26 August 2022.
3 Source: Davis, 26 August 2022.
4 Source: Davis, River & Dasl Yoon. “Honda, LG Energy Plan $4.4 Billion EV Battery Factory in U.S.” Wall Street Journal. 29 August 2022.
5 Source: Colias, Mike & Christine Mai-Duc. “California Approves Rules to Ban Gasoline-Powered Cars by 2035.” Wall Street Journal. 25 August 2022.
6 Source: eu-agrees-new-cars-must-be-emissions-free-after-2035
7 Source: statista -electric-and-hybrid-cars
8 Source: Colias, 25 August 2022.
9 Source: Colias, 25 August 2022.
10 Source: Bloomberg.
11 Source: Palumbo, Angela & Al Root. “Plug Power Stock Jumps on Hydrogen Supply Deal with Amazon.” Barron’s. 25 August 2022.
12 Source: Palumbo, 25 August 2022.

Recycling Batteries will be a Big Focus in the Energy TransitionThose of us following the markets in 2022 have tended to hear certain words again and again:
Supply chains
Energy shortage
Inflation
Renewable energy metals
We need energy. We want to transition from significant emissions of greenhouse gases towards more sustainable, climate-neutral sources of energy. It is difficult to foresee the demand for batteries dropping at any point in the near future.
But, there is a problem. Redwood Materials, a company that is focusing on battery recycling, articulates it very clearly in the title of Figure 1 and then in their infographic. The COVID-19 pandemic laid bare the fact that many things have built towards highly globalised supply chains. Batteries are a critical example, and securing supply is a topic that many regions are thinking about today.
A circular economy?
Intuitively, recycling battery metals makes a lot of sense. Instead of constantly sourcing more raw nickel, cobalt, lithium etc., it would be more efficient to make use of the existing stock of metals already in use in various physical products. The map in Figure 1 also makes another important point—the specific metals used in the manufacture of batteries are not evenly dispersed across the globe. Certain countries and regions have copious amounts, while others don’t have any.
It may be the case that we are early, and this is sometimes an issue in thematic equity investing. The concept and idea might be clear but getting the timing of the possible take-off can be tricky.
It is simple to picture the idea of electric vehicles (EVs) ending their useful lives and heading to the scrap yard, like any other vehicle. However, we are still early in terms of EV adoption, so we don’t have EVs at scale heading to the scrap yard at the end of their usable lives. That day will come, but not immediately.
This is important to understand, in that it tells us that the materials being recycled are not expected to be the actual batteries that were used for multiple years in an EV. Rather, the inputs into recycling will likely be scrap material from the increasing number of gigafactories coming online. This scrap could account for 78% of the pool of recyclable materials in 20251.
It is then estimated that in the mid 2030’s, end-of-life batteries will supersede scrap materials from factories, but extracting the valuable lithium, cobalt, nickel and other metals from existing end-of-life batteries will be a more involved process than processing scrap metals from factories2.
Geopolitics may offer a natural push towards recycling firms
In 2022, when one is trying to analyse the possible forward path of the relationship between certain countries (for example, US vs China) it is very difficult to know what might happen. China is the major processor of some of the most important battery metals (see Figure 2), which will likely be a major source of tension for Western countries. Based on what we can see today, we have to imagine that Western countries would prefer a greater independence of supply away from a dependence on China if that can be a reasonable possibility.
Conclusion: recent activities show companies making moves on this front
Ascend Elements is a start-up that is aiming to be an emerging centre of battery production in the Southeastern US. Jaguar Land Rover and SK Group have contributed, along with other investors, to put $300 million into the firm. It is seeking to commercialise an efficient method, termed ‘hydro-to-cathode’, to turn used lithium-ion batteries into new components. As of the recent funding, Ascend Elements is valued at $500 million3.
The Inflation Reduction Act is also notable, in that it focuses on defining how much battery material is coming from domestic production. ‘Domestic’ in this context means ‘inside the US.’ This creates an immediate incentive for recycling players to ramp up their production and operations in the US, as it would then connect electric-car tax credits for consumers back to batteries that are at least majority-sourced from inside the US4.
The primary risk in the space appears to be whether the recyclers can effectively achieve a scale of their operations to bring down unit costs and allow for strong financial performance before waves and waves of existing EV batteries start getting retired. Even if batteries from laptops and smartphones are recycled, it may not be enough material to scale operations and allow the companies to progress towards profitability5.
WisdomTree believes in the importance of the global energy transition, of which battery recycling is certainly a part that can grow over time. Diversification across the supply chain may mitigate the risk of being a bit early to certain parts of the picture.

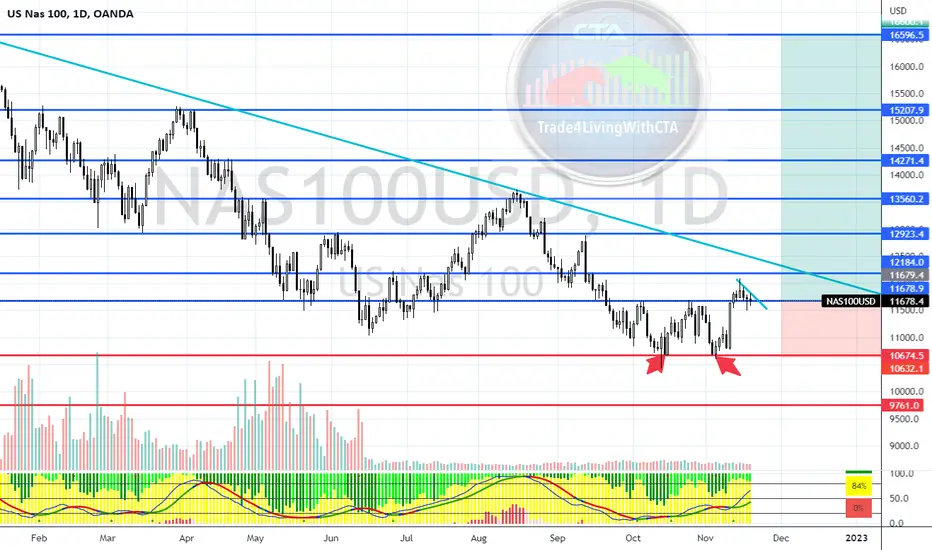
Anatomy of a NASDAQ interim topAn interesting set of events just occurred in the NASDAQ futures. In early November, the NASDAQ (and most market indices) spiked in a bullish rally, only to find a resistance at about 12,000 in mid-November. It then retraced to test the support at 11,560. While it bounced off the support then, there was a momentary spike down to 11,528. This is the significant low for this consolidation range at the top of the short term rally. The bounce brought it to 11830, where a resistance level was failed. This was then followed by a revisit to the consolidation range support (bottom of yellow box).
About an hour ago, a lower low was triggered (red support line) and currently the NASDAQ futures is struggling to keep above the consolidation zone support.
Technical indicators MACD and VolDiv are slightly bearish, boding a more likely breakdown. MACD crossed under, and remains under the zeroline. VolDiv is not uptrending, but below its SMA, and looking for a breakdown below zero line.
Also noted is the green "BD" where it denotes a Break Down of an auto-plotted trendline support.
The price action is a little long to the downside, and has been support hugging. It is likely to have some sort of a rebound, but what happens next depends on whether there is more juice to sustain. A technical rebound is due and appears to be forming up at time of writing. Definitely, is there enough juice to get this to the upper part of the range?
The other thing here is that a decisive breakdown out of the consolidation range is needed and appears to be lining up for the later part of the week. This is invalidated IF a technical rally closes above 11850.
Wait for it...

Cyber Security Players Under- and Outperforming $QQQAs we all know, its been a particularly volatile year for NASDAQ and tech equities across the board. At its lowest YTD (on 11.3), QQQ was down nearly 35%. A 7% intraday rally picked NASDAQ up from its bottom, but the trend is clear: with rising inflation, shrinking consumer savings, and broader downturns in the global macroeconomic environment, investors are losing their appetite for risker tech plays. Despite the gloom and doom that has fallen over many over course of what is one of US equity markets worst years on record, cyber security is one industry that has remained competitive, largely in response to two mega trends: 1) an uptick in the frequency and sophistication of cyber offensive operations, and 2) increased public scrutiny of cyber security as a consequence of the ongoing Russia/Ukraine war.
So which cyber security companies are outperforming baseline indices and which ones are falling short? At the top of our list are HUB.TA (+2.48% over past 3mo) and PANW (+1.24%) over the same time frame. Palo Alto Networks is a staple of many blue chip tech funds, and the company remains one of the leading names in the date security field. Despite significant volatility in both markets and supply chains, PANW has continued to post strong financials as it tracks modest gains amidst double-digit losses.
The MVP of the past 3 months is HUB Security, currently traded on TASE as HUB.TA but is eyeing an imminent NASDAQ listing via SPAC merger with RNER under the symbol HUBC. Driving HUB.TA's strong recent performance is anticipation over its US listing. Just in recent days the SEC released an amended F4, signifying that the final regulatory hurdles are being tackled prior to HUB's delisting from NASDAQ and simultaneous NASDAQ listing. HUBC will start trading at $10/share for an initial capitalization of ~$1.3b, so keep this outperformer on your watchlist.
Underperforming QQQ are other cyber blue chips that have struggled to eke out price action gains over the past quarter. Microsoft, Intel, Radware, and Crowdstrike are all underperforming the NASDAQ baseline due to a number of reasons. INTC is still struggling to finds it footing after the passage of the CHIPs Act in August, which fundamentally reorganized the domestic chip and computing manufacturing ecosystem. RDWR missed its Q3 earnings forecast, potentially contributing to its recent drop. Despite its poor recent performance, CRWD still retains the trust and admiration of analysts, who have flagged its an undervalued stock ready for gains given a change in the macro backdrop.
Its been quite the year for equity traders and investors, but I for one am looking forward to a bullish 2023. This is not financial advice, just some personal commentary. Trade responsibly.

Nasdaq100 Simple Chart AnalysisLooking at Nasdaq chart, is still maintaining its support area here & all it takes to move bull might need to wait 23rd Nov. If data is unfavourable, it will retest back support.
My Personal Market Review
Market Review
Quarter Result Month
Nov 23rd
Core durable goods, initial jobless claims, new home sales & FOMC meeting minutes.
Nov 24th & 25th Thanksgiving day ( Holiday )
Good morning 1 Malaysian, seem we had a hung parliament on going & i am going into such politic view here cause no one will know what will happen to our KLSE but guidance already given earlier to be conservative on it despite a mini bull run at US side. Let's the party leadership to decide as i believe everyone already did their best vote out there. All i can say god bless our KLSE.
Let's focus more on US market cause any big movement from this will impact the entire market out there. The only important event we will have on the coming week will be 23rd FOMC meeting minutes. It might have the projection to start off their 1st cut or continue with raise rates which will determine the next market direction. Base on the latest economic data, inflation had been declining & this will bring positive movement towards tech sector. If we view the index chart, retracement is on going & if this continue to last long with the positive data, I assume Feds result might be a positive ahead than all of us shall have a Christmas Rally to run.
Conclusion, I will still maintain my strategy to be conservative for KLSE till a government form & optimistic that US side will run a mini bull. Let's see if that will happen. May the bull be with us all.
looks like were pulling backseems to be in correction mode 15 min could end up in head and shoulders 4hr

Financials XLF Flipping Technologies XLK..The last time Financials flipped Technologies was in 2000 which lead to six years straight of overperformance by the banking industry.
This is an important relationship to keep an eye on. These types of trends tend to stick for long periods of time and can lead to generational trades.

nasdaquri, anyone? its lime flavored.technicals have proven heavy selling is leading to countertrend movement. were getting lots of rate of change bullish signals daily indicating a trip toward supertrend, but longs really want to position themselves with momo in the index. daily highs breaking and holding .5 of the bounce would be good signs.

11/8/22 ATENA10 Networks ( NYSE:ATEN )
Sector: Technology Services (Information Technology)
Market Capitalization: $1.352B
Current Price: $19.03
Breakout price: $19.10
Buy Zone (Top/Bottom Range): $18.20-$16.80
Price Target: $23.00-$23.50
Estimated Duration to Target: 107-116d
Contract of Interest: $ATEN 2/17/23 20c
Trade price as of publish date: $1.45/contract

Tech sector below Cosmic Gravity supportE-mini technology sector futures price recently broke below Cosmic Gravity "Support Channel"(😎) and failing to break back above this level dropped back down (🧐). A next possible long entry position is now at "S6 Line".

CRWD | Good Entry Point | Swing TradeCrowdStrike Holdings, Inc. provides cloud-delivered protection across endpoints and cloud workloads, identity, and data. It offers threat intelligence, managed security services, IT operations management, threat hunting, Zero Trust identity protection, and log management. The company primarily sells subscriptions to its Falcon platform and cloud modules through its direct sales team that leverages its network of channel partners. It serves customers worldwide. The company was incorporated in 2011 and is based in Austin, Texas.
AMD is a strong short-term BuyAdvanced Micro Devices (AMD) has been practically consolidating since the October 13 Low. As the long-term trend has been bearish within a Channel Down pattern since the November 30 2021 Market High, the current consolidation following the rebound on the (dashed) Lower Low (diverging) trend-line can be seen as an Accumulation Phase preparing for the next bullish leg to the top of the Channel.
As you see all previous legs within the Channel Down have been following a certain pattern. After a (near) 30.00 1D RSI reading, and a MACD Bullish Cross, the price rebounds to at least the 0.618 Fibonacci retracement level. That is currently at 85.68 buy is outside the Channel Down, so we will settle for a Target within 73.50 - 77.50. Only a break above the 1D MA200 (orange trend-line) can be considered a long-term trend change to bullish.
See how the 1D MACD prints Higher Highs and each break above the Pivot is larger. More or less this is consistent with the price breaks above the 1D MA50 (blue trend-line).
-------------------------------------------------------------------------------
** Please LIKE 👍, SUBSCRIBE ✅, SHARE 🙌 and COMMENT ✍ if you enjoy this idea! Also share your ideas and charts in the comments section below! This is best way to keep it relevant, support me, keep the content here free and allow the idea to reach as many people as possible. **
-------------------------------------------------------------------------------
You may also TELL ME 🙋♀️🙋♂️ in the comments section which symbol you want me to analyze next and on which time-frame. The one with the most posts will be published tomorrow! 👏🎁
-------------------------------------------------------------------------------
👇 👇 👇 👇 👇 👇
💸💸💸💸💸💸
👇 👇 👇 👇 👇 👇

Technology Sector May Face A Rally SoonHello traders and investors, today we will talk about two technology stocks GOOGLE and META (Fcebook), which can be finishing final 5th wave from Elliott wave perspective.
As you can see, technology sector suffered the most in the last year, but what is interesting is that both GOOGLE and META can be now finishing a five-wave cycle from the highs. In Elliott wave theory, after every five waves, a three-wave A-B-C correction follows.
We have just noticed some big gaps down due to earnings miss, but considering that Google and Meta are trading in 5th wave with a potential spike before a reversal, there's a high probability for an A-B-C rally soon.
A-B-C recovery will ideally show up now at the end of 2022 or at the beginning of 2023.
All the best!

Here's Why Marvell is a Great Investment OptionMarvell is a semiconductor company headquartered in Sunnyvale, California. It designs and manufacturers standard digital and mixed-signal integrated circuits solutions for various applications across multiple end markets. Marvell has been a steady performer in the semiconductor industry, with its stock price rising by almost 95% last year alone. It is also one of the most cost-effective micro-electro mechanical systems (MEMS) manufacturers with an exceptionally high return on equity.
Marvell is a Diversified Company
Marvell is a diversified company with a range of products across multiple verticals and applications. Its core business is semiconductor design and manufacturing, with its product lines also including storage, cloud infrastructure, wireless, wired connectivity, and industrial IoT. Marvell is also a diversified geographically, with a presence in North America, South America, Europe, Asia, and the Middle East. This diversification, along with its balanced product portfolio, makes Marvell a strong investment option. Marvell's diversified business model and product portfolio help to sustain its revenue stability, cash flow, and profitability through cyclical downturns in specific industries. In addition, a balanced geographic presence helps to reduce the risk of a single-market setback, such as a trade war, or a currency fluctuation.
Marvell has an Exceptional Return on Equity
A key indicator of a great investment option is its ROE, which is calculated by dividing the net income by the total equity on a company's balance sheet. Marvell's ROE is exceptionally high at 25%, which is one of the highest in the semiconductor industry. This high figure shows that Marvell is able to generate a lot of cash from its equity capital through its operations. This shows that Marvell has a very strong business model and can be expected to generate consistent growth in its stock price over the next few years. ROE is a great metric to identify strong investment options because high figures indicate that a company is able to tap equity at low cost. This means that the company has a strong business model and can grow its equity without taking on a lot of debt. This makes Marvell a great investment option as it can sustain high returns without compromising on its financial health and other metrics such as asset turnover ratio and profit margin.
Marvell is a Solid ROIC Company
ROIC is a metric used to determine the financial health of a company and its ability to generate a consistent return on investment for its shareholders. It is calculated by dividing the company's net operating profit by the equity on the balance sheet. Marvell's ROIC is high at 36.77%, which is one of the highest in the semiconductor industry. This means that Marvell is able to generate a large amount of cash from its operating activities and is able to sustain its operations without external financial assistance. A company can generate a higher ROIC by reducing its cost of operations. Marvell has been able to maintain a low cost of operation through its innovative manufacturing processes and cost-saving initiatives. This has led to an increase in the company's net operating profit and a high ROIC. This makes Marvell a great investment option as its high ROIC shows that it has a strong business model and can be expected to generate consistent returns for years to come.
Marvell Holds Strong Partnerships with Big Brands
Marvell is partnered with leading technology and semiconductor companies to design and manufacture its products. The company's partnerships include Wistron, Intel, Samsung, Microsoft, and Huawei. These partnerships make Marvell's products more marketable and ensure its customers are well-served. This significantly reduces the risk of a decline in Marvell's stock price as the company's customers are less likely to switch to another vendor. These partnerships also enable Marvell to share best practices and learn from its customers to refine its products and services. This is expected to enable Marvell to sustain its growth rate and profitability. This makes Marvell a great investment option as its partnerships are expected to generate higher returns and minimize the risk of a decline in its stock price.
Marvell's Shrink Manufacturing Processes
Marvell has been at the forefront of the semiconductor industry through its innovation in the manufacturing sector. The company has pioneered the use of the shrinks manufacturing processes, making it more cost-effective and efficient than its competitors. This has allowed Marvell to expand its product portfolio and diversify its customer base. It has also allowed Marvell to increase its profit margins and sustain its growth rate over the years. This makes Marvell a great investment option as it is expected to generate higher returns and expand its customer base as its products become more cost-effective than its competitors.
Marvell Has Been a Solid Performer in the Semiconductor Industry
The semiconductor industry is a volatile one that is subject to market conditions and economic conditions such as economic growth, inflation, interest rates, and political developments. Marvell has been a steady performer in this industry, with its stock price rising by almost 400% in 2020-21. This makes Marvell a great investment option as it indicates that the company has been able to sustain its profitability through these volatile conditions and generate consistent returns. This is expected to increase the company's stock price and sustain its profitability over the next few years as well.
Marvell's Balance Sheet Looks Strong
A company's balance sheet is an indicator of its financial health and its ability to generate cash flow. Marvell has a strong balance sheet, with a debt-equity ratio of 0.7, an asset turnover ratio of 1.39, a profit margin of 15.67%, and a free cash flow of $460 million. This makes Marvell a great investment option as the company can sustain its operations without external financial assistance and generate cash flow to repay its debts.
An Excellent Track Record of Acquisitions
A key metric that indicates a company's ability to expand its business is its ability to make strategic acquisitions. Marvell has an excellent track record of acquisitions, with the last acquisition being Nautics to expand its presence in the cloud infrastructure sector. This makes Marvell a great investment option as its acquisitions have allowed the company to diversify its product portfolio and expand its customer base. This is expected to generate higher returns and sustain the company's profitability.
Solid Free Cash Flow
Free cash flow is a metric used to determine the profitability of a company. It's calculated by deducting the operating expenses, such as the cost of goods sold, and financing expenses, such as interest on debt, from the company's revenue. Marvell has a high free cash flow of $460 million, which is expected to increase as the company continues to grow its revenue.
Conclusion
Marvell is a diversified company, Marvell has an exceptional return on equity, Marvell is a solid ROIC company, Marvell holds strong partnerships with big brands, Marvell's shrinks manufacturing processes, Marvell has been a solid performer in the semiconductor industry, Marvell's balance sheet looks strong, and Marvell has an excellent track record of acquisitions. In short, Marvell is a great investment option and is expected to generate consistent returns over the next few years.
Free Cash Flow
Valuation Metrics
EPS Estimates & P/E
MRVL Financials
