QQQ rejected off top of 2009-2023 channelBlue channel represents the primary trading channel since the 2009 crash. Only during the Covid bubble was QQQ able to escape that channel (ended up doubling it). Price can still work its way up along this resistance line, such as 2014 and 2018, but both of those times the stock market averaged out to be pretty flat over about a year time frame.
Here it is on the 1W
Technologystocks

TESLA Do or Die moment to break the 2021 Resistance.Tesla (TSLA) is extending the rally following the buy signal (see chart below) we gave on November 07 at the bottom of the 1 year Channel Up:
The price has had 6 green candles out of a total of 7 and looks to repeat the Bullish Legs of April - July and January - February. What's more important than that, is that Tesla is approaching its 'Do or Die' moment as for the 5th time in 2 years (since November 2021), it is about to test the Lower Highs trend-line of the All Time High (ATH).
This huge Resistance level has rejected the price 4 times already, always initiating strong sell-offs. The 1W RSI has already broken above its own Lower Highs trend-line of July, so this could be an early signal of strength accumulation.
If we get a 1W candle close above the Lower Highs, we expect the final phase of the Bullish Leg to materialize and that would have practically confirmed that Tesla finally officially entered into a new Cycle of long-term growth. The target remains $345.00, representing a +75% rise from the recent Channel Low (-20% from the previous Leg).
-------------------------------------------------------------------------------
** Please LIKE 👍, FOLLOW ✅, SHARE 🙌 and COMMENT ✍ if you enjoy this idea! Also share your ideas and charts in the comments section below! This is best way to keep it relevant, support us, keep the content here free and allow the idea to reach as many people as possible. **
-------------------------------------------------------------------------------
💸💸💸💸💸💸
👇 👇 👇 👇 👇 👇

Bearish Channel Breakout, Setting Stage for a Return Above $300?Hi Realistic Traders. Here's my price action analysis on NASDAQ:TSLA !
On May 23, 2023, Tesla (TSLA) exhibited a breakout from the bearish trendline, sustaining its upward trajectory with consecutive higher highs and lows. Following this, TSLA's bullish momentum moderated, leading to the formation of a bearish channel. Notably, there has been a recent breakthrough above the upper trendline of this bearish channel, signaling a robust bullish indication. Adding to the bullish narrative, the momentum indicator (MACD) has executed a golden cross, further affirming the potential for continued upside movement toward the specified target area.
it is essential to note that the analysis will no longer hold validity once the target/support area is reached.
Disclaimer:
"Please note that this analysis is solely for educational purposes and should not be considered a recommendation to take a long or short position on TSLA."
Please support the channel by engaging with the content, using the rocket button, and sharing your opinions in the comments below!

NVDIA Supported by the 1D MA50, targeting $620.NVDIA Corporation (NVDA) closed all 1D candles above the Support, as presented on our October 22 idea, and easily rebounded aggressively to our $476.50 target (see chart below):
This time the rebound is very stable on the 1D MA50 (blue trend-line) with the log Channel Up since October 2022 showing incredible upside potential. Best to wait for the Rectangle's top to break first though, as a similar pattern in late 2022 gave a rally to the 1.786 Fibonacci extension when it broke upwards. As a result when it does again, our target will be $620 (1.786 Fib ext).
-------------------------------------------------------------------------------
** Please LIKE 👍, FOLLOW ✅, SHARE 🙌 and COMMENT ✍ if you enjoy this idea! Also share your ideas and charts in the comments section below! This is best way to keep it relevant, support us, keep the content here free and allow the idea to reach as many people as possible. **
-------------------------------------------------------------------------------
💸💸💸💸💸💸
👇 👇 👇 👇 👇 👇

TESLA Major bullish break-out above July's Lower Highs.Tesla (TSLA) broke today for the first time and even closed the 1D candle above the Lower Highs that started on the July 19 High. After 4 months of the bearish trend of this Falling Wedge pattern, today's move is a major bullish break-out for the long term as it opens the way for testing the All Time High (ATH) by mid 2024.
At the same time, the 1D CCI broke above its Lower Highs trend-line, which is always a bullish signal. Also this is the 2nd time that the 0.786 Fibonacci retracement level is tested, which is where both of the previous Lower Highs rejections took place.
On the short-term though we can follow the (dotted) Channel Up extension which after holding the 1D MA50 (blue trend-line) - 1D MA200 (orange trend-line) as the Support zone, can technically peak on a +19.80% rise, like the first bullish leg. That falls within the Resistance 1 - Resistance 2 zone. We will pursue the more modest target of 268.85 (Resistance 1). If the price then breaks above Resistance 2 (279.00), we will re-buy and target 299.50 (Resistance 3).
-------------------------------------------------------------------------------
** Please LIKE 👍, FOLLOW ✅, SHARE 🙌 and COMMENT ✍ if you enjoy this idea! Also share your ideas and charts in the comments section below! This is best way to keep it relevant, support us, keep the content here free and allow the idea to reach as many people as possible. **
-------------------------------------------------------------------------------
💸💸💸💸💸💸
👇 👇 👇 👇 👇 👇

AMD laying path to the All Time High.Advanced Micro Devices (AMD) hit our 133.15 target that we called for a month ago (see chart below):
The price is now extending the rise within the multi-month Channel Up, approaching the 0.618 Fibonacci Channel level. This is where the March 23 High was made with the rejection that followed, approaching the 1D MA200 (orange trend-line). As long as the short-term Channel Up (as you see it is a very common pattern within the wider structure) holds, we will be bullish, targeting 160.00 (Fibonacci 0.786 and close to the All Time High). If the short-term Channel Up breaks, we will sell and target the 0.236 Fibonacci and 1D MA200 at 110.00 (or if contact is made higher, then close on that price).
-------------------------------------------------------------------------------
** Please LIKE 👍, FOLLOW ✅, SHARE 🙌 and COMMENT ✍ if you enjoy this idea! Also share your ideas and charts in the comments section below! This is best way to keep it relevant, support us, keep the content here free and allow the idea to reach as many people as possible. **
-------------------------------------------------------------------------------
💸💸💸💸💸💸
👇 👇 👇 👇 👇 👇

APPLE Technical top at $210.Apple (AAPL) hit on Friday our $195.00 short-term target which we called on our latest November 12 analysis (see chart below):
The rally seems far from over as the recent pull-back turned out to be only a Bull Flag pattern, which typically prompts to a continuation of the trend. Being within a long-term Rising Wedge pattern, this pull-back resembles, even on 1D RSI terms, that of March 02, only on weaker strength (reasonably as the sequences get narrower towards the end of the pattern).
That first rally of the Wedged peaked just above the 1.382 Fibonacci extension. The current sequence's 1.382 Fib is at $210.00, which falls perfectly at the top (Higher Highs trend-line) of the Rising Wedge, and that is our medium-term target.
-------------------------------------------------------------------------------
** Please LIKE 👍, FOLLOW ✅, SHARE 🙌 and COMMENT ✍ if you enjoy this idea! Also share your ideas and charts in the comments section below! This is best way to keep it relevant, support us, keep the content here free and allow the idea to reach as many people as possible. **
-------------------------------------------------------------------------------
💸💸💸💸💸💸
👇 👇 👇 👇 👇 👇

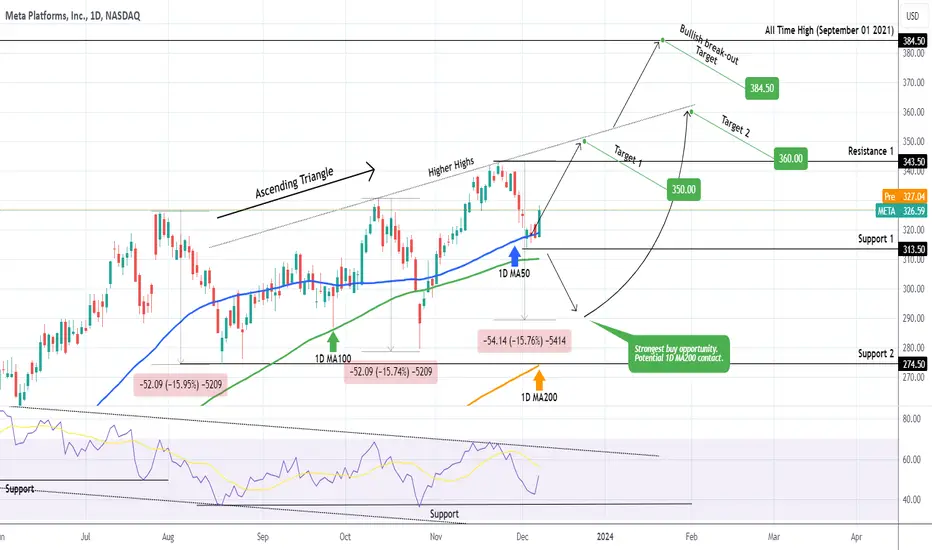
META Is it a BUY again?Meta Platforms (META) hit our $320.00 target after our most recent November 19 call (see char below) following a clear rejection on the Higher Highs trend-line:
The stock has since held the 1D MA50 (blue trend-line) as its short-term Support and turned into a buy again. The short-term target is still limited to the Higher Highs trendline and in that sphere of logic, we will target $350 (Target 1).
If however Support 1 (313.50) breaks, we might see another almost -16% decline, similar to the previous two bearish legs since July 28, which can test the 1D MA200 (orange trend-line). That will be the strongest buy opportunity on the medium-term and we will target again the Higher Highs trend-line at $360 (Target 2).
Any candle closing above the Higher Highs trend-line will be an automatic bullish break-out signal, targeting straight the All Time High at $384.50.
-------------------------------------------------------------------------------
** Please LIKE 👍, FOLLOW ✅, SHARE 🙌 and COMMENT ✍ if you enjoy this idea! Also share your ideas and charts in the comments section below! This is best way to keep it relevant, support us, keep the content here free and allow the idea to reach as many people as possible. **
-------------------------------------------------------------------------------
💸💸💸💸💸💸
👇 👇 👇 👇 👇 👇
SNAP The best short on the market.Snap Inc (SNAP) has been on an incredible rise since practically October 26, which was straight after the bottom on the Higher Lows trend-line of the 1-year Bullish Megaphone pattern. Technically that is the pattern's 4th bullish leg towards its top (Higher Highs trend-line). The price is very close to that level, which is also where the 1W MA100 (red trend-line) is waiting.
That is a trend-line that has been untouched for almost two years (January 04 2022). Obviously it is a major Resistance and coupled with the fact that the 1D RSI, besides touching its Higher Highs trend-line, is on the highest overbought level in three years (Oct 23 2020), makes a case for one of the strongest sell stock picks in the market.
All of the Megaphone's Higher Highs rejections have pulled-back to at least the 0.5 Fibonacci retracement level before a bounce. As a result, as long as we close the 1W candles below the 1W MA100, we are shorting Snap, targeting 12.00 (slightly above the 0.5 Fib).
-------------------------------------------------------------------------------
** Please LIKE 👍, FOLLOW ✅, SHARE 🙌 and COMMENT ✍ if you enjoy this idea! Also share your ideas and charts in the comments section below! This is best way to keep it relevant, support us, keep the content here free and allow the idea to reach as many people as possible. **
-------------------------------------------------------------------------------
💸💸💸💸💸💸
👇 👇 👇 👇 👇 👇

SPOTIFY Buy opportunity on the 4H MA50.Spotify (SPOT) opened considerably higher yesterday but almost closed the 1D candle flat as it couldn't diverge more from the general bearish market sentiment. Clearly this opening jump indicates the stock bias to continue the bullish leg of the Channel Up that started on October 23, but a small pull-back along the majority of the market is probable, which can serve as a more comfortable buy entry for a rally to the end of the year.
Based on the 1D CCI, we may be in a similar situation as February's temporary top, which pulled back and only found support on the 4H MA50 (red trend-line). As a result we are looking for a new buy on the 4H MA50 in order to target the 0.786 Fibonacci level at 208.00.
-------------------------------------------------------------------------------
** Please LIKE 👍, FOLLOW ✅, SHARE 🙌 and COMMENT ✍ if you enjoy this idea! Also share your ideas and charts in the comments section below! This is best way to keep it relevant, support us, keep the content here free and allow the idea to reach as many people as possible. **
-------------------------------------------------------------------------------
💸💸💸💸💸💸
👇 👇 👇 👇 👇 👇

MICROSOFT The 1D MA50 will be the buy opportunity for Xmas.Microsoft (MSFT) is trading inside a Double Channel Up pattern, with the longer term one (blue) starting on the January 06 bottom while the shorter term one (dotted) starting on the September 14 High. The latter Channel Up can be seen with the same structure earlier within the long-term Channel Up as well. It started after the stock pulled back and hit the 1D MA50 (blue trend-line), which provided a strong rebound.
The same kind of 1D MA50 test took place on October 26, which initiated the current bullish leg (November). As the 1D RSI is posting a Bearish Divergence (Channel Down) simiarl to March 17 - April 12 and the 1D MACD completing a Bearish Cross, we expect one final pull-back towards the 1D MA50. That can be the ideal buy entry for the end-of-the-year rally. Our long-term target is always $460, representing a +43.50% rise from the 1D MA50 bounce (similar to March 13).
-------------------------------------------------------------------------------
** Please LIKE 👍, FOLLOW ✅, SHARE 🙌 and COMMENT ✍ if you enjoy this idea! Also share your ideas and charts in the comments section below! This is best way to keep it relevant, support us, keep the content here free and allow the idea to reach as many people as possible. **
-------------------------------------------------------------------------------
💸💸💸💸💸💸
👇 👇 👇 👇 👇 👇

TESLA Moment of truth for long-term buying. Will it fail?It was almost a month ago (November 03) when we called for the start of a rally on Tesla (TSLA) as part of the bullish leg towards the top of the Falling Wedge pattern (see chart below):
Today the stock hit our $250 target and immediately got rejected at the top (Lower Highs trend-line) of the Wedge. That was on the 0.786 Fibonacci retracement level of the previous Lower High, the exact symmetrical level where the September 15 High was rejected.
This is a critical moment for the trend as failure to break and close a 1D candle above the Lower Highs trend-line, will maintain the bearish structure of the Falling Wedge, forcing us to sell again and target the 0.618 Fib level at $217.15. If however we close that 1D candle above, the Falling Wedge gets invalidated and with that the bearish trend, which transitions into a Channel Up (dotted lines) on the medium-term. In that case we will dump the short (low risk with the SL on the Lower Highs) and resume buying, targeting Resistance 1 at $268.85.
-------------------------------------------------------------------------------
** Please LIKE 👍, FOLLOW ✅, SHARE 🙌 and COMMENT ✍ if you enjoy this idea! Also share your ideas and charts in the comments section below! This is best way to keep it relevant, support us, keep the content here free and allow the idea to reach as many people as possible. **
-------------------------------------------------------------------------------
💸💸💸💸💸💸
👇 👇 👇 👇 👇 👇

NETFLIX Expect this rally to be extended.Almost a month ago (October 31) we gave a strong buy signal (chart below) on Netflix (NFLX) with the price reacting immediately having entered a non-stop rise:
Due to the sheer aggression of the current bullish leg of the Megaphone as compared to its previous ones though, we have to downgrade our medium-term target to $580, which will make a perfect +69.30% rise from the bottom as the July 18 High. Their RSI patterns are quite similar, though obvious that the current is more aggressive, hence will correct equally aggressively at some point, probably early-mid January 2024.
-------------------------------------------------------------------------------
** Please LIKE 👍, FOLLOW ✅, SHARE 🙌 and COMMENT ✍ if you enjoy this idea! Also share your ideas and charts in the comments section below! This is best way to keep it relevant, support us, keep the content here free and allow the idea to reach as many people as possible. **
-------------------------------------------------------------------------------
💸💸💸💸💸💸
👇 👇 👇 👇 👇 👇

ROCKET LAB can give +100% return. Best stock opportunity now?Rocket Lab USD (RKLB) has been consolidating for exactly one month (blue Arc pattern) after touching the Higher Lows Zone and now uses the 1D MA50 (blue trend-line) as its Pivot. We can see the very same consolidation pattern during the previous two market Lows (April - May 2023, June - July 2022), which gave enormous rallies of +114.46% and +105.08% respectively.
Similar with today's pattern, each bottom was priced on a 1D RSI Higher Lows sequence, which is a major Bullish Divergence. As a result we consider this one of the best high cap stock buy opportunities at the moment, and aim for at least a +105.08% rise, targeting $8.20.
-------------------------------------------------------------------------------
** Please LIKE 👍, FOLLOW ✅, SHARE 🙌 and COMMENT ✍ if you enjoy this idea! Also share your ideas and charts in the comments section below! This is best way to keep it relevant, support us, keep the content here free and allow the idea to reach as many people as possible. **
-------------------------------------------------------------------------------
💸💸💸💸💸💸
👇 👇 👇 👇 👇 👇

NVIDIA Incredible strength long-term. Is $1100 realistic?NVIDIA Corporation (NVDA) gave us a great bottom buy entry last time (October 22) we made a call on it and invalidated the Head and Shoulders pattern (see chart below):
This time we look at it on the 1W time-frame where it is on the 4th straight green weekly candle, approaching the Higher Highs trend-line. The 0.236 Fibonacci retracement level and the 1W MA50 (blue trend-line) provide Support, while the 1W RSI is on a Bearish Divergence (Channel Down) but the 1W MACD is about to form a Bullish Cross.
The last we had the above combination of indicators, was February 16 2021. At the time, the 1W MACD failed to make the Bullish Cross and the stock pulled back to the 1W MA50 but when it formed the Cross on April 12 2021, it broke above the Higher Highs. What followed was a 7-month rally to the -0.618 Fibonacci extension.
As you can see, the symmetry between the two fractals is striking. When the MACD Bullish Cross takes place, we would assume a similar rise and the -0.618 Fib target will be at $1100. Is that in your opinion realistic for Q3 2024?
-------------------------------------------------------------------------------
** Please LIKE 👍, FOLLOW ✅, SHARE 🙌 and COMMENT ✍ if you enjoy this idea! Also share your ideas and charts in the comments section below! This is best way to keep it relevant, support us, keep the content here free and allow the idea to reach as many people as possible. **
-------------------------------------------------------------------------------
💸💸💸💸💸💸
👇 👇 👇 👇 👇 👇

usa nasdaq UT 100 sellsell from that position we are on our way to sell but take care of the stop shown in the graph

Oracle potential correction is ON 🚨#usstock :: NYSE:ORCL
#dyor :: ORACLE
Present I am bearish 📍 on it 👍
I belive top is completed 📌
Now 35-45% potential drop we will see
Based on drop and pump 📌 we can decide macro top completed 📌 or not 🚫
Present my target is :: $80-90
( be in follow article under this post update will be provided )

APPLE Last BUY opportunity before a new 18 month expansion.Last time we looked into Apple (AAPL), it was still trading within the 2023 Channel Up (see chart below) and gave us an excellent technical pull-back buy opportunity:
This time the stock is after a 3-month pull-back that is testing the 1W MA50 (blue trend-line) for the first time since the week of March 13. On the wider picture of Apple in the last 10 years (1W time-frame), such pull-backs have been nothing more that consolidation phases before the next Expansion (usually 18 month - green arrows) that leads to the eventual peak and a new yearly correction (red arrows).
Those consolidation phases find Support on the 1W MA50 (even the COVID crash broke it just marginally), unlike the yearly corrections which find on the 1W MA200 (orange trend-line). What's astounding is the frequency of the consolidation pull-backs, which can be very effectively displayed with the use of the Sine Waves. As you can see on our chart, in the last 10 years, all pull-backs to the 1W MA50 after a 1W MA200 rebound, are located at the bottom of the Waves.
This indicates that most likely the current one is over and investors are expected to 'ride' the new 18-month Expansion wave to the new All Time High.
-------------------------------------------------------------------------------
** Please LIKE 👍, FOLLOW ✅, SHARE 🙌 and COMMENT ✍ if you enjoy this idea! Also share your ideas and charts in the comments section below! This is best way to keep it relevant, support us, keep the content here free and allow the idea to reach as many people as possible. **
-------------------------------------------------------------------------------
💸💸💸💸💸💸
👇 👇 👇 👇 👇 👇

A Glimpse Into the Future of AI Companies StocksInvesting in AI companies can be a wise decision, but like any investment, it is important to do your research and understand the potential risks and rewards. Companies such as UiPath, Intuitive Surgical, and Palantir Technologies have seen significant growth in recent years, but it is important to consider their market capitalization and share prices before investing.
UiPath, a software automation company, went public in April 2021 with an initial market capitalization of around $36 billion.
Intuitive Surgical, a company that produces surgical robots, has a market capitalization of over $93 billion.
Palantir Technologies, a data analytics company, went public in September 2020 with an initial market capitalization of around $22 billion.
It is also important to consider the rating of the shares and the security of the company before investing. For example, UiPath was rated as a buy by several analysts following its IPO, but investors should also consider the potential risks and competition in the market.
In terms of upcoming IPOs, there are several AI companies that are expected to go public in the near future, including UiPath's competitor Automation Anywhere, online education platform Coursera, Google’s company Waymo, and others.
As with any investment, it is important to do your own research and consult with a financial advisor before making any decisions. While the investment potential of these companies is undoubtedly significant, investors should be aware of the risks involved in investing in new and untested technologies. AI companies are subject to a variety of risks, including regulatory risk, intellectual property risk, and competition from other companies in the sector. As such, investors should carefully consider their investment options and consult with a financial advisor before making any investment decisions.
In terms of investment potential, it's important to note that investing in AI Companies can be risky, as with any new technology. However, for those willing to take the risk, the potential rewards could be substantial. The key is to do your research and choose companies that have a solid business plan and a proven track record of success. It's also important to keep an eye on the broader market trends and economic indicators, as these can have a significant impact on the success of any investment.
When it comes to security, AI technology is still in its early stages and there are certainly risks involved. However, companies that are dedicated to building secure AI systems and investing in the necessary security measures should be able to mitigate these risks to some extent. It's also important to note that as AI technology continues to evolve, so too will the security measures that are needed to protect it.
As AI technology becomes more advanced and more widely adopted, there will be a growing demand for companies that can provide innovative solutions in this space. This presents a significant opportunity for investors who are willing to take a long-term view and invest in companies that are dedicated to the ongoing development of AI technology.
-----------------------------------------------
Risk Warning
Trading stocks and options is a risky activity and can result in losses. You should only trade if you understand the risks involved and are comfortable with the potential for losses.
Risk Disclaimer!
General Risk Warning: Trading on the Financial Markets, Stock Exchange and all its asset derivatives is highly speculative and may not be suitable for all investors. Only invest with money you can afford to lose and ensure that you fully understand the risks involved. It is important that you understand how Trading and Investing on the stock exchange works and that you consider whether you can afford the high risk of loss
Rating: Risky Buy with High Upwards Potential
Risk Disclaimer!
The article and the data is for general information use only, not advice!

NETFLIX Is the streaming Giant a buy again?Netflix (NFLX) had a great run since our March 23 long (see chart below) and gave us more than +51% return in 4 months:
The long-term pattern remains a Bullish Megaphone and right now the price sits on its bottom (Higher Lows trend-line) as well as the 1D MA200 (orange trend-line), which has been unbroken since November 10 2022. On top of that, the 1D RSI is oversold on the 30.00 Support. Last time it was this low (March 10), the Megaphone priced a Higher Low bottom. As you realize, along with the 0.382 Fibonacci, we currently sit on a quadruple level Support Cluster.
Based on the 93 candle (roughly 135 days) rule within this Megaphone, which suggests that at the end of the 93 candle count, NFLX will either be near a High or a Low, we still have around 2 months to call a bottom. As a result, if the 1D MA200 and Megaphone break, we can see a slow descend along the 1W MA100 (red trend-line) and then pick up a reversal.
Either way, the once mighty streaming giant is entering a new long-term Buy Zone. Our target is the 0.786 Fibonacci extension ($587.50) even though we wil most likely see the Megaphone peak higher by Q2 2024.
-------------------------------------------------------------------------------
** Please LIKE 👍, FOLLOW ✅, SHARE 🙌 and COMMENT ✍ if you enjoy this idea! Also share your ideas and charts in the comments section below! **
-------------------------------------------------------------------------------
💸💸💸💸💸💸
👇 👇 👇 👇 👇 👇

Nasdaq (NDX) -> Dump And PumpMy name is Philip, I am a German swing-trader with 4+ years of trading experience and I only trade stocks , crypto , options and indices 🖥️
I only focus on the higher timeframes because this allows me to massively capitalize on the major market swings and cycles without getting caught up in the short term noise.
This is how you build real long term wealth!
In today's anaylsis I want to take a look at the bigger picture on Nasdaq.
For more than 10 years the Nasdaq has been trading in a quite obvious rising channel and just recently retested and already perfectly rejected the rising support trendline.
Since the Nasdaq is now retesting the parallel resistance trendline, I first do expect a short term drop to retest the $13.000 support level and then I think that we will see another rally.
- - - - - - - - - - - - - - - - - - - -
I know that this is a quite simple trading approach but over the past 4 years I've realized that simplicity and consistency are much more important than any trading strategy.
Keep the long term vision🫡

NVDA Great opportunity on the next pull-back of the Channel Up.NVIDIA Corporation (NVDA) has been trading within a Channel Up pattern for the past 4 months with the price currently on its middle, consolidating around the 1D MA50 (blue trend-line). This price struggle to pick up a rebound, resembles the previous bearish leg of the Channel Up, which after a series of Lower Highs, got rejected to form a new bottom (Higher Lows. The 1D MA50 sideways action as halfway through.
We can see a similar consolidation between the 1D RSI structures of the two fractals. The 1D MACD will give a bullish confirmation when it forms a Bullish Cross, but it may a little after the bottom is in, which means you may catch the uptrend on a slightly later stage. In any case it will give a lower risk factor (technically confirmed signal).
We will wait for the price to approach the bottom of the Channel Up, assuming of course it doesn't break below the 1D MA200 (orange trend-line) and target $515.00.
-------------------------------------------------------------------------------
** Please LIKE 👍, FOLLOW ✅, SHARE 🙌 and COMMENT ✍ if you enjoy this idea! Also share your ideas and charts in the comments section below! **
-------------------------------------------------------------------------------
💸💸💸💸💸💸
👇 👇 👇 👇 👇 👇

Broadcom (AVGO) -> Stronger Than NvidiaMy name is Philip, I am a German swing-trader with 4+ years of trading experience and I only trade stocks , crypto , options and indices 🖥️
I only focus on the higher timeframes because this allows me to massively capitalize on the major market swings and cycles without getting caught up in the short term noise.
This is how you build real long term wealth!
In today's anaylsis I want to take a look at the bigger picture on Broadcom.
Over the past 12 months Broadcom stock rallied more than 120% towards the upside, following the major hype in the whole semiconductor and AI sector.
After this recent pump it is quite expected that we will see a short term correction and if Broadcom retests the previous all time high at $630, this will be a perfectly bullish setup.
- - - - - - - - - - - - - - - - - - - -
I know that this is a quite simple trading approach but over the past 4 years I've realized that simplicity and consistency are much more important than any trading strategy.
Keep the long term vision🫡
