AMD Has it finally topped? Short-term sell in order?Advanced Micro Devices (AMD) has been rising non-stop giving us excellent pull-back buy opportunities since our December 12 2023 analysis (see chart below):
This time however it has gone as close to the top of the 18-month Channel Up as it has been since the beginning and is printing the same peak pattern it has formed during all previous Higher High formations. In addition, the 1D RSI is on Lower Highs that just broke below the Higher Lows and that has been the Sell Signal during the previous three occurrences.
We are targeting a minimum of -19.38% decline such as on the June 26 2023 Low. If the 1D MA100 (green trend-line) breaks, we will open another one to target the 1D MA200 (orange trend-line) and 0.382 Fibonacci Channel level at 130.00, which will represent a -29.77% drop, being the total decline on the October 26 2023 Low.
-------------------------------------------------------------------------------
** Please LIKE 👍, FOLLOW ✅, SHARE 🙌 and COMMENT ✍ if you enjoy this idea! Also share your ideas and charts in the comments section below! This is best way to keep it relevant, support us, keep the content here free and allow the idea to reach as many people as possible. **
-------------------------------------------------------------------------------
💸💸💸💸💸💸
👇 👇 👇 👇 👇 👇
Techstocks

COINBASE Has it found a bottom? Caution if it breaks this level.Last time we looked into Coinbase (COIN), we set a long-term target of $150 (November 14 2023, see chart below) that was easily surpassed:
At the moment the stock is on a short-term pull-back following the rejection near the 1D MA50 (blue trend-line). It is approaching a dangerous level, the 0.5 Fibonacci of the Channel Up, which is its middle but most of all the 116.50 level which is the former Resistance level (two Highs on August 04 2022 and on July 14 2023) that could now turn into Support.
If it holds, we can expect a rebound targeting $285, which would be a +146.82% rise, above the top (Higher Highs trend-line) of the Channel Up. If it closes a 1D candle below it though, we expect the price to seek the maximum % decline it has had within this pattern, -47.15%, which would bring the stock around $100 and would be technical test of the 1D MA200 (orange trend-line) and an excellent long-term buy entry, which is what took place on the October 27 2023 bottom. In that case a +146.82% rise would be $245.00 and that would be our Target. Note that at any given price, if the 1D RSI hits the 1-year Support Zone, it will be a solid buy entry regardless.
-------------------------------------------------------------------------------
** Please LIKE 👍, FOLLOW ✅, SHARE 🙌 and COMMENT ✍ if you enjoy this idea! Also share your ideas and charts in the comments section below! This is best way to keep it relevant, support us, keep the content here free and allow the idea to reach as many people as possible. **
-------------------------------------------------------------------------------
💸💸💸💸💸💸
👇 👇 👇 👇 👇 👇

TESLA made a Channel Down bottom. Buy but watch these breakouts.Tesla (TSLA) has been trading within a Channel Down pattern since the July 19 2023 High (which was an emphatic Lower Highs rejection on the ATH Lower Highs trend-line of the November 04 2021 All Time High) and on our last analysis (January 12, see chart below) we called for a tight SL buy but mentioned the importance of taking the loss quickly if the April 27 2023 trend-line broke and reverse to a sell on a $180.00 Target:
The price did make that bearish break-out and hit $180.00, a level that has been holding since last Thursday. Even though the fundamentals surrounding the company are very volatile, this is a strong medium-term buy opportunity from a technical perspective. Not only is it at the bottom (Lower Lows trend-line) of the 7-month Channel Down, but also the RSI is forming an Inverse Head and Shoulders pattern, which is a structure that has been formed on every single bottom since the December 27 2022 market bottom.
In fact the 1D RSI reached last Thursday those exact vastly oversold levels (17.50) it has last seen on that global December 2022 (price bottomed on January 06 2023) market bottom. As a result, there are much more reasons to consider the current level a strong medium-term opportunity than not. The technical target is $245.00, which represents a Lower High level slightly lower than a projected +41% rise (last Lower High was +36%, the one before +31%, so we estimate a +5% progression). We will book the profit earlier though if the 1D RSI hits its Resistance Zone before the price reaches $245.00.
If the uptrend is extended and the price breaks above the ATH Lower Highs trend-line (already has 5 rejections since November 2021), we will take it as a bullish break-out signal and target $315.00, which is the September 21 2022 Triple Top. On the other hand, if the stock closes a 1D candle below the Lower Lows (bottom) trend-line of the 7-month Channel Down, we will sell and target $152.50, which is the Support 2 level.
-------------------------------------------------------------------------------
** Please LIKE 👍, FOLLOW ✅, SHARE 🙌 and COMMENT ✍ if you enjoy this idea! Also share your ideas and charts in the comments section below! This is best way to keep it relevant, support us, keep the content here free and allow the idea to reach as many people as possible. **
-------------------------------------------------------------------------------
💸💸💸💸💸💸
👇 👇 👇 👇 👇 👇

Alphabet - Watch The All Time HighHello Traders, welcome to today's analysis of Alphabet.
--------
Explanation of my video analysis:
In 2011 Alphabet stock broke out of a beautiful triangle continuation pattern and created a rally of more than +800%. This pump was followed by a retracement all the way back to the support trendline of 2011. Alphabet is currently creating a triangle formation and if we see a pullback to the uptrendline which I mentioned in the video analysis, I am looking for potential long setups.
--------
I will only take a trade if all the rules of my strategy are satisfied.
Let me know in the comment section below if you have any questions.
Keep your long term vision.

APPLE eyeing the 1W MA50 support.Apple (AAPL) hit yesterday the 1D MA50 (blue trend-line) for the first time since November 06, extending the rejection on the Resistance 1 level. A rejection that is in perfect symmetry with the February 03 rejection that also caused a pull-back.
The last call we made on Apple (see chart below) was on November 12 actually signaling a buy after the Falling Wedge break-out, targeting 195.00:
The fundamentals this time are far from ideal, so a greater correction seeks the next technical Support level. That is the 1W MA5 (red trend-line), which is currently sitting at the bottom (Higher Lows trendline) of the multi-month Rising Wedge pattern, and was the level that initiated the strong rally on the October 26 bottom.
As a result we are looking for a downside range within 177.00 - 175.00 and then rebound with a $215.00 target.
-------------------------------------------------------------------------------
** Please LIKE 👍, FOLLOW ✅, SHARE 🙌 and COMMENT ✍ if you enjoy this idea! Also share your ideas and charts in the comments section below! This is best way to keep it relevant, support us, keep the content here free and allow the idea to reach as many people as possible. **
-------------------------------------------------------------------------------
💸💸💸💸💸💸
👇 👇 👇 👇 👇 👇

YNDX Stock: Unveiling Bullish Secrets Amidst Restructuring DelayProfessional Technical Analysis for YNDX Stock : Navigating Bullish Momentum Amidst Restructuring News
Introduction:
The recent restructuring announcement by Yandex, the tech giant, has triggered speculation and rumors, introducing an intriguing dynamic to the YNDX stock landscape. This professional technical analysis aims to decipher the implications of the delayed restructuring deal and assess the emerging bullish momentum.
Market News and Restructuring Delay:
The article on Investing.com ( www.investing.com ) provides insights into the anticipated delay of Yandex's restructuring deal until early 2024. This development has sparked market speculation and fueled rumors, adding an element of uncertainty to YNDX stock.
Technical Analysis - Bullish Momentum:
Post the restructuring delay announcement on the 25th, a surge of bullish momentum has been detected on the weekly timeframe for YNDX stock. A breakout candle has emerged, signaling a potential continuation of an ascending triangle pattern towards the 3110.6 mark. This pattern suggests a positive outlook, and traders are advised to monitor the developments closely.
Key Price Levels to Watch:
Take Profit at $2497.0 : The initial target for profit-taking aligns with the ascending triangle's breakout, presenting an opportunity for traders to capitalize on the bullish momentum.
Take Profit at $2613.8 : As the momentum builds, the second profit-taking level serves as a strategic point to secure gains, anticipating further upward movement in YNDX stock.
Take Profit at $2733.4 : The third and final profit-taking level represents a calculated exit point, considering the evolving market dynamics and the ascending triangle pattern's potential continuation.
Conclusion:
In conclusion, the delay in Yandex's restructuring deal has introduced an element of uncertainty, sparking rumors and speculation in the market. The subsequent surge in bullish momentum, particularly evident on the weekly timeframe, paints a positive picture for YNDX stock. Traders are advised to exercise caution and closely monitor the ascending triangle pattern's development, with the identified profit-taking levels serving as strategic guides in navigating this dynamic market landscape.

Intel - The Anticipated RallyHello Traders, welcome to today's analysis of Intel.
I will only take a trade if all the rules of my strategy are satisfied.
Let me know in the comment section below if you have any questions.
Keep your long term vision.

Nvidia - Watch The Channel PatternHello Traders, welcome to today's analysis of Nvidia.
I will only take a trade if all the rules of my strategy are satisfied.
Let me know in the comment section below if you have any questions.
Keep your long term vision.

NVDIA Supported by the 1D MA50, targeting $620.NVDIA Corporation (NVDA) closed all 1D candles above the Support, as presented on our October 22 idea, and easily rebounded aggressively to our $476.50 target (see chart below):
This time the rebound is very stable on the 1D MA50 (blue trend-line) with the log Channel Up since October 2022 showing incredible upside potential. Best to wait for the Rectangle's top to break first though, as a similar pattern in late 2022 gave a rally to the 1.786 Fibonacci extension when it broke upwards. As a result when it does again, our target will be $620 (1.786 Fib ext).
-------------------------------------------------------------------------------
** Please LIKE 👍, FOLLOW ✅, SHARE 🙌 and COMMENT ✍ if you enjoy this idea! Also share your ideas and charts in the comments section below! This is best way to keep it relevant, support us, keep the content here free and allow the idea to reach as many people as possible. **
-------------------------------------------------------------------------------
💸💸💸💸💸💸
👇 👇 👇 👇 👇 👇

Apple - Nothing Is BearishHello Traders, welcome to today's analysis of Apple.
I will only take a trade if all the rules of my strategy are satisfied.
Let me know in the comment section below if you have any questions.
Keep your long term vision.

Nasdaq - All Time HighsHello Traders, welcome to today's analysis of Nasdaq.
I will only take a trade if all the rules of my strategy are satisfied.
Let me know in the comment section below if you have any questions.
Keep your long term vision.

PALANTIR Buy opportunities within the Channel Up.Palantir (PLTR) is trading within a 16-month Channel Up and is right now below the 1D MA50 (blue trend-line) and above the Channel's median. Once the 1D RSI hits again the Support Zone, it will be a buy opportunity again (assuming it also hits the Channel's median). The previous Bullish Leg on the median rose by 58.85%. As a result our target will be $25.00.
This trade will be invalidated if the price breaks below the 1D MA200 (orange trend-line). In this case, we will wait until the stock approaches the bottom (Higher Lows trend-line) of the Channel Up again. The previous Bullish Leg on the Channel's bottom rose by +136.50%, which is marginally above the $25.00 target.
-------------------------------------------------------------------------------
** Please LIKE 👍, FOLLOW ✅, SHARE 🙌 and COMMENT ✍ if you enjoy this idea! Also share your ideas and charts in the comments section below! This is best way to keep it relevant, support us, keep the content here free and allow the idea to reach as many people as possible. **
-------------------------------------------------------------------------------
💸💸💸💸💸💸
👇 👇 👇 👇 👇 👇

AMD laying path to the All Time High.Advanced Micro Devices (AMD) hit our 133.15 target that we called for a month ago (see chart below):
The price is now extending the rise within the multi-month Channel Up, approaching the 0.618 Fibonacci Channel level. This is where the March 23 High was made with the rejection that followed, approaching the 1D MA200 (orange trend-line). As long as the short-term Channel Up (as you see it is a very common pattern within the wider structure) holds, we will be bullish, targeting 160.00 (Fibonacci 0.786 and close to the All Time High). If the short-term Channel Up breaks, we will sell and target the 0.236 Fibonacci and 1D MA200 at 110.00 (or if contact is made higher, then close on that price).
-------------------------------------------------------------------------------
** Please LIKE 👍, FOLLOW ✅, SHARE 🙌 and COMMENT ✍ if you enjoy this idea! Also share your ideas and charts in the comments section below! This is best way to keep it relevant, support us, keep the content here free and allow the idea to reach as many people as possible. **
-------------------------------------------------------------------------------
💸💸💸💸💸💸
👇 👇 👇 👇 👇 👇

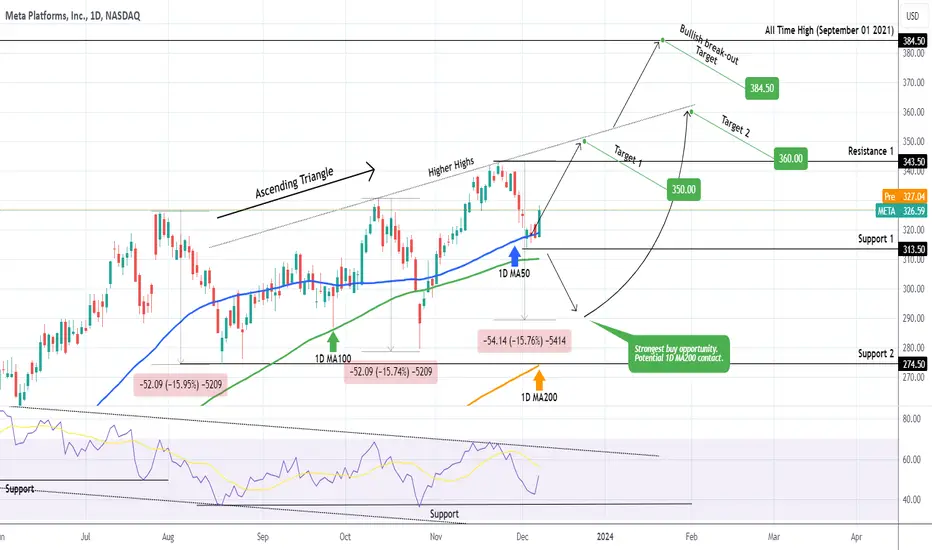
META Is it a BUY again?Meta Platforms (META) hit our $320.00 target after our most recent November 19 call (see char below) following a clear rejection on the Higher Highs trend-line:
The stock has since held the 1D MA50 (blue trend-line) as its short-term Support and turned into a buy again. The short-term target is still limited to the Higher Highs trendline and in that sphere of logic, we will target $350 (Target 1).
If however Support 1 (313.50) breaks, we might see another almost -16% decline, similar to the previous two bearish legs since July 28, which can test the 1D MA200 (orange trend-line). That will be the strongest buy opportunity on the medium-term and we will target again the Higher Highs trend-line at $360 (Target 2).
Any candle closing above the Higher Highs trend-line will be an automatic bullish break-out signal, targeting straight the All Time High at $384.50.
-------------------------------------------------------------------------------
** Please LIKE 👍, FOLLOW ✅, SHARE 🙌 and COMMENT ✍ if you enjoy this idea! Also share your ideas and charts in the comments section below! This is best way to keep it relevant, support us, keep the content here free and allow the idea to reach as many people as possible. **
-------------------------------------------------------------------------------
💸💸💸💸💸💸
👇 👇 👇 👇 👇 👇
SPOTIFY Buy opportunity on the 4H MA50.Spotify (SPOT) opened considerably higher yesterday but almost closed the 1D candle flat as it couldn't diverge more from the general bearish market sentiment. Clearly this opening jump indicates the stock bias to continue the bullish leg of the Channel Up that started on October 23, but a small pull-back along the majority of the market is probable, which can serve as a more comfortable buy entry for a rally to the end of the year.
Based on the 1D CCI, we may be in a similar situation as February's temporary top, which pulled back and only found support on the 4H MA50 (red trend-line). As a result we are looking for a new buy on the 4H MA50 in order to target the 0.786 Fibonacci level at 208.00.
-------------------------------------------------------------------------------
** Please LIKE 👍, FOLLOW ✅, SHARE 🙌 and COMMENT ✍ if you enjoy this idea! Also share your ideas and charts in the comments section below! This is best way to keep it relevant, support us, keep the content here free and allow the idea to reach as many people as possible. **
-------------------------------------------------------------------------------
💸💸💸💸💸💸
👇 👇 👇 👇 👇 👇

Now would be a good time to short the Nasdaq Index...Short term resistance has been met and the Nasdaq has just recently broken through its short term support. This would indicate to me a correction will follow taking the price of the Nasdaq back down to medium term support.
After this i would exercise caution, any short term bounce may be followed by another breakdown in the medium term support. Then the Nasdaq may head lower into the long term support range which is typical after such a long bull run in tech stocks.
The catalyst for this correction in tech stocks will be for the economy to rollover after the Fed's aggressive rate raising cycle.

TQQQ long 35.25 add 34 sl 31 clsing basis . lets see if its in a mood to bounce , pretty oversold if you ask me but my view is for long term term so keep your losses small if wrong and be ready to look for bargains whenever it presents itself

SNAP Potential bearish reversal. MACD to confirm the sell. Snap Inc (SNAP) has been on a strong rise since the September 26 Low. Technically since the October 21 2022 market bottom, the stock has been trading within a wide Rectangle pattern, with the majority of its price action observed within the (blue) High Volatility Zone consisting of the 0.236 - 0.618 Fibonacci range. The price is currently on the 0.236 Fib.
Every 1D MACD Bearish Cross above the 0.00 mark, following a rally that started with a Bullish Cross below 0.00, has been a great sell opportunity. Our target is exactly on the 0.618 Fib at 9.85 (the bottom of the High Volatility Zone), which will also make a perfect contact with the (green) Ichimoku Cloud. Notice the harmonic trend of the Ichimoku Cloud within this long-term Rectangle. Every decline tends to hit it.
-------------------------------------------------------------------------------
** Please LIKE 👍, FOLLOW ✅, SHARE 🙌 and COMMENT ✍ if you enjoy this idea! Also share your ideas and charts in the comments section below! This is best way to keep it relevant, support us, keep the content here free and allow the idea to reach as many people as possible. **
-------------------------------------------------------------------------------
💸💸💸💸💸💸
👇 👇 👇 👇 👇 👇

PALANTIR May fractal points to $24.50 before years end.Palantir (PLTR) a week ago above the top (Lower Highs trend-line) of its medium-term Descending Triangle pattern, and has been basically consolidating this whole week but notably on a series of (minor) red candles. This is similar to what turned out to be a Bull Flag pattern of May 10 - 15.
Surprisingly, the stock had also broken above the Lower Highs trend-line of its Descending Triangle at the time, and with the support of the 1D MA50 (blue trend-line), it registered a remarkable (almost) +180% rally on the August 01 Top. Although in order to attract a rally of equal proportions, a strong fundamental catalyst would be needed, we can deem the 1.5 Fibonacci extension, a feasible technical target by the end of December, as it can even be within the borders of a Channel Up.
As a result, as long as the 1D MA50 is supporting, we have a medium-term target at $24.50 on PLTR.
-------------------------------------------------------------------------------
** Please LIKE 👍, FOLLOW ✅, SHARE 🙌 and COMMENT ✍ if you enjoy this idea! Also share your ideas and charts in the comments section below! This is best way to keep it relevant, support us, keep the content here free and allow the idea to reach as many people as possible. **
-------------------------------------------------------------------------------
💸💸💸💸💸💸
👇 👇 👇 👇 👇 👇

IBM: A Risky Earnings TradeNYSE:IBM Reports after the market closes today. It is probably at or near its fundamental levels even if the report is weak.
The chart shows a strong support level as the stock price is at the neck of the bottom completion level.
IBM is in a long term trading range when viewed on a long term trend. The problem is a weak CEO who has failed at reinvention and a stock that is pricey for its growth potential.
However, it has more upside potential than downside. It would take a really negative report to create a strong run down. That is not likely.
PSHI is very low so less savvy investors own almost half the outstanding shares. This means trading the earnings report is riskier.

ADBE, Second BEAR-Fractal, SHORT-Momentum DOOMSDAY Incoming!Hello There!
Welcome to my new analysis of ADBE. This stock has been massively battered by the major bear market decline setup in the gigantic bear channel. This stock did not exceed any new highs and did not have the potential to emerge with new bull momentum. The bears are still present within this stock and this is exactly why the bear momentum for this stock can accelerate heavily any time soon. There are several major bearish indications that are underlining the bearish scenario for the stock in an overwhelmingly precarious way.
Three reasons why the bear doomsday scenario for the stock is present, starting any time soon:
1.) Massive Liquidations: Over 250 Billion positions have been liquidated within the previous bearish doomsday market decline wave towards the downside.
2.) Weak Momentum: The momentum with which the recent meager recovery wave setup is highly fragile and is likely to turn anytime soon.
3.) Major Short-Side Positioning: A vast amount of institutional and smart money operators are positioning their selves on the short side. Always an important indication especially with retail traders positioned in the other direction.
Why shorting the stock through the upcoming second bear doomsday scenario will be the best approach in the current and upcoming market conditions:
1.) Second bearish ascending wedge fractal: The stock is going to complete exactly the same bearish ascending wedge fractal towards the downside once again.
2.) Total-Return Approach: By shorting the stock a trader has the candidature to a total-return approach, the trader is profiting when prices fall and at other times when they go up.
3.) Liquidation Acceleration: Once the whole ascending fractal has been completed it will trigger a fast-paced bearish wave making profits much faster than in an uptrend.
The most prevalent determining indications that are going to activate the upcoming bear market scenario wave for the stock:
As it is seen in my chart ADBE completed the huge bearish ascending triangle fractal exactly by moving into the upper distribution zone from where it emerged with the pullback towards the downside and set up the massive 250 Billion bearish liquidation wave towards the downside. This wave developed very fast and by positioning oneself before this huge bearish wave and completion of the fractal towards the downside a trader could make a big load of profit in the market.
Now, ADBE is still trading within the gigantic descending channel formation in which it has the most prevalent upper resistance distribution channel which has been the origin of the massive bearish waves towards the downside before and is now already setting up the upcoming 300 Billion bearish liquidation wave towards the downside which is going to activate the completion of the second ascending wedge fractal and the preceding wave C towards the bearish direction.
In the next times, the whole bearish ascending wedge fractal will be completed with the breakout below the lower boundary followed by the breakout below the 65EMA and 100EMA from where the bearish trend acceleration is going to unfold huge accelerations towards the downside and the severe bearish continuations towards the lower target zones. Especially, in this case, the market could still continue beyond this level in the bearish direction.
Upcoming Perspectives and the major underlying factors that are primarily important for consideration on the short side for the stock, the sector, and the economic field:
It has to be mentioned that an economic field with high interest rates, spreading inflation, a stagnation within the sector is setting up the determination to increase this whole bearish wave development, especially with a more bearish volume moving into the market. Also, highly determining in this case is the actual technology developments because when they reverse in an economic field this will have massive bearish effects on the stock as well.
Now, for traders it is highly important to follow such market situations with the appropriate setup within the market, especially in such times it is necessary to have the right positioning within the market because a massive bearish pressure acceleration can start anytime soon considering a huge acceleration in the inflation, a smart money operator bearish market making in which the bearish conclusion will be inevitable, an expiring futures market in which a lot of futures turn to an bearish volatility in the market. This is why traders need to position their selves before all these heavy bearish scenarios are set up.
In this manner, thank you everybody for watching my analysis of ADBE. Support from your side is greatly appreciated.
VP

MSFT, PULLBACK Momentum, Positions Trigger, BEARISH-Indication!Hello There!
Welcome to my new analysis about MSFT Stock Price Action Analysis on Several Timeframe Perspectives. In the recent times MSFT has emerged with a crucial pullback to the downside almost printing over 10% of a bearish pullback. In such occassions a big question is if the bearish momentum will accelerate into the bearish direction and if higher inflation rates could heavily increase such a bearish momentum. In any cases the bearish momentum wave could trigger further long-liquidations down the path.
In my chart you can watch that MSFT is about to complete a huge ascending-wedge-formation and such a ascending-wedge-formation is likely to lead to a massive pullback and bearish reversal once it has been completed with a breakout below the lower boundary. Currently this pullback could be triggered when MSFT moves below the remaining supports between the 315 to 320 area as many many long-positions are waiting below this area this will lead to such a bearish momentum that a reversal into the other direction will be unvalid.
There is the possibility that MSFT firstly stays within the area and bounces in the remaining supports to form something like an initial reversal, nonetheless MSFT has still huge resistance levels in the structure especially when moving into the upper boundary of the ascending-wedge-formation this upper boundary is a paramount resistance-zone from where the pullback to the downside is inevitable. This means that also with the initial stabilization the completion of the whole ascending-wedge-formation will shape a reality for MSFT and complete the pullback and liquidations down the path.
If the bearish momentum accelerates so heavily once the wedge has been completed it will be highly decisive on how MSFT moves into the final target-zone of 220 because if the bearish momentum should be that high that a reversal in this area will not be possible this will complete the huge double-top-formation and will accelerate even more liquidations to point to a scenario of MSFT moving below the 150 area.
For now the bearish scenario for MSFT should not be underestimated and should be watched and because of this we will keep having the symbol in our watchlist and adjust to changing factors.
In this manner, thank you everybody for watching the analysis, support from your side is greatly appreciated.
VP

Is DocuSign Bottoming out?This is a Technical Analysis for DocuSign, Inc. (DOCU) on the 1 Week timeframe.
Our current price action is being squeezed by a Symmetrical Triangle.
We are currently testing SUPPORT on the Black trendline.
The space inside the triangle is tight. This move is getting very very close to playing out and may be in the process now.
If we break to the UPSIDE, our 1st target = BLACK Resistance line around $58-59
Our next target would be the RED Resistance line at around $67-68.
If we break to the DOWNSIDE, our 1st target = around $46
Our 2nd target = $41
Now whats more probable? Upside or Downside?
In my opinion, We move to the Downside.
Some evidence exists that i believe will support a downtrend.
Before i continue, i just want to add that Price declines should not be viewed as a negative thing. Its part of the normal nature of the markets. In this case, i think this decline would help support the next move Up in DOCU.
Especially noting that in my opinion, DOCU is trying to set a BOTTOM.
Now notice the RED arrow pointing down. This is my downside target ($41) and what i think will help DOCU's market structure.
If we hit this, it will indicate a DOUBLE BOTTOM formation, which would be a probable area for a bounce. This would also be a catalyst for momentum to enter for price to move towards "MAJOR RESISTANCE" level.
ANother clue that supports my downside targets, is the printing of the Gravestone Doji candle, week of June 5th. This is extremely BEARISH candle pattern. It may have not been priced in yet and we have yet to see the effects of this candle.
To see further signs of what is to come, lets look at the INDICATORS.
Firstly, RSI -> Notice how we are also in kind of a triangle pattern and that its getting tight for RSI as well. We need to see what it does next also, whether breaks to upside or downside. WHich ever direction, it will also coincide with the movements of price.
STOCH RSI -> shows momentum, we are currently in the process of printing a BEARISH cross. If its confirmed, then this could put momentum that pushes price DOWN
ADX -> Is another momentum indicator. Currently we are in this weak momentum zone. We have to watch the interations between GREEN and RED.
If RED moves ABOVE = BEARISH momentum -> this will support a price decline
If GREEN moves ABOVE = BULLISH MOMENTUM -> this will support a price increase
CONCLUSION:
We are in a tightening Triangle pattern, one directions got to give. Whether up or down is yet to be determined. However, my thoughts are leaning more towards a DECLINE. The gravestone doji candle, supports the idea of further decline and creating better market structure would also add to a decline. But a decline is not a bad thing, if we get one. It becomes probable for a DOUBLE BOTTOM and signs of a bottoming out of DOCU.
Thank you for taking the time to read my analysis. Hope it helped keep you informed. Please do support my ideas by boosting, following me and commenting. Thanks again.
If you have any questions, do reach out. Thank you again.
DISCLAIMER: This is not financial advice, i am not a financial advisor. The thoughts expressed in the posts are my opinion and for educational purposes. When trading always spend majority of your time on risk management strategy.
