TSLA BULLISH PIERCING CANDLESTICK With the recent release of teslas quarterly reports that we’re better than expected we saw a push to test 180.00 with a slight pullback, depending on feds decision we can see push higher to 300.00. With more manufacturing and infrastructure updates in the upcoming months if positive these could help push price back to retest precious highs.
Techstocks

AMZN BULLISH ENGULFING CANDLE Monthly candle just closed and it looks very much like a bullish engulfing candle, reports will be released Thursday with expected volatility, I see this pushing price higher up to 135.00 -140.00

NDQIf S/R flip 12,170-12,200 then we should head turbo back to ATH 16,800. Could be in the most hated melt up the stock market ever seen.

NFLX - Potential Short Setup Here we are looking at NFLX on the Daily TF…
As you can see, Netflix has broken down from its previous macro support (blue), and retraced back to the scene of the crime. Currently, it is re-testing this very same previous support as newfound resistance.
While I can’t suggest how YOU should trade it, this certainly appears to me as a VERY strong short set up (not financial advice).
We will continue to monitor this chart and see how it reacts to this level. Stay tuned to make sure you don’t miss any timely updates…
What do you think will happen? Let us know in the comments!
Cheers!

NVIDIA 40% OpportunityClear reverse head and shoulder opportunity for NVDA. Neckline is broken. Expect 38%-40% rise. Good Luck.

NASDAQ bottomed or fall 20% by March?Here is my chart combining channels, trend lines, and waves.
You can see that the NASDAQ has been fighting to stay inside the blue channel since mid-October, but has been trapped under the black channel. If it is going to hold, then this would be a good place. That would keep the blue channel bull rally intact.
However, this week's rejection off the top of the channel is not a great sign. There is still a good possibility that we still need to complete the wave C of the larger ABC correction before this is over. Right now, Wave C stands at a 0.618 fib extension of Wave A which is pretty small. If it goes lower, then a bounce and support at 0.786 seems logical, which is around the peak before the COVID crash. That could be a good long entry.
I would not rule out something closer to the 1.0 level before we are done. If that does come to be, then that takes us down to the red trend line created off the bottoms of the 2018 and 2020 corrections. That is the 9000 range (could overshoot down to 8700) and would be a great place for a big long entry. Anything lower than that, and, well, lets not think about.

AAPL Testing Crucial ZoneHere we are looking at AAPL on the Daily TF…
In this chart, AAPL is testing a crucial zone as resistance, which acted as previous macro support dating back to September of 2020.
As you can see, there is also a downwards sloping resistance forming as well, which it’s testing as well.
In testing its previous macro support as newfound resistance (red) and local resistance (light blue) simultaneously, we can conclude that this test for AAPL is crucial in determining what comes next…
I will continue to develop this test of resistance as the chart develops, and update the idea once it breaks in either direction!
What do you think will happen?
Cheers!

Another come back?I would open a small long position and wait for the break out. If the price closes above the $115 resistance by the end of the week I'll add the next trade day session.

Technical Analysis of Google (NASDAQ:GOOG)Hello guys,
I am sharing with you my analysis of Google.
I think the stock looks pretty cheap at the moment and it is forming a beautiful Double Bottom.
This is further supported by a MACD Bullish cross and upward trending RSI, which is above the 50 line.
Overall I think it has an appealing risk-to-reward opportunity.
What do you think?

Signs before Tesla crashContent:
i. Early signs before its crash
ii. These signals are applicable to others markets
iii. How to hedge Tesla?
This method can be applied to any other markets. In segment 2, I demonstrated how you do that in the Nasdaq index. You can email me your case study on other markets with similar behaviour, we can check with each other.
E-Mini Nasdaq
Minimum fluctuation
0.25 points = $5
1 point = $20
10 points = $200
100 points = $2,000
1,000 points = $20,000
Disclaimer:
• What presented here is not a recommendation, please consult your licensed broker.
• Our mission is to create lateral thinking skills for every investor and trader, knowing when to take a calculated risk with market uncertainty and a bolder risk when opportunity arises.
CME Real-time Market Data help identify trading set-ups in real-time and express my market views. If you have futures in your trading portfolio, you can check out on CME Group data plans available that suit your trading needs www.tradingview.com

Oracle: Sweet Temptation 🔥Oracle is moving dangerously close to the resistance line at $85.58, which would activate our alternative scenario. In that case, the stock would rise further into the green target zone between $85.45 and $92.50 to finish off the grey wave alt.I before sinking back into a correction. Primarily, we expect the course to drop into the green target zone between $72.66 and $63.46 to complete the grey wave II. After completion, we predict Oracle heading North in the longterm.

Google - Bullish Harmonic The tech stocks witnessed deep corrections of over 30% on Nasdaq.
Nasdaq was one of the most underperforming indices in US and the bearish momentum prolongs on the first day of 2023.
The Bullish Harmonic pattern on $Goog confirmed the reversal but today's dip seems an opportunity to go long.
The pattern negates on breach of $80.

Good time to buy TESLA historicallyTesla may have met the support that will be the last of its bear market. Based on the bounce so far on the 329-week SMA and that any price action at or below the 200-week SMA has historically been the best times to invest in TESLA, we can assert it's likely now is a decent time to buy TESLA.

$NDX can move 1500-2000 points lower. $QQQ down. 200ma failingAs company earnings decline and forward guidance becomes pessimistic, Nasdaq 100 has room to go back to 9000-8700. Big tech companies have already started reducing their workforce, and more layoffs may come next year. The 200ma offered support after the first leg down, but now it looks like it might give way. RSI and stochastic are bearish.
Now is a good time to let go of any grip your mind has on the "big tech" stocks of the past ten years and start your list of up and coming tech stocks for the next 10-15 years.
This post is not to create a scare. I am not shouting for a crash. As a 40+ adult who understands much more than the last five yrs of stock market rising - and the Covid QE slingshot - I am offering practical insight into what is possible.
Add JOBY to your watchlist.

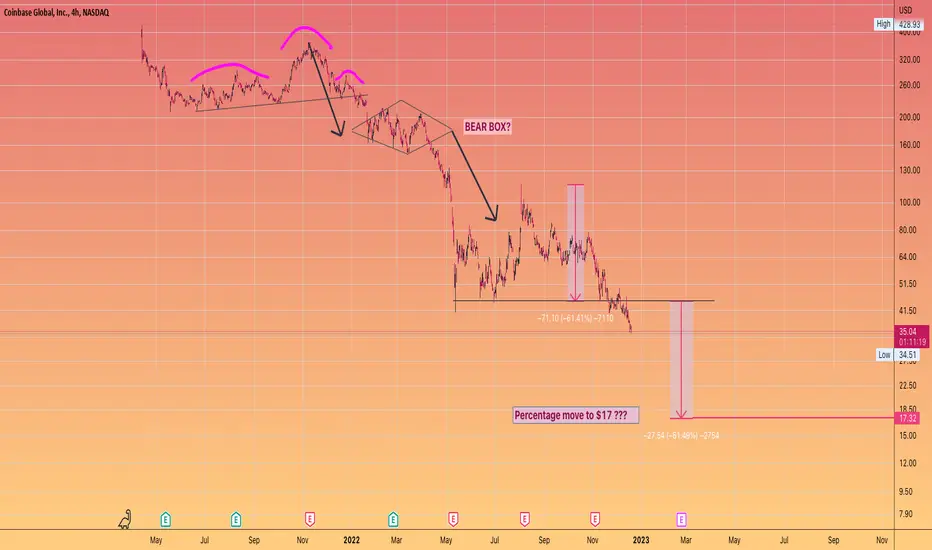
#COIN - #COINBASE final low targeting the teens :(A measured percentage move indicates
a few more months of capitulatory action
As we saw earlier in the year
#crypto equities have been good leading indicator for #BTC and the crypto space
NASDAQ MORE DOWNSIDE!I still see downside in 2023, the chart is showing a similar pattern to the DOTCOM BUBBLE.
I just see bear market rallies and some considerable time until we see a major trend reversal.
We have just finished the 2nd BUBBLE which was led by the creation of BITCOIN which was born out of the Financial Crash in 2008. The age of low interest rates are also over and the time of making easy money is over.
This is just for my own trading journey and pure speculation, if you enjoy please like and comment below.
Thanks

Anatomy of a NASDAQ interim topAn interesting set of events just occurred in the NASDAQ futures. In early November, the NASDAQ (and most market indices) spiked in a bullish rally, only to find a resistance at about 12,000 in mid-November. It then retraced to test the support at 11,560. While it bounced off the support then, there was a momentary spike down to 11,528. This is the significant low for this consolidation range at the top of the short term rally. The bounce brought it to 11830, where a resistance level was failed. This was then followed by a revisit to the consolidation range support (bottom of yellow box).
About an hour ago, a lower low was triggered (red support line) and currently the NASDAQ futures is struggling to keep above the consolidation zone support.
Technical indicators MACD and VolDiv are slightly bearish, boding a more likely breakdown. MACD crossed under, and remains under the zeroline. VolDiv is not uptrending, but below its SMA, and looking for a breakdown below zero line.
Also noted is the green "BD" where it denotes a Break Down of an auto-plotted trendline support.
The price action is a little long to the downside, and has been support hugging. It is likely to have some sort of a rebound, but what happens next depends on whether there is more juice to sustain. A technical rebound is due and appears to be forming up at time of writing. Definitely, is there enough juice to get this to the upper part of the range?
The other thing here is that a decisive breakdown out of the consolidation range is needed and appears to be lining up for the later part of the week. This is invalidated IF a technical rally closes above 11850.
Wait for it...

COINBASE in technical trouble... Noted that Coinbase COIN is in some sort of technical trouble.
Based on downside projections, the downdraft is technically aligned and sound, with a target of 23.36, by mid-December. This is a 50% cut in stock price from last Friday's closing.
An earlier breakdown of the triangle, and the more recent failure of the 2022 support last Friday suggest more downside to follow in the days and weeks ahead.
Heads up...

Bear Market, Bull Market, or Sector Rotation? KNOW THE ROTATION!
What Is Sector Rotation?
Investors are always looking for opportunities to boost returns and reduce risk in their portfolios. One way to do this is by understanding and utilizing sector rotation.
In simple terms, sector rotation is the process of moving money from one sector to another. In order to take advantage of positive market trends investors will want to pay close attention to these rotations. In general, there are two types of market conditions that investors need to be aware of: bull markets and bear markets.
Sector rotation is a strategy that investors use to take advantage of these market conditions. The idea is to rotate your investments into sectors that are doing well in the current market conditions and away from sectors that are not.
For example, in a historical bull market, you would want to be invested in sectors such as technology and healthcare. In a bear market, you would want to be invested in sectors such as utilities and consumer staples.
Sector rotation can be a helpful tool for investors to boost returns and reduce risk. However, it’s important to understand how it works before implementing it in your own portfolio. Keep reading to learn more about sector rotation and some current YTD chart examples of what it looks like.
Lets start with a philosophical question in regards to the market; is there really such thing as a bull and bear market? One could argue that there is not, and the market is in fact a cycle of sector rotations. Liquidity going out one, to another, again and again. Take for example the 4 tickers of the main post image MSFT , NASDAQ:TSLA , NASDAQ:GOOGL , NASDAQ:AAPL - these are considered Tech Stocks (yes TSLA is a tech stock!). YTD performance of all these stocks are in the red. Please take the time and study their trends. To the novice that had a portfolio made up of 80% tech, they would look at this chart and scream BEAR MARKET. But is it? It is impossible for the average trader to tell, but not all that money was "lost" in a bear market. It simply was rotated to defensive sectors. Sure, some money was taken out of the overall system I am sure but logic dictates that the majority of the money just found a new home. Investors in tech in these cases could ride the storm and average down (dollar cost averaging), write call options, or purchase puts (along with many other strats) - aka play a bear market in THAT sector. The terms "bull" and "bear" market are used to describe market conditions where prices are either rising or falling. Some people believe that there is a fundamental difference between the two types of markets, while others believe that they are simply two sides of the same coin. Ultimately, there is no right or wrong answer, and it is up to each individual to decide what they believe.
So where did the Tech money rotate to? For those of you that need only bull markets to trade, find the rotation and follow it. Never marry a stock or sector - money moves fast and is prone to jumping ship when major events happen. Here are 3 charts that show areas that bulls have had success:
EX1: Staples and Consumer; NYSE:HSY , NYSE:MCD , NASDAQ:OLLI , NYSE:WMT
EX2: Energy, Industrial, Insurance; NYSE:KMI , NYSE:CAT , NYSE:OXY , NYSE:ABBV
EX3: Defensive and Insurance; NASDAQ:HON , NYSE:RTX , NYSE:AFL , NYSE:CI
If you take the time and study the charts above you will see that not all is bearish when you know where to look. Looking at these rotations can start to paint a larger picture when studying ETFs or the overall market in a national/global economy. Especially when it comes to finding a fair value area in the middle of a downed market. Recovery off of a bear market should be equitable across multiple sectors. In the current case (today) we see that the rotation into "defensive" stocks (all the stocks mention in EX1, EX2, and EX3). As there is a small pinch of hope that inflation could be slowing, the moves have been liquidity into these defensive sectors - not a sign of a healthy recovery (yet) in my opinion. Right now we are seeing more institutional interest in companies like HSY, MRK, CI, HON and less interest in Energy. Energy is a great sector to look at currently to start to see that shift. We can look at commodities like GOLD and see the increased attention and bullish run it has had recently. Remember, intuitions want to create the largest positions they can , but over time so as not to raise a flag to others.
To find sector rotation:
1) Familiarize yourself with the S&P sector funds like the AMEX:XLF , AMEX:XLP , AMEX:XLE , AMEX:XLU , etc
START LARGE - look at the Monthly, Weekly, and Daily
2) Scan for stocks with rapid price drops and identify sectors that may be hurting
3) Scan for stocks with rapid rising price WITH higher than average volume (preferable increasing volume as well)
4) Visualize the sectors in a heatmap. Size by Volume (Monthly) and Color by Performance (Monthly). Since this is constantly changing, I suggest taking a screen shot of this map every week - this will be the best way to "see" the money rotate.
5) When going through 2-4 consider comparing small and large cap companies as well - as this too can hold its own rotation.
6) Stay on top of news, read read read read. Understand the world around you and rely on change.
7) Utilize Smart Money Concepts. Please visit LUX ALGO's page for this, as he has made a beautiful indicator and strategy based around SMI and institutional order blocks.
8) Conduct an RSI or Stochastic RSI study to identify divergences in OVERBOUGHT or OVERSOLD conditions.
9) VIX VIX VIX - yes we are talking sector rotation and the VIX is an "overall" reflection of the market in whole but looking at areas of the VIX (ie 20 and 45) can give signs of upcoming rotation. Although it may not point where, it may describe when these rotations can occur.
If you like this post and would like a more detailed follow up, please comment below so I can see your interest. This is a very extensive topic in which it may take several posts to fully write out in detail. This is post 1 and meant to be an introduction, as I know that almost every line below can be heavily expanded upon.
Happy trading everyone!

Joe Gun2Head Trade - Inverse head and shoulders on NASDAQTrade Idea: Buying NASDAQ
Reasoning: Inverse head and shoulders on NASDAQ
Entry Level: 11773
Take Profit Level: 12900
Stop Loss: 11523
Risk/Reward: 4.54:1
Disclaimer – Signal Centre. Please be reminded – you alone are responsible for your trading – both gains and losses. There is a very high degree of risk involved in trading. The technical analysis , like all indicators, strategies, columns, articles and other features accessible on/though this site is for informational purposes only and should not be construed as investment advice by you. Your use of the technical analysis , as would also your use of all mentioned indicators, strategies, columns, articles and all other features, is entirely at your own risk and it is your sole responsibility to evaluate the accuracy, completeness and usefulness (including suitability) of the information. You should assess the risk of any trade with your financial adviser and make your own independent decision(s) regarding any tradable products which may be the subject matter of the technical analysis or any of the said indicators, strategies, columns, articles and all other features.

GOOGLE Search UP OR DOWNNice channel here looking for Break to the upside of 120 or Breakdown below 105.

S&P 500 RECESSION ANALYSIS!EARLIER, i had posted saying if the us markets goes further down what will be there point. (check the link section)
lets go on further,
recession means what earned everything lost, reached its breakeven point. what profit gained has gone away, with net having no loss and no profit.
FIBONACCI ANALYSIS: Fibonacci describes this statement in a very beautiful manner. if the price is trading at the 0.5 level then it is has reached its recession point.
although do note that 0.5 level is also a deciding level. okay, i will come to this later.
lets talk about this idea that why is the US started recovering.
interest rates had started coming down, and the indices are reacting very positively towards it.
i have explained to Fibonacci that now the recession has been completed according to this indicator.
MOVING AVERAGES(50 AND 100): both the moving averages(50 and 100), are meeting at one point, and they will now repel and move upwards.
RSI: yet it needs to give a breakout, but is definitely showing divergence(the two purple lines), relating to price action
TREND LINES: THE BLUE TREND LINE: yet needs to be breached, and yes this is the move that will make the break of it.
many of the great tech stocks have massively come down, and now they are showing divergence and a good upside move is gonna come.
FINAL WORDS: US markets will have a boom in their upside movement, as many of them kept on selling their positions, and such the interest rates have started coming down and will become normal within 1-2 years, so from now onwards the next year will be a great run for the US markets.
i will come to my point which i earlier which i had left in the middle, in my previous s&p analysis(link below), i had mentioned if s&p goes further down then recession stage, then at what point will it go down, and what will be the levels furtheron.
but since interest rates have started coming down, and mostly all the other economical news has been factored, i say that now there is a great space that us markets can have there bull run, and they will have, because its so clear that markets are tend to go upside, and they are the ones who react at first.
thank you.

Looking for a replacement for trading Twitter shares?Now that Elon Musk’s buyout of Twitter has been completed, and the company has been taken off the trading market, what comparable stocks can traders look to trade now?
Of course, there are other social media compatriots that traders could turn to, or even other companies of a similar market capitalisation that are in takeover talks and abiding by a similar volatility. A stock that might just fit the bill could be the social media outlier; Pinterest.
Pinterest sometimes likes to position itself as the antithesis of Twitter and Instagram, where users find inspiration rather than encountering toxicity and developing body-image disorders. While I can't speak to the truthfulness of this claim, Pinterest is still categorised as a social media platform and its stock price can be affected by some of the same micro and macroeconomic events that affect this sub-sector. As such, and as illustrated on the chart, Pinterest and Twitter have followed a very similar stock price trajectory. This parallel in stock prices would have been a lot closer if not for Musk’s bid for Twitter at an inflated price in April 2022, and the subsequent court battles that led to him eventually completing the buyout.
Pinterest, like Twitter, may also start fielding takeover bids, hopefully at a chunky premium.
In October 2021, PayPal offered $45 billion for Pinterest, which would have been the costliest acquisition of social media company since Microsoft bough LinkedIn for $26 billion in 2016. The bid would have represented a premium of 24.5% over PINS share price the day before the announcement. However, PayPal reneged its bid shortly after offering it when investor sentiment proved to be against the deal, and PayPal tanked ~12.0% in the three days after revealing an offer had been made.
As of November 2022, the value of Pinterest has slipped to $16.5 billion and may be a more attractive prices for other suitors to come calling, especially if the value that PayPal’s board saw in Pinterest (and that Paypal’s investors overlooked) has been retained. Perhaps suggesting this is true was Pinterest's third-quarter earnings report in the final week of October 2022. Pinterest reported that its third-quarter revenue increased 8% year-over-year to $685 million. Pinterest shares have surged ~11% in the last five trading days.
What make this remarkable is when you compare it to other social media and tech stocks, particularly Facebook which is down ~29%, and Alphabet (which owns YouTube) which is down ~8% since they reported their respective earnings around the same time last week. The latter has even been rumoured to be exploring an acquisition of Pinterest after Alphabet's CEO Sundar Pichai gave a coy response to a question put to him in September about targets the company was considering for takeover.
