$SCKT launches first enterprise-grade scanners for Apple iPhoneSocket Mobile launches first enterprise-grade scanners for Apple iPhone 12 series
Socket Mobile is excited to announce the arrival of the DuraSled™, the first enterprise-grade barcode scanner for the iPhone 12, iPhone 12 Pro, iPhone 12 Pro Max and iPhone 12 Mini. With the sleek, high-performance DuraSled, users of all Apple iPhone 12 series devices can access professional-grade scanning solutions.
An ever-increasing number of companies count on iPhone applications to run their businesses.
finance.yahoo.com
Techstocks

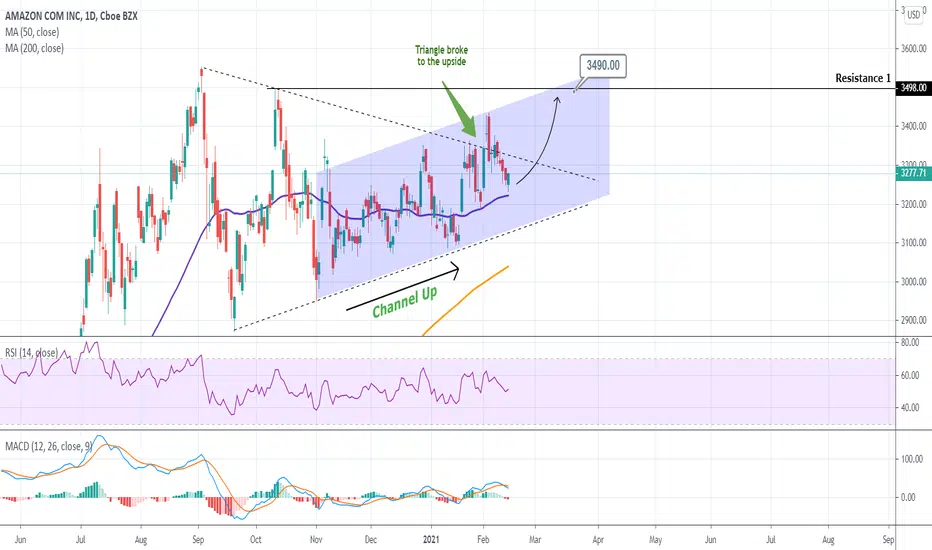
AMAZON Short-term target 3490Pattern: Channel Up on 1D.
Signal: Buy as the price is on the 1D MA50.
Target: 3490 (just below the Resistance 1).
** Please support this idea with your likes and comments, it is the best way to keep it relevant and support me. **
--------------------------------------------------------------------------------------------------------
!! Donations via TradingView coins also help me a great deal at posting more free trading content and signals here !!
🎉 👍 Shout-out to TradingShot's 💰 top TradingView Coin donor 💰 this week ==> TradingView
--------------------------------------------------------------------------------------------------------
$FTFT Enter Into Cooperation Agreement to Use Blockchain TechFuture FinTech and China Foundation of Consumer Protection Enter Into Cooperation Agreement to Use Blockchain Technology Against Counterfeit Products.
The "Responsible Brand Plan" will be officially launched in March 2021 and operated by the "Quality and Safety Office" of the Anti-Counterfeiting Committee of China Foundation of Consumer Protection.
The Responsible Brand Plan will make full use of the real name based blockchain anti-counterfeiting tracing technology developed by CCM, which will not only protect the legitimate rights and interests of the enterprises and their brands, but also impose responsibility for their product's quality and safety."
finance.yahoo.com

Why $BRQS Skyrocketed in 2021Why $BRQS Skyrocketed in 2021
There does not appear to be any direct news from the company. But it seems like that there was some coordination by day traders on social media.
$BRQS shares were buoyed — thanks to discussions and speculation on Twitter and Twitter hashtags at the start of the month..
Chinese 5G/Ev/blockchain
Just before Christmas last year, the company announced that it would be reducing its debt by $18 million and eliminating institutional loans.
Also in December 2020, the company signed an agreement to build a 5G industrial park in China.
The other positive factor for the $BRQS is the surging price of bitcoin-blockchain technology.
investorplace.com
twitter.com

Nano Dimensions Ticker $NNDMGreat Company!! Debt to Asset Greater!!! Cash Flow Great!!! Balance Sheet Great!!! Income Statements Great!!!
This is a Great Autonomous/Robotics Company.. Buy before the hype!! Jackpot Stock!!

Teradata Soars on Strong Earnings and Demand for CloudTeradata Soars on Strong Earnings and Demand for Cloud
Shares soared Friday after the data-analytics company reported stronger-than-expected fourth-quarter earnings (triple-digit cloud growth), benefiting from corporate demand for enterprise software and cloud services.
Annual recurring revenue (ARR) increased 11% from the prior year period(1)
Public cloud ARR increased to $106 million, a 165% increase from the end of 2019(1)
Fourth-quarter recurring revenue of $383 million versus $350 million, an increase of 9% reported and 8% in constant currency , and exceeded the Company’s guidance of $371 million to $373 million(1)
Fourth-quarter earnings per diluted share (EPS), cash from operations and free cash flow(2) exceeded the Company’s expectations
finance.yahoo.com

LIZHI INC. Issues Letter to ShareholdersLIZHI INC. Issues Letter to Shareholders
Tiya, our audio-based social product, soared to rank among the top 4 social networking apps in the U.S. Within a few months of Tiya’s launch worldwide, it has been ranked among the top 10 social networking apps in about 50 countries worldwide. Currently, Tiya has users in over 200 countries.
We believe that online social networking through audio will become a dominant method of social networking in the future.
we further developed LIZHI’s corporate value, while elevating our talent training initiatives, including forming collaborations with universities to cultivate talents specializing in AI technology.
Moreover, we launched an "Innovation Training Camp" internally to equip our employees with innovative thinking in tandem with scientific methods. We also continued to invest in our management team with a lot of resources and systematic training to enhance management skills.
we launched a new mobile app, LIZHI Podcast (also named LIZHI BOKE in Chinese), in January 2021, to provide our users with a more compelling podcast experience.

Payoneer to Become Publicly Traded Company Through FTACPayoneer to Become Publicly Traded Company Through Combination With FTAC Olympus Acquisition Corporation
Payoneer processed more than $44 billion in volume in over 7,000 trade corridors in 2020
Transaction assigns Payoneer $3.3 billion pro-forma implied enterprise value upon , representing a 7.6x multiple of 2021 expected revenue of $432 million. The cash component of the purchase price to be paid to the equity holders of Payoneer is expected to be funded by FTOC's cash in trust (minus any redemptions by FTOC's existing public stockholders).
Includes commitments for $300 million PIPE from investor group including existing investor Wellington Management, as well as Dragoneer Investment Group, Fidelity Management & Research Company LLC, Franklin Templeton, certain funds managed by Millennium Management, funds and accounts advised by T. Rowe Price Associates, Inc., and Winslow Capital Management, LLC
Following the Reorganization, the Company is expected to have up to $563 million in cash, offering significant capital flexibility for continued organic and inorganic growth.
Existing Payoneer equity holders have the potential to receive an earnout of additional shares of common stock if certain stock price targets are met as set forth in the reorganization agreement, and they will remain the largest investors by rolling over significant equity into the Company.
The transaction is expected to close during the first half of 2021.
finance.yahoo.com

TWTR-Bullish Setup into EarningsSimple setup, not expecting anything spectacular. We have a gap to fill @50 therefore i do see us making a minimum push to that area. I will let this trade ride close into earnings if it progresses past 50, but will def close before earnings.

LONG MSFT BREAKOUT, STRONG SUPPORT, SWING TRADE, TOP TECH PICK
The fundamental are really strong for this MSFT. With the recent announcement of partnering with GM and investing $2B on the cruise from GM. EV market is now getting attention from big tech companies likes apple who have plan to get into. Microsoft investing in cruise which is ahead of tesla in certain tech feature and automation. Based on its current prices it just broke resistance levels and if it continues which seems highly probable going into earrings it will gap up to $230+ easily.
Forecast:
Using the Bloomberg terminal the average one year target price for MSFT is $242. This will yield a 8%+ return from its current price. Its high target price is at $278 and it's low target price is at $200. Considering the stock price is already at $224 the down side is only -$24 or (-10.71%). It leaves an upside of +$54 or (24.11%). Clearly there is more upside in this investment then downside.
In terms of the Industry Analysis; the technology sector is outperforming every other industry. MSFT is classified under software sub industry which is one of the best performing sub industries. The company has essential products especially like TEAM which is fairly need but is already competing with other companies like Slack. It's Azure cloud program is doing great in terms of growth. It's revenue growth rate is 48% over the last quarter. Microsoft’s current and future revenue. Office Commercial and consumer products are both growing – unsurprising in the work-from-home era. Additionally, Microsoft Teams has reached 115 million daily active users, up from 75 million in April.
Overall, the current price makes this company undervalued. It broke a resistance level and will continue to gap due to sub industry analysis, price target, technical analysis, fundamental analysis. This company will continue to growth due to covid stay at home work. Its products and remote service on top of having Azure positions its in great spot to increase in value.

Globalstar Signs Agreement With Ceres TagGlobalstar Signs Agreement With Ceres Tag, the World’s Only Direct to Satellite Livestock Smart Ear Tag
GSAT has signed a commercial agreement with Ceres Tag, to supply satellite services to the livestock industry through the world’s first and only smart ear tag for traceability provenance, biosecurity, health, animal welfare, production improvement and theft reduction.
This agreement follows Ceres Tag’s recent success in winning the SVG Ventures THRIVE Challenge and their ear tag being named as the #1 Big Breakthrough Technology for Ag Change in the Next Decade by the AgJournal of Weekend Australian.
Ceres Tag will launch May 1, 2021 at the Beef Australia Exhibition in Rockhampton Queensland Australia and will be available for purchase from their online ecommerce website for delivery worldwide. Initial market focus will be Australia/New Zealand and North America.
finance.yahoo.com
SPOT Partners With Battlbox to Drive Awareness of Winter Safety
As part of the partnership, Battlbox Pro Box subscribers will receive a SPOT Gen4, the next generation of the SPOT Satellite GPS Messenger™, with up to 6 months of service.
finance.yahoo.com

Possible big move for Microsoft coming. $MSFTPossible big move for Microsoft coming. $MSFT. Has been trading in this wedge formation, now with big rally on January 20, 2021, possible of breakout with major upside. NASDAQ:MSFT

Achronix to List on Nasdaq Through Merger With ACE ConvergenceAchronix is the only independent supplier of high-performance FPGAs and eFPGA IP based data acceleration solutions used in high-growth applications including AI, cloud computing, 5G, networking and automotive driver assistance
Highly differentiated financial profile with estimated 2020 revenues of approximately $105 million, 79% gross margins and 35% operating margins with migration to next-generation products driving an estimated revenue CAGR of 20% to 25% from 2020 to 2025
Business combination with ACE Convergence Acquisition Corp. (Nasdaq: ACEV) positions Achronix to capitalize on non-cancellable backlog in excess of $160 million and over $1.1 billion in identified pipeline opportunities driven by Speedster® and Speedcore™ products
Approximately $2.1 billion estimated post-transaction equity value based on current assumptions with up to $330 million in gross cash proceeds to the company, assuming minimal redemptions
Oversubscribed $150 million fully committed common stock concurrent PIPE financing at $10.00 per share anchored by ACE Equity Partners LLC, funds and accounts managed by BlackRock and Hedosophia; and with participation from other institutional investors
Achronix expected to be listed on Nasdaq under the ticker symbol "ACHX" following an anticipated transaction close by the end of the first half of 2021
Customer validation of Achronix’s products is substantiated by nearly $240 million in orders received in 2020 . Achronix’s new Speedster7t and Speedcore products, built on leading-edge process technology, have contributed to a design pipeline value in excess of $1.1 billion and are expected to drive Achronix’s future growth.
"The next era of growth and opportunity is in the trillions of connected devices providing compute-intensive intelligence, all fueled by network connectivity and 5G,"
finance.yahoo.com


Completes Sale of Cimatron and GibbsCAM Businesses3D Systems Completes Sale of Cimatron and GibbsCAM Businesses and Provides Preliminary Financial Results for Fourth Quarter 2020
- Announces Date of Fourth Quarter and Full Year 2020 Financial Results
- Close of sale of non-core software businesses for cash proceeds of approximately $64 million
- Repayment of all debt outstanding under senior secured term loan. With the paydown of the term loan, the company is now free of any outstanding debt but continues to have availability under its senior secured revolving credit facility, which remains fully undrawn at this point.
- Official termination of ‘At-the-Market’ Equity Offering Program
- Strong Q4 preliminary financial performance with expected revenues between $170 million and $176 million
- Expected revenue reflects strong organic growth exceeding 20% in both Healthcare and Industrial business units on a consecutive quarter basis.
Essentially debt-free now, and free to focus on its two core 3D printer making businesses (industrial and healthcare), the company also noted that in addition to the better-than-expected sales, it is likely to report anywhere from $11 million to $19 million in pro forma profit for Q4.
Generally accepted accounting principles (GAAP) results could still be as bad as an $8.6 million loss, but there's at least the possibility that 3D will eke out a GAAP profit of as much as $0.5 million this quarter.
finance.yahoo.com

Two $FSR opportunities same chartThis is what I meant when I say anticipate your opponent.
This chart shows two opposite opportunities. Technically speaking it has a descending triangle which is a bearish pattern. However, as you may notice when price is at $14.50-15.50 range it tends to stall and play around that area. There is better R:R for the long opportunity. For a stock position, waiting on this one and letting price action decide which opportunity to take.

Anderson from Colliers reiterated a buy ratingAnalyst Charles Anderson from Colliers reiterated a buy rating on the stock while increasing its price target from $13 to $15.
Anderson is bullish on the company's prospects related to Sony's PlayStation 5, which incorporates Immersion's haptics technology in the new DualSense wireless controller. One of the notable additions to the newest generation of the game console is the inclusion of adaptive triggers in the controller, which facilitate a new level of haptic feedback for players.
Anderson has been using the DualSense controller and called it a "breakthrough" for Immersion to score such a high-profile design win in a mass-market application. Demand for the PS5 has been off the charts, with units flying off digital shelves within minutes of retailers getting additional inventory after launching last month.
"Immersion collects a royalty from each controller and we expect more than one controller will ship per console over time to support multiplayer gaming and to replace worn-out controllers,"
"The DualSense controllers are already available at retail ahead of the PlayStation 5 console launch."
Anderson believes that Immersion will be able to expand into other markets with its haptics technology offerings, and that the company has finally created an "efficient and predictable operating model."
www.fool.com
The analyst also notes that Immersion's fundamentals are becoming more predictable with 80% of revenue coming from per unit royalties, double the amount from four years ago.
seekingalpha.com

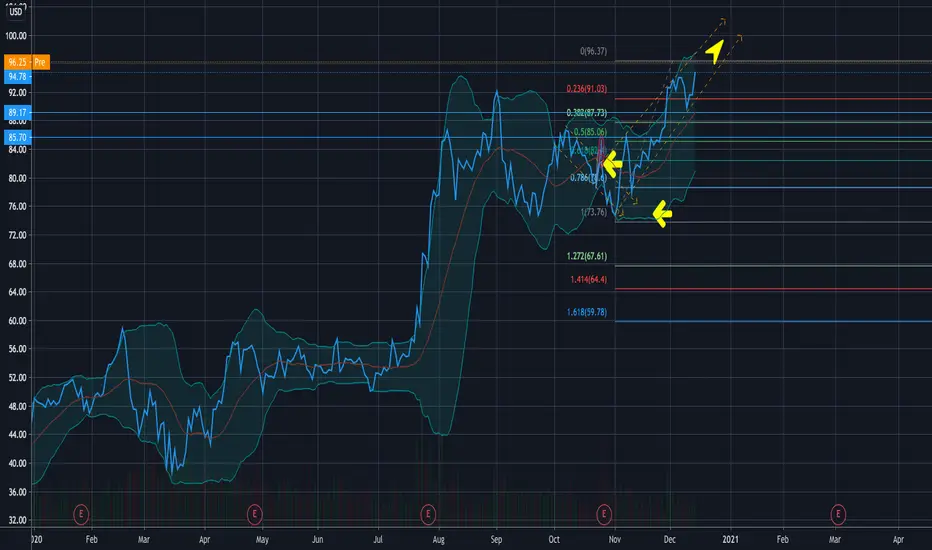
AMD Showing Bullish Signs of Major Potential Breakout$AMD ate a rough correction (outlined in the previous descending channel) before catching a wedge that shows all the signs of a major breakout. The downward trough also established a lot of relative strength in this stock. It refused to dip lower than its previous relative-low.
This stock ranks a perfect 99 on Investor Business Daily's stock evaluation, and it gained well yesterday in a rougher day for the overall market. Its fundamental stats all scream good things: 0,75 EPS and a P/E of 52.12. The P/E seems somewhat high, but it is likely indicative of the upcoming earnings (on February 2nd) report anticipated to be a great one.
Note the NEW strong (VERY STRONG) ascending trade channel.
Next: Target take-profit points?
We are tentatively eyeing 98.5 per share as a 1/2 profit snatch; the latter should loom around 100-102.
That said, a mega-long-term hold of AMD also makes sense, if that's your cup of tea. Regardless of approach, this stock is showing all bullish indications of having a quite big week.
GL etc etc
-BDR
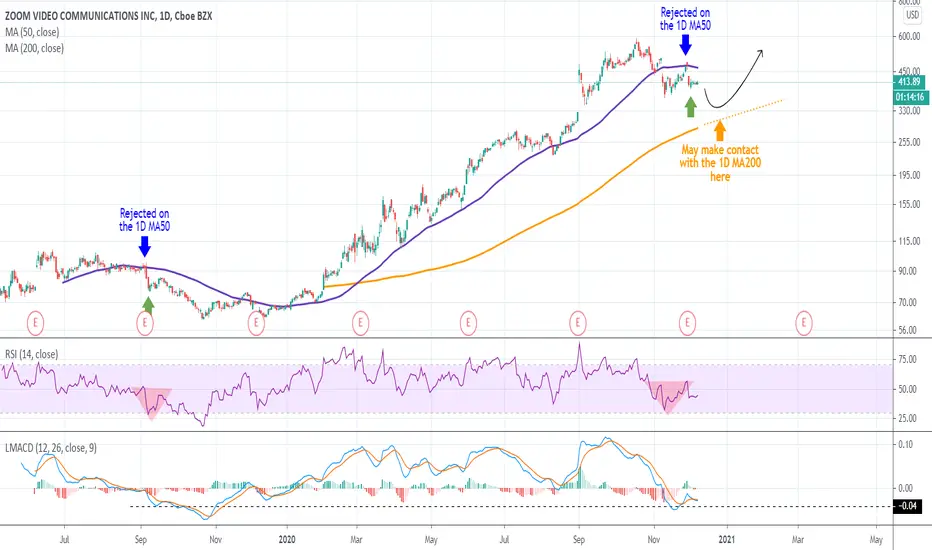
ZOOM Some pressure left before recoveringZM got rejected last week on the 1D MA50 and this is not an encouraging development. The reason is that it brings back memories of the last 1D MA50 rejection on September 06 2019. At that time, it took ZOOM three-four months before it started rising (we all know the parabolic rise more than made up for this 4 month waiting). Even the RSI is printing a similar pattern.
In my opinion in order to buy ZOOM, I want to either see the 1D MA200 being tested and hold or a weekly close above the 1D MA50. Next Target $800.
** Please support this idea with your likes and comments, it is the best way to keep it relevant and support me. **
--------------------------------------------------------------------------------------------------------
!! Donations via TradingView coins also help me a great deal at posting more free trading content and signals here !!
🎉 👍 Shout-out to TradingShot's 💰 top TradingView Coin donor 💰 this week ==> TradingView
--------------------------------------------------------------------------------------------------------
AX.SZLHello investors
were hopefully starting to see the bottom of the correction. in line with the opportunistic bullish count of the Nasdaq and tech indexes which are all oversold and edging to push higher. if if only a corrective wave (2)
cheers
limitlesss

Market EXTREMELY complacent right now; long VIX "Be fearful when others are greedy" - Warren Buffet.
More applicable now than ever !
I've looked at the put/ call ratio as well as VIX which reflect extreme greed and a broken market. This type of euphoria that "stocks can never go down" is only a belief of dumb money and a strong indication of a top.

StockMarket Update (#47) : Going Extreme Greed !Hope this idea will inspire some of you !
Don't forget to hit the like/follow button if you feel like this post deserves it ;)
That's the best way to support me and help pushing this content to other users.
Kindly,
Phil

Relative Strength: Tech is topping out vs. financialsChange in leadership from tech (growth) to financials (cyclical)
