BROADCOM's 15 year chart is why you will regret not buying now.Broadcom Inc. (AVGO) has been on a strong correction in the past 4 months, completing so far 3 straight brutally red 1M (monthly) candles since January, having broken below its 1W MA50 (blue trend-line).
This month, it hit its 1W MA100 (green trend-line) for the first time since November 2022. This is a key Support level as it is AVGO's main Support during Bull Cycles that historically has only broken during Bear Cycles.
In fact, the stock has been trading within a 15-year Channel Up since it's IPO. And this is the reason why this correction is a blessing in disguise for long-term investors. The 1W MA100 was intact during the previous historic Bull Cycle from May 2013 to July 2018. So since we tested it now, there is a far stronger probability of it holding and extending the Bull Cycle that started on the October 2022 Low, than turning into a Bear Cycle.
Notice also how symmetric the rises have been within this Channel Up. The 2012 - 2015 rise has been +500% before the 1W MA50 was breached again. Similarly, AVGO has grown by +500% again from the October 2022 bottom to the recent All Time High, before it broke last month again below the 1W MA50.
If this is a new Low similar to August 2015, then we can expect an equally symmetric follow up rise of +178.64% in the next 2 years. This gives us a rough long-term Target of $380.
-------------------------------------------------------------------------------
** Please LIKE 👍, FOLLOW ✅, SHARE 🙌 and COMMENT ✍ if you enjoy this idea! Also share your ideas and charts in the comments section below! This is best way to keep it relevant, support us, keep the content here free and allow the idea to reach as many people as possible. **
-------------------------------------------------------------------------------
💸💸💸💸💸💸
👇 👇 👇 👇 👇 👇
Techstocks

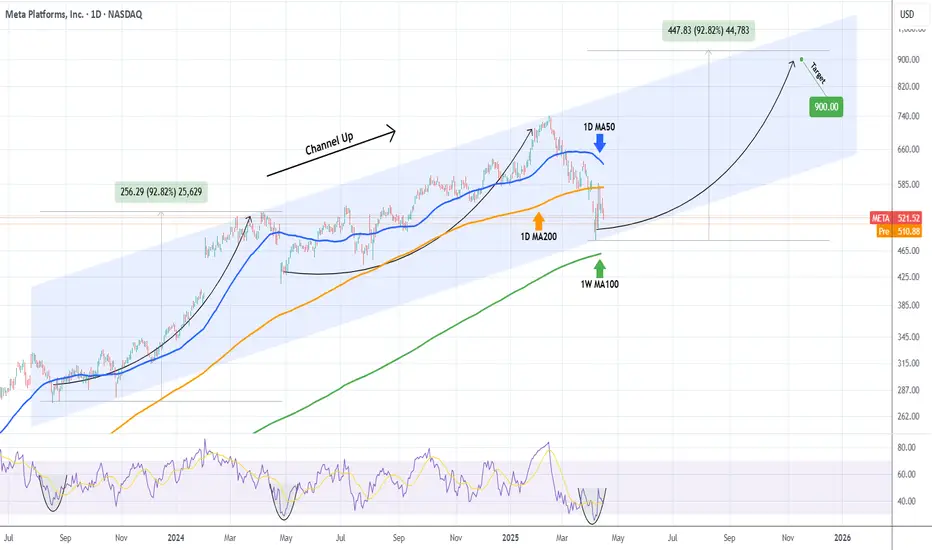
META Slow recovery but $900 possible this yearMeta Platforms (META) had a strong -35% correction in the past two months, dipping even below its 1D MA200 (orange trend-line). By doing so, it reached the bottom (Higher Lows trend-line) of the 2-year Channel Up and rebounded instantly.
The rebound has stopped so far on the 1D MA200 where it got rejected. This keeps the market neutral and the long-term bullish sentiment can only be resumed if the market breaks and closes above its 1D MA50 (blue trend-line). Until then we are neutral but only as long as the 1W MA100 (green trend-line) holds, below it the bearish trend is resumed and the correction can potentially reach -50% to -70%.
If however we close above the 1D MA50, expect a +90% rally, similar to the first Bullish Leg of the Channel Up, slow at start but aggressive after half point. Target $900.
-------------------------------------------------------------------------------
** Please LIKE 👍, FOLLOW ✅, SHARE 🙌 and COMMENT ✍ if you enjoy this idea! Also share your ideas and charts in the comments section below! This is best way to keep it relevant, support us, keep the content here free and allow the idea to reach as many people as possible. **
-------------------------------------------------------------------------------
💸💸💸💸💸💸
👇 👇 👇 👇 👇 👇
AMAZON is on its 3rd historic +1000% growth Bull Cycle.Amazon (AMZN) almost has been trading within a multi-year Channel Up pattern since the Housing Bubble bottom in November 2008 and this month almost touched its 1M MA50 (blue trend-line).
With the exception of the 2008 Housing Crisis and the 2022 Inflation Crisis, which bottomed on the 1M MA100 (green trend-line), the 1M MA50 has never been broken. In fact it has been the key Support of every Bull Cycle that surprisingly has so far peaked on a +1051% rise.
As you can actually see by the 1M RSI, such corrections, like the one in the past 3 months, are quite common within the Channel Up and offer excellent long-term buy entries.
So, technically the Inflation Crisis bottom (December 2022) on the 1M MA100 has initiated Amazon's 3rd historic Bull Cycle within this pattern and based on the previous two, it may also peak after a +1051% rally inside 2028. Our projected Target on this is $900.
Would you miss out on such an opportunity in the past?
-------------------------------------------------------------------------------
** Please LIKE 👍, FOLLOW ✅, SHARE 🙌 and COMMENT ✍ if you enjoy this idea! Also share your ideas and charts in the comments section below! This is best way to keep it relevant, support us, keep the content here free and allow the idea to reach as many people as possible. **
-------------------------------------------------------------------------------
💸💸💸💸💸💸
👇 👇 👇 👇 👇 👇

Is The Blood Bath Over???✅ 🎯 The Roundhill Magnificent 7 ETF CBOE:MAGS has indeed reached the anticipated retrace level of low $40's, as expected and the reaction off of this level was quite bullish.
Examining the two-week chart, the price has just closed with a prominent pin or doji bar, however you want to call it, signaling a potential pivot point. Additionally, there is a bearish 2W Time@Mode set to expire by the end of the month, further supporting the possibility of a near-term bounce or consolidation.
This suggests that the recent downtrend may be nearing its end, at least in the short term. However, price remains below a critical resistance level of $49, meaning any upward movement should be approached cautiously as it may be a potential retest of the range high unless a decisive support/resistance flip occurs.

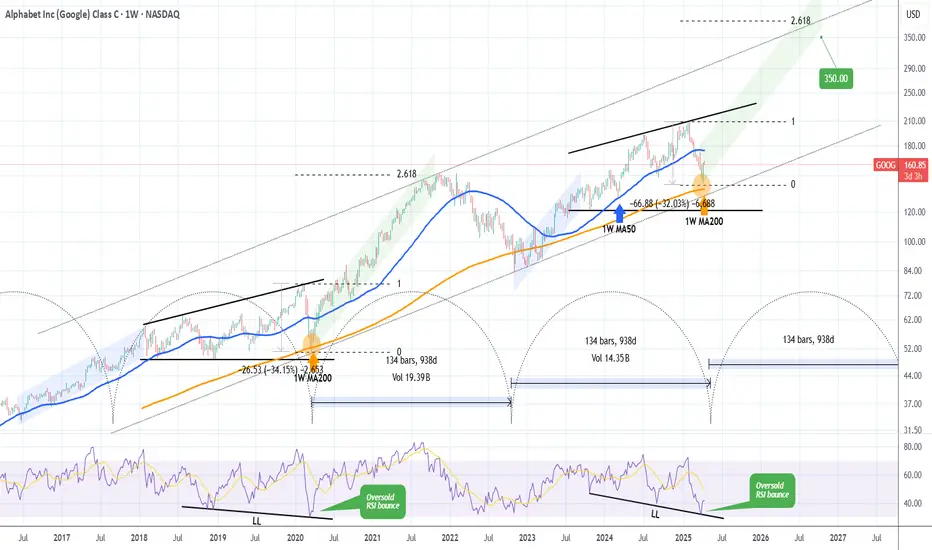
GOOGLE's generational bottom made. This is how it reaches $350.Alphabet Inc. (GOOG) almost tested last week its 1W MA200 (orange trend-line). That level has been holding for more than 2 years (since March 13 2023) and it's been the main Support of the Bull Cycle that followed the November 2022 Inflation Crisis bottom.
The pattern is almost like the Ascending Triangle that led to the March 2020 COVID crash, which was the most recent time before the late 2022 bottom that the stock made contact with the 1W MA200. As you realize, all those times have been what we call 'generational bottoms', thus extremely good long-term buy opportunities. And as you see they've been on extremely tight time symmetry, all took place roughly every 2.5 years.
If the pattern continues to repeat itself, then we may witness a rally (green Channel Up) similar to the one that peaked on November 2021 and reached the 2.618 Fibonacci extension. As a result, setting a $350 Target would be more than realistic based on this pattern.
-------------------------------------------------------------------------------
** Please LIKE 👍, FOLLOW ✅, SHARE 🙌 and COMMENT ✍ if you enjoy this idea! Also share your ideas and charts in the comments section below! This is best way to keep it relevant, support us, keep the content here free and allow the idea to reach as many people as possible. **
-------------------------------------------------------------------------------
💸💸💸💸💸💸
👇 👇 👇 👇 👇 👇
MICROSOFT On 4th largest correction in 15 years. Buy or trap?Microsoft (MSFT) has corrected by -26.50% from its All Time High (ATH), representing the 4th biggest correction since June 2010, which was the first pull-ack after the historic 2008 Housing Crisis.
At the same time the 1W RSI hit the 30.00 oversold limit for the first time since that low of June 2010! Not even the Housing bottom didn't exhibit such low 1W RSI.
All while the current Tariff War correction stopped a little before testing the 1W MA200 (orange trend-line), which has been the long-term Support since 2011 and was last hit (for the 2nd time during that time span) in December 2022 during the previous Inflation Crisis.
As a result, this is a unique long-term buy opportunity for such a tech giant. The 2010 rebound hit the 0.786 Fibonacci level before pulling back while the rally that was initiated after the 2022 Inflation Crisis bottom reached +117.45%.
Based on the above, we have a medium-term Target on MSFT at $440 (Fib 0.786) and a long-term at $700 (+100%).
-------------------------------------------------------------------------------
** Please LIKE 👍, FOLLOW ✅, SHARE 🙌 and COMMENT ✍ if you enjoy this idea! Also share your ideas and charts in the comments section below! This is best way to keep it relevant, support us, keep the content here free and allow the idea to reach as many people as possible. **
-------------------------------------------------------------------------------
💸💸💸💸💸💸
👇 👇 👇 👇 👇 👇

APPLE Best buy opportunity of the last 6 years.Back in August 02 2024 (see chart below), we introduced this model on Apple Inc. (AAPL) that had high probabilities of success at predicting Cycle peaks:
We may have not hit $280 but $260 is close enough especially if you are a long-term investor that values buying low and selling high.
Now that the price has corrected by -35% and just hit the 1M MA50 (blue trend-line) for the first time in almost 10 years (since July 2016), it is time to revisit this macro-model once again.
As you can see, -35% corrections have been present on every Cycle since the January 2009 bottom of the Housing Crisis. The pattern that the stock follows is very specific and it starts with a prolonged correction, the Bear Cycle essentially, which is a lengthy correction phase, such as the 2008 Housing Crisis, the 2015/16 China slowdown and the 2022 Inflation Crisis.
Then a very structured uptrend phase starts in the form of a Channel Up that leads the market to its first peak, followed by a shorter, quicker correction phase that tests the 1M MA50 and rebounds. The rebound is the final bull phase of the Cycle, usually strong and sharp and leads to the eventual Cycle Top and then starts then new Bear Cycle (prolonged correction).
Right now the current 4-month correction is technically, based on this model, the new shorter correction. Being more than -35% in size, the last one larger than this was the previous short correction of the last Trade War in October 2018 - January 2019 (-38%).
The similarities don't stop here but extend to the 1M RSI as well, which just entered its 25-year mega Buy Zone that has been holding since December 2000 and the Dotcom Crash! In fact the last time Apple's 1M RSI was this low was in June 2013, which was the bottom of the 1st short correction on our chart.
This remarkable symmetry just shows how similar the current phase is with its previous ones and if the symmetry continues to hold, we should be expecting a strong recovery to start. Even if the price makes a slightly deeper low as -38% (like the January 2019 bottom), we may still expect the minimum rise that it had all those years shown on the chart, +145%, which translates to a potential $390 Target long-term.
It is in times like this, that patient long-term investors filter out the news noise, make their unbiased moves and maximize their profit.
-------------------------------------------------------------------------------
** Please LIKE 👍, FOLLOW ✅, SHARE 🙌 and COMMENT ✍ if you enjoy this idea! Also share your ideas and charts in the comments section below! This is best way to keep it relevant, support us, keep the content here free and allow the idea to reach as many people as possible. **
-------------------------------------------------------------------------------
💸💸💸💸💸💸
👇 👇 👇 👇 👇 👇

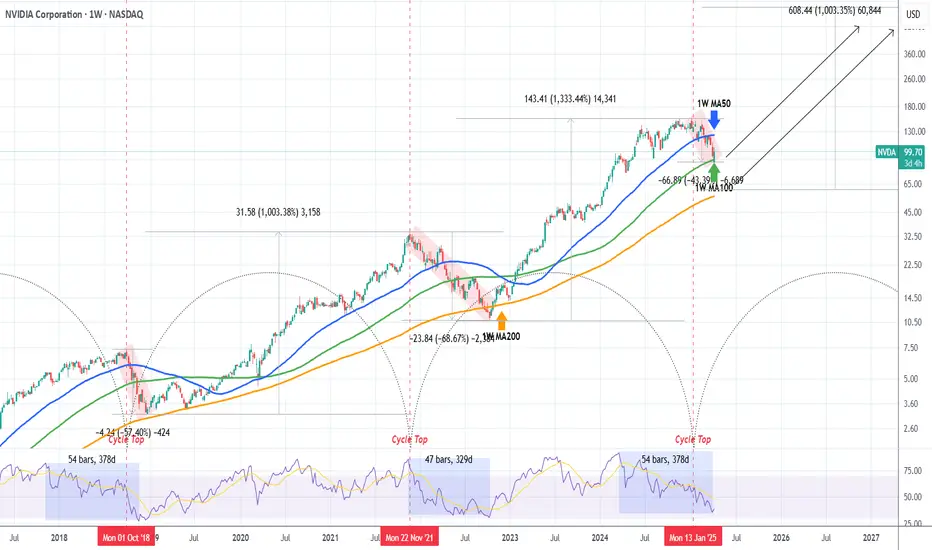
NVIDIA on Bear Market territory. Will the 1W MA100 save the day?NVIDIA Corporation (NVDA) has officially entered Bear Market territory as it has declined by almost -45% from the January 2025 All Time High (ATH) and just hit its 1W MA100 (green trend-line) for the first time since the week of January 30 2023.
This is the strongest correction the stock has seen since the 2022 Inflation Crisis and based on the Time Cycle Indicator of the last two Cycle Tops, the week of Jan 06 2025 falls indeed on the third count. This high degree of symmetry isn't only present on the price action but on the 1W RSI sequence itself as the current time range from the RSI High (March 18 2024) to today's Low is fairly consistent (54 weeks, 378 days) with the top-to-bottom range of the previous two Bear Markets, 2022 and 2018 (red Channel Down patterns).
So far the current correction looks similar to the September - December 2018 as not only their RSI counts are similar but both are more aggressive and fast than the 2022 Inflation Crisis. The 2018 correction though didn't top on the 1W MA100 but almost reached the 1W MA200 (orange trend-line) before making a bottom, but it did so in less than 2 months and declined by -57.40%. The current correction is already running for 3 months.
So what remains to be seen is if the 1W MA100 will manage to hold and kick-start a bullish reversal on its own, despite this correction being 'only' -43.39%. The 1W RSI dropped close enough to 30.00 (the oversold limit) though, which has historically been a very reliable indicator for a long-term buy on NVDA.
If those work in favor of the 1W MA100 holding, expect to see a strong rebound, that will confirm the new Bull Cycle with a break above the 1W MA50 (blue trend-line) and can technically aim for at least a +1000% rise from the bottom, as both previous Bull Cycles did.
If the 1W MA100 fails, we expect a bottom by the end of June 2025 around the 1W MA200 between $65-60. Again a +1000% rise from that level is technically plausible, potentially giving a Target estimate of at least $660.
-------------------------------------------------------------------------------
** Please LIKE 👍, FOLLOW ✅, SHARE 🙌 and COMMENT ✍ if you enjoy this idea! Also share your ideas and charts in the comments section below! This is best way to keep it relevant, support us, keep the content here free and allow the idea to reach as many people as possible. **
-------------------------------------------------------------------------------
💸💸💸💸💸💸
👇 👇 👇 👇 👇 👇
NAS100 Analysis: Reversal Predictions Based on Trading MathDear Trader,
Please find attached my analysis of $Subject, which uses mathematical calculations to identify potential reversal times and price levels.
The analysis details projected south and north price targets (horizontal lines on the chart), along with estimated time frames for possible reversals (vertical lines on the chart, accurate to within +/- 1-2 candles). Please note that all times indicated on the chart, including the vertical lines representing potential reversal times, are based on the UTC+4 time zone.
To increase the probability of these analysis, I recommend monitoring the 5-minute and 15-minute charts for the following key reversal candlestick patterns:
Doji’s
Hammer/Inverted Hammer
Double/Triple Bottom/Top
Shooting Star
Morning Star
Hanging Man
I welcome your feedback on this analysis, as it will inform and enhance my future research.
Regards,
Shunya Trade
⚠️ Disclaimer: This post is educational content and does not constitute investment advice, financial advice, or trading recommendations. The views expressed here are based on technical analysis and are shared solely for informational purposes. The stock market is subject to risks, including capital loss, and readers should exercise due diligence before investing. We do not take responsibility for decisions made based on this content. Consult a certified financial advisor for personalized guidance.

BROADCOM Megaphone bottom hit. Will it hold?Broadcom Inc. (AVGO) has been trading within a Bullish Megaphone pattern since the January 05 2024 Low and this week it hit its bottom (Higher Lows trend-line). This technically concludes the Bearish Leg and should start the new Bullish Leg.
The last Bullish Leg's initial rebound hit the 0.786 Fibonacci retracement level before pulling back again. If the market starts the new one here, which is not as easy as last time as we've already broken below the 1D MA200 (orange trend-line) last week, the immediate Target is 228.50.
-------------------------------------------------------------------------------
** Please LIKE 👍, FOLLOW ✅, SHARE 🙌 and COMMENT ✍ if you enjoy this idea! Also share your ideas and charts in the comments section below! This is best way to keep it relevant, support us, keep the content here free and allow the idea to reach as many people as possible. **
-------------------------------------------------------------------------------
💸💸💸💸💸💸
👇 👇 👇 👇 👇 👇

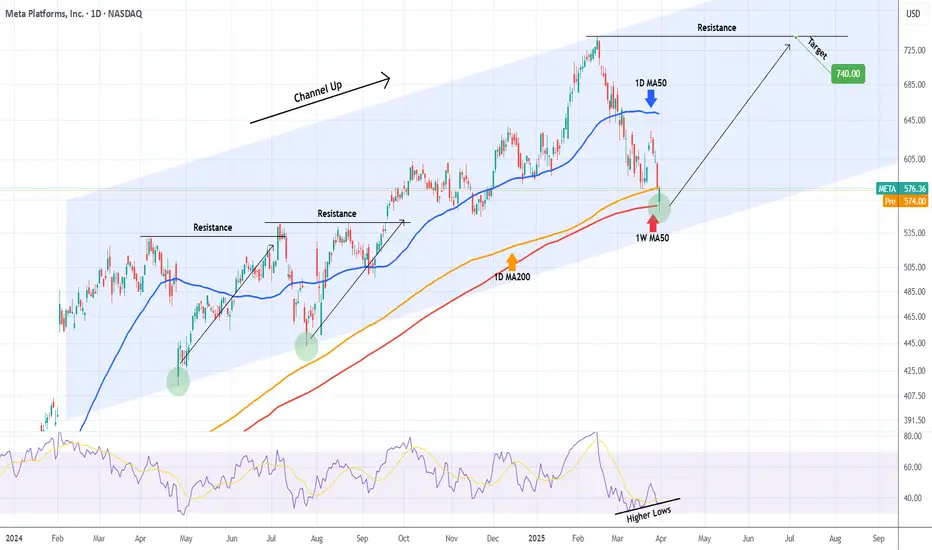
META Can it hold its 1W MA50?Meta Platforms (META) has been trading within a 1-year Channel Up and yesterday it hit its 1W MA50 (red trend-line), breaching the 1D MA200 (orange trend-line) which held the correction last week.
Even though the bottom of the Channel Up is currently $40 lower, holding he 1W MA50 is critical because it has been kept intact since the February 02 2023 bullish break-out.
The first signs are encouraging as the 1D RSI is on Higher Lows, despite the stock's Lower Lows, which is a Bullish Divergence. So as long as this Channel Up bottom Zone holds, we expect META to initiate its new Bullish Leg and test initially its previous Resistance (ATH) as it did on July 05 2024 and August 22 2024. Our Target is $740.
-------------------------------------------------------------------------------
** Please LIKE 👍, FOLLOW ✅, SHARE 🙌 and COMMENT ✍ if you enjoy this idea! Also share your ideas and charts in the comments section below! This is best way to keep it relevant, support us, keep the content here free and allow the idea to reach as many people as possible. **
-------------------------------------------------------------------------------
💸💸💸💸💸💸
👇 👇 👇 👇 👇 👇
PALANTIR Correction is over. Targeting $200 end of year.Last time we viewed Palantir Technologies (PLTR) was 1.5 month ago (February 04, see chart below), setting a $110 Target and then calling to wait for a correction:
The price action didn't disappoint us and after hitting $110 it gave us the desired pull-back that extended as low as the 1D MA100 (green trend-line). Within the 2-year Channel Up, the 1D MA100 has always been a low risk level to buy.
Until however it breaks above its Triangle, a pattern that has been present as an accumulation phase inside the Channel Up on 4 prior occasions, it is possible to see the stock trading sideways towards the 1D MA200 (orange trend-line), not necessarily making a new Low.
Regardless of some more sideways price action or instant break-out above the Triangle, the current level remains an excellent long-term buy opportunity. We are targeting $200, which would almost be a +183% rise, a usual growth rally for the stock within its Channel Up.
-------------------------------------------------------------------------------
** Please LIKE 👍, FOLLOW ✅, SHARE 🙌 and COMMENT ✍ if you enjoy this idea! Also share your ideas and charts in the comments section below! This is best way to keep it relevant, support us, keep the content here free and allow the idea to reach as many people as possible. **
-------------------------------------------------------------------------------
💸💸💸💸💸💸
👇 👇 👇 👇 👇 👇

TESLA formed the new bottom and is going for $600.Tesla / TSLA is on the 2nd straight green 1week candle, crossing above the 1week MA50.
With the 1week RSI bouncing on the 2 year Rising Support, the Channel Up has technically formed its new bottom.
Both the current and the previous one were formed on the 0.618 Fibonacci retracement level after a -55% decline.
If the bullish wave is also as similar as the bearish waves have been, the price should reach as high as the -0.382 Fib extension.
Buy and target the top of the Channel Up at $600.
Follow us, like the idea and leave a comment below!!

Angi | ANGI | Long at $20.05***New analysis / price targets given the recent 1/10 split:**
The historical simple moving average (SMA) I've selected for Angi (formerly Angie's List Inc) NASDAQ:ANGI is starting to enter stock price. This often means a directional change in price: up in this case. The price drop after the last earnings, I believe, was an algorithmic move for price entry/further consolidation. If true, the two large gaps above may be filled in the future. 70M float, 20% short interest...
Fundamentally, Angi maintains a solid financial foundation with $395 million in cash and cash equivalents. The company's free cash flow increased $29.2 million to $78.4 million for the first nine months of 2024, demonstrating strong cash generation capabilities. The company's transition to a consumer choice model, already successful in its European operations, positions Angi to capture greater market share. Despite revenue headwinds, Angi demonstrates robust financial health with operating income increasing to $7.8 million in third-quarter 2024, a significant improvement from the previous year. The company's adjusted EBITDA grew 27% to $35.4 million, while year-to-date operating income reached $20 million with adjusted EBITDA rising 47% to $114 million, showcasing effective cost management and improving operational efficiency.
Thus at $20.05, NASDAQ:ANGI is in a personal buy zone (this is the adjusted price from the original entry in December 2024 at $2.00, post 1/10 split). There absolutely could be more downside aside for this stock, but it is a personal buy and hold for the coming years (unless fundamentals drastically change).
Targets:
$22.50
$25.00
$30.00
$37.00

GOOGLE Bottom confirmed. Laying eyes on $220.Alphabet Inc. (GOOG) has been trading within a Channel Up since the July 10 2024 High. Last week, the Bearish Leg touched the pattern's bottom, completing a -23.92% decline from the top, which is almost symmetrical to the previous Bearish Leg (-23.32%).
At the same time the 1D RSI got oversold (<30.00) and recovered on a Bullish Divergence, while the 1D MA50 (blue trend-line) crossed below the 1D MA100 (green trend-line), forming a Bearish Cross. Last time we had this formation was September 06 2024 and 1 day later, the bottom (Higher Low of the Channel Up) was formed.
Among all this, the 1W MA100 (red trend-line) is holding, which is the market's long-term Support since July 12 2023. As a result, we expect the new Bullish Leg to start and as the previous one did, target the 1.236 Fibonacci extension at $220.00.
-------------------------------------------------------------------------------
** Please LIKE 👍, FOLLOW ✅, SHARE 🙌 and COMMENT ✍ if you enjoy this idea! Also share your ideas and charts in the comments section below! This is best way to keep it relevant, support us, keep the content here free and allow the idea to reach as many people as possible. **
-------------------------------------------------------------------------------
💸💸💸💸💸💸
👇 👇 👇 👇 👇 👇

Meta Platforms (META): A Leading Force in AIKey Supporting Arguments
Deploying AI tools enhances user engagement, drives up ad revenue, and strengthens Meta’s profit margins.
Meta's in-house development of AI chips is poised to lower capital outlays associated with purchasing Nvidia chips and diminish the costs involved in developing proprietary AI models.
Meta's stock has approached a support level, suggesting a potential reversal in its price trajectory.
Investment Thesis
Meta Platforms (META) stands as one of the world’s largest technology companies, specializing in social media, digital advertising, and AI development. It owns major platforms like Facebook, Instagram, WhatsApp, and Messenger, which together engage over 3.3 billion users daily. While advertising remains its primary revenue stream, the company is strategically investing in emerging areas such as generative AI and augmented reality.
Continued Commitment to AI Development as a Key Growth Driver. Meta is strategically channeling investments into AI, spearheading the development of open-source Llama models and deploying generative content across its social platforms. These advancements are anticipated to enhance targeting precision and bolster user engagement, subsequently driving a surge in advertising revenue. In 2025, the company intends to allocate up to $65 billion toward AI infrastructure, reinforcing its leadership stature in the competitive AI market.
Focus on Proprietary AI Chips to Lower Capital Costs and Enhance AI Model Development. Meta has initiated trials of its proprietary AI training chip, marking a significant move toward minimizing reliance on suppliers like Nvidia. This new chip is tailored for specific AI tasks, offering enhanced energy efficiency over conventional graphics processing units. By developing its own chips, the company stands to lower expenses and potentially capitalize on the burgeoning demand for AI processing by selling surplus capacity.
Stock May See a Rebound from Current Levels. Following the market correction triggered by concerns over a deteriorating macroeconomic landscape in the United States, the company's share price is stabilizing around the $600 mark. We anticipate that this threshold may establish itself as a significant support level, potentially serving as a springboard for the shares to rebound and continue their upward trajectory. Furthermore, the relatively modest forward P/E ratios, approximately 21-23x, underscore the oversold condition of Meta shares and suggest a possible reversal.
Our price target for META over a 2-month horizon is $685, accompanied by a "Buy" recommendation. We advise setting a stop-loss at $530.

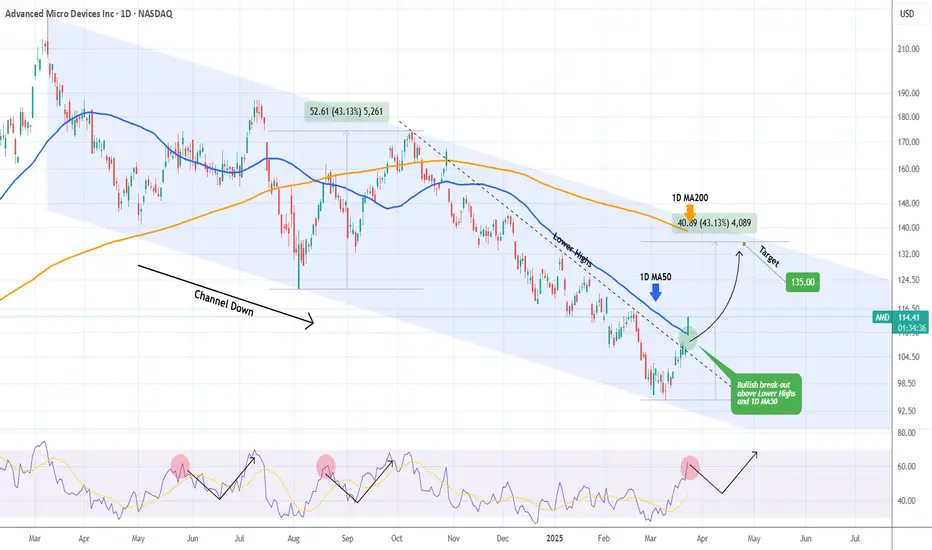
AMD broke above its 1D MA50. Is the trend finally changing?Advanced Micro Devices (AMD) broke today above its 1D MA50 (blue trend-line) for the first time in almost 5 months (since October 29 2024)! From that day after it has also been below a Lower Highs trend-line, basically the Bearish Leg of the 1-year Channel Down, which it marginally broke last week but today it smashed it.
A short-term pull-back based on the 1D RSI symmetry (with the August 20 2024 and May 28 2024 Highs) is possible but on the long-term we expect a full recovery on this Bullish Leg of at least +43.13% (like the August - September Leg).
As a result, we expect a 1D MA200 (orange trend-line) test at $135.00.
-------------------------------------------------------------------------------
** Please LIKE 👍, FOLLOW ✅, SHARE 🙌 and COMMENT ✍ if you enjoy this idea! Also share your ideas and charts in the comments section below! This is best way to keep it relevant, support us, keep the content here free and allow the idea to reach as many people as possible. **
-------------------------------------------------------------------------------
💸💸💸💸💸💸
👇 👇 👇 👇 👇 👇
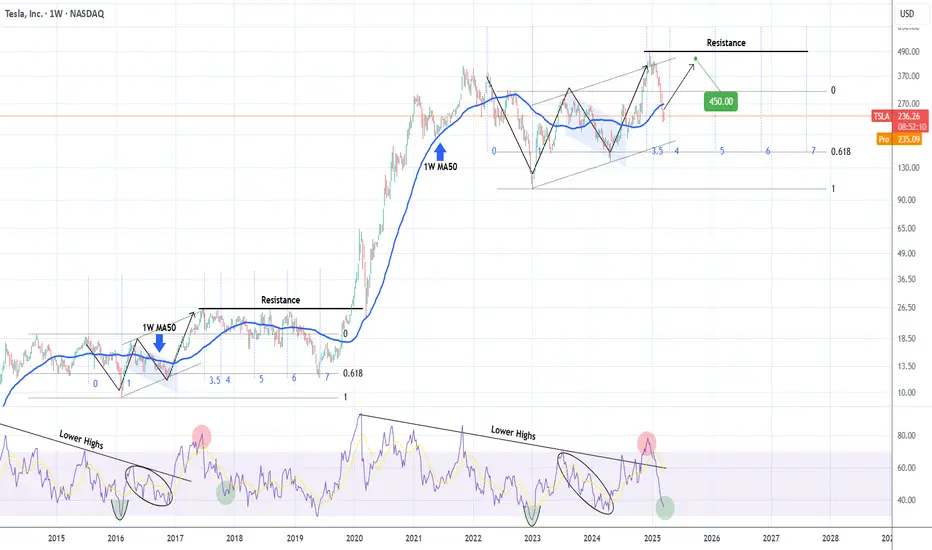
TESLA pricing its long-term bottom. $450 rebound highly likely.Nine months ago (June 26 2024, see chart below), we signaled the start of an enormous rally on Tesla (TSLA), which eventually hit our minimum Target ($400), based on a fractal from 2014 - 2016:
Since the upper 1.382 Fib Target wasn't achieved, the model is readjusted and this count makes better sense. Based on the 1W RSI we are on a bottom similar to October 30 2017 around the 4.0 Time Fib extension. That past sequence initiated a rebound towards the market Resistance before the next decline headed to the 5.0 Fib extension.
As a result, we believe Tesla will find a bottom here and target $450 just below the Resistance level.
-------------------------------------------------------------------------------
** Please LIKE 👍, FOLLOW ✅, SHARE 🙌 and COMMENT ✍ if you enjoy this idea! Also share your ideas and charts in the comments section below! This is best way to keep it relevant, support us, keep the content here free and allow the idea to reach as many people as possible. **
-------------------------------------------------------------------------------
💸💸💸💸💸💸
👇 👇 👇 👇 👇 👇
$MAGS: Magnificent Seven ETF – Tech Titan or Overhyped?(1/9)
Good afternoon, everyone! ☀️ CBOE:MAGS : Magnificent Seven ETF – Tech Titan or Overhyped?
With MAGS at $46.85, is this ETF a powerhouse of tech giants or just another bubble waiting to burst? Let’s decode the code! 🔍
(2/9) – PRICE PERFORMANCE 📊
• Current Price: $ 46.85 as of Mar 18, 2025 💰
• Recent Move: Likely up, reflecting tech sector strength, per data 📏
• Sector Trend: Tech stocks soaring with AI and cloud hype 🌟
It’s a tech fest—let’s see if it’s worth the buzz! ⚙️
(3/9) – MARKET POSITION 📈
• Market Cap: Approx $1.87B (assuming 40M shares) 🏆
• Operations: Tracks Apple, Microsoft, Amazon, Alphabet, Meta, Tesla, Nvidia ⏰
• Trend: Dominant players in tech, driving innovation and market trends 🎯
Firm in the heart of Silicon Valley! 🚀
(4/9) – KEY DEVELOPMENTS 🔑
• Tech Rally: Magnificent Seven companies hit new highs, per data 🌍
• Earnings Season: Strong Q4 results from underlying firms, per posts on X 📋
• Market Reaction: MAGS up, reflecting sector momentum 💡
Navigating through tech’s highs and lows! 🛢️
(5/9) – RISKS IN FOCUS ⚡
• Regulatory Scrutiny: Antitrust concerns for big tech players 🔍
• Market Volatility: Tech stocks prone to swings due to innovation and competition 📉
• Economic Factors: Interest rates and global economic conditions impact growth ❄️
It’s a risky ride—buckle up! 🛑
(6/9) – SWOT: STRENGTHS 💪
• Industry Leaders: The Magnificent Seven are pioneers in their fields 🥇
• Growth Potential: AI, cloud computing, and other tech trends fuel expansion 📊
• Dividend Payouts: Some companies offer dividends, adding income potential 🔧
Got the best of both worlds! 🏦
(7/9) – SWOT: WEAKNESSES & OPPORTUNITIES ⚖️
• Weaknesses: High valuations, potential for overinvestment 📉
• Opportunities: Emerging technologies like quantum computing, biotech integration, per strategy 📈
Can they stay ahead of the curve? 🤔
(8/9) – POLL TIME! 📢
MAGS at $46.85—your take? 🗳️
• Bullish: $50+ soon, tech’s unstoppable 🐂
• Neutral: Steady, risks balance gains ⚖️
• Bearish: $40 looms, overhyped and due for correction 🐻
Chime in below! 👇
(9/9) – FINAL TAKEAWAY 🎯
MAGS’s $46.85 price reflects the dynamism of the tech sector 📈, but with risks from valuations and regulatory pressures 🌿. DCA-on-dips could be a strategy to manage volatility. Gem or bust?

Zscaler: BalancedZS has seen buyers and sellers largely balancing each other recently, preventing any significant moves in either direction. As a result, we continue to place the stock in a corrective rally as part of the magenta wave , with its high anticipated above the $259.61 resistance. However, if the price falls below the $153.70 support, the ongoing corrective structure will extend further, with the turquoise wave alt.X establishing a new low. This alternative scenario carries a 35% probability.

QQQ bounce off support???QQQ looks to have found some footing on the support line of the channel. It will be interesting to see if we get a counter rally up to test the 200 day SMA.

MICROSOFT Channel Down bottom formation targets $440.Microsoft (MSFT) has been trading within a Channel Down since the July 05 2024 High. The stock is on its latest Bearish Leg in the past 3 months and almost completed a -17.62% decline, similar with the Bearish Leg that led to the August 05 2024 Low.
As the 1D RSI has Double Bottomed, which is what it did on the April 30 2024 Low that kick started a rally of +20.63%, we expect the stock to initiate its new Bullish Leg of the Channel. The previous one was +18.16%, so we expect a similar range and target $440.
-------------------------------------------------------------------------------
** Please LIKE 👍, FOLLOW ✅, SHARE 🙌 and COMMENT ✍ if you enjoy this idea! Also share your ideas and charts in the comments section below! This is best way to keep it relevant, support us, keep the content here free and allow the idea to reach as many people as possible. **
-------------------------------------------------------------------------------
💸💸💸💸💸💸
👇 👇 👇 👇 👇 👇

NVDA Short Term BuyPrice is currently consolidating within a tight range, and a breakout appears imminent. I am looking for a clean break above resistance, followed by a retest of the breakout level, which could provide a strong buy opportunity. If this setup plays out, the next key target would be the $135 level.
However, this move is likely to be a short-term retracement within a larger downtrend. If price struggles to sustain momentum above $135 and shows signs of weakness, it could indicate a continuation of the broader bearish trend. Confirmation will come from price action signals and volume dynamics on the retest.
