LC 1W: When the Market Spreads Its WingsOn the weekly chart of LendingClub (LC) , a “golden cross” has formed - the MA50 crossing above the MA200 from below, confirming a medium-term trend shift in favor of buyers. The current price of 15.30 is trading within the 0.705–0.79 Fibonacci zone (14.54–15.32), which now acts as a key support after the breakout. Structurally, the asset is moving within a broadening ascending channel, suggesting potential for increased volatility and range expansion.
Technically, the market shows strength: the upward impulse was accompanied by an abnormal spike in volume, both MA50 and MA200 are positioned below the price, and the nearest resistance is at 17.26 (1.0 Fibonacci level). A breakout above this area opens the way to the 1.618 extension at 22.95–23.02. The scenario is invalidated if the price closes below 12.65, which would pull it back into the previous descending structure.
Fundamentally, LendingClub benefits from easing tensions in the US debt market and moderate growth in consumer lending. Positive earnings momentum and the resilience of its business model add further confidence to the bulls.
Tactical plan: as long as the price holds above 14.54–15.32, the medium-term growth scenario remains valid, targeting 17.26 and 23.02. The optimal entry would come after confirming the support hold and spotting a local reversal candlestick pattern on the daily timeframe.
As they say, a golden cross isn’t just an indicator - it’s a first-class ticket to the trend league. Just make sure you don’t miss the flight.
Tehnicalanalysis

SUI/USD Technical Analysis – Potential Reversal Zone IdentifiedSUI/USD Technical Analysis – Potential Reversal Zone Identified
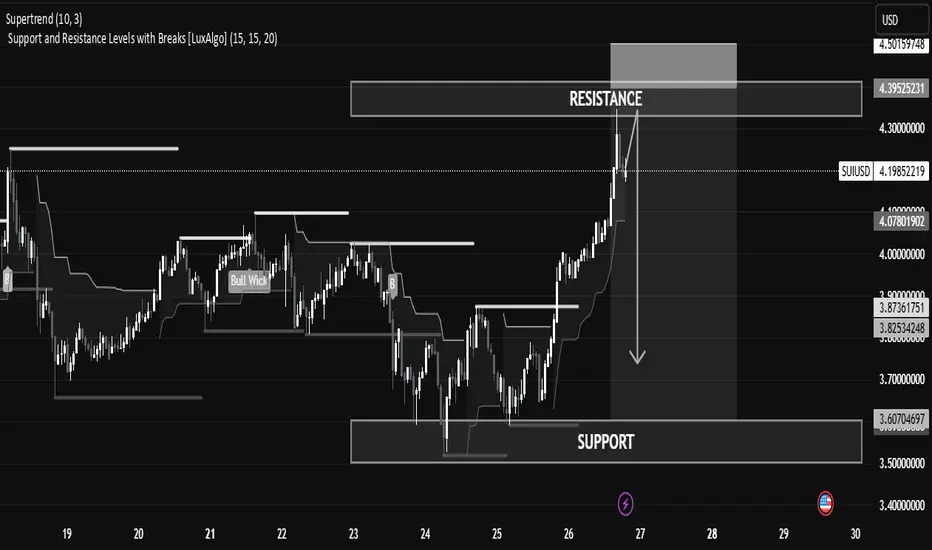
The current SUI/USD price action shows a strong bullish impulse reaching into a well-defined resistance zone, suggesting a potential pullback or reversal in the short term.
🔍 Key Levels
Resistance Zone: Between 4.30 – 4.39 USD, currently being tested after a strong bullish run. This is a historical supply area where price previously reversed.
Support Zone: Found between 3.60 – 3.70 USD, where price consolidated and accumulated before initiating the current rally.
Current Price: 4.2044 USD, slightly below the resistance zone, showing early signs of rejection.
📊 Technical Indicators & Structure
Supertrend (10,3): Bullish signal still active, suggesting trend strength, though traders should be cautious near resistance.
Break of Structure (BoS): Clean upward breaks suggest buyer dominance, but profit booking or sell-side liquidity may emerge near resistance.
Volume & Momentum: Impulse candles show strength, but volume tapering near resistance could indicate exhaustion.
📘 Educational Perspective
This setup highlights the importance of trading within key zones:
Buying at support, where demand is strong.
Monitoring resistance for signs of exhaustion or reversal patterns like wicks, doji, or bearish engulfing.
Risk Management Tip: In such cases, aggressive traders might short from resistance with tight stops, while conservative traders wait for confirmation (e.g., break and retest of the support or resistance).
Ethereum at Crucial Resistance – Will the Bulls Hold or Fade?Ethereum at Crucial Resistance – Will the Bulls Hold or Fade?”
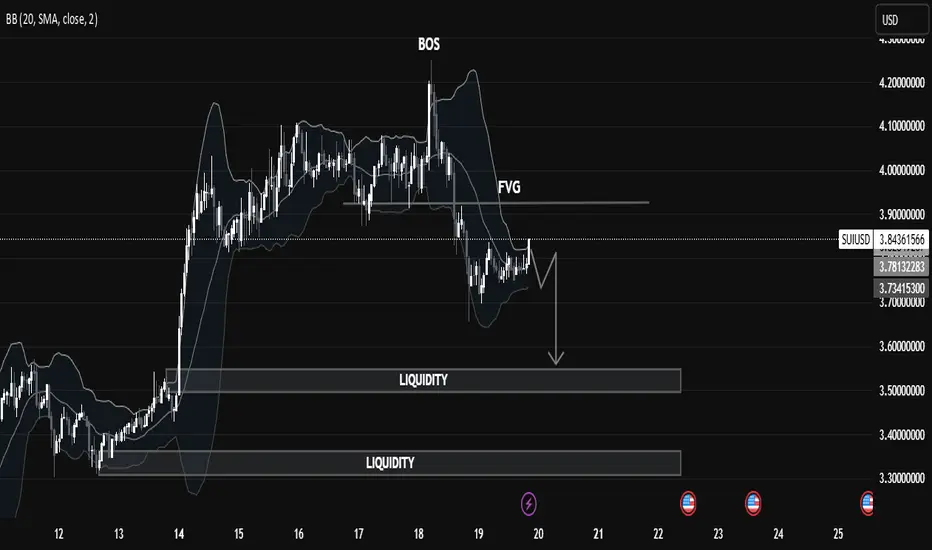
Ethereum is currently trading near a key resistance zone around $3,800, as marked on the chart. After a strong bullish rally with clear Break of Structures (BOS) along the way, ETH has now reached an extended point where price may face selling pressure.
The Bollinger Bands are stretched, showing overextension, and the marked arrow suggests a possible correction or pullback from this level. A retest of previous support zones (~$3,400–$3,200) could be expected if the resistance holds.
⸻
Key Levels:
• 🔼 Resistance: ~$3,800
• 🔽 Support: ~$3,400 / ~$3,000
• 🔄 Price Action: Watching for rejection or breakout confirmation
This is a textbook case of price approaching a strong resistance level after a bullish wave, where caution and confirmation are key for the next move.

SUIUSD Liquidity Trap in Motion: Price Targeting Deeper Pools🧠 Market Structure Insight (SMC Framework)
🔍 1. Break of Structure (BOS):
The most recent BOS around the $3.95 level marked a bull trap, indicating a transition from bullish momentum to a distribution phase. This suggests institutional players offloaded liquidity at premium prices before initiating a markdown.
🕳️ 2. FVG (Fair Value Gap):
A visible Fair Value Gap (Imbalance) remains unmitigated above the current price action. This zone acted as a supply area, where price sharply moved down, leaving inefficiency in its trail—now serving as a potential point of rejection if revisited.
📌 Liquidity Zones:
Upper Liquidity Cleared: Price has swept highs before reversal (a sign of engineered liquidity grab).
Double Liquidity Pools Below:
First pool: Around $3.55 - $3.60
Second pool: Deep liquidity around $3.30 - $3.35
These levels are highly attractive for Smart Money to target next, suggesting continuation to the downside.
📉 Current Price Behavior:
Market is consolidating in a tight range just below FVG, signaling potential re-accumulation of sell orders.
The chart pattern suggests a potential lower high forming, likely to precede a bearish leg towards liquidity zones.
Bollinger Bands show compression, hinting at volatility expansion soon.
🎯 Trade Outlook (Not Financial Advice):
🔻 Bearish Bias:
Unless price breaks above the FVG zone with strong bullish momentum, the probability favors a bearish continuation targeting:
1st Target: ~$3.55
2nd Target (Deeper liquidity grab): ~$3.30
A rejection from FVG followed by a BOS to the downside would serve as confirmation for this bias.
📚 Educational Takeaway:
This chart is a clean illustration of Smart Money Concepts in play:
BOS > FVG > Liquidity Sweep
Price respects institutional footprints: grab liquidity, fill imbalances, then drive toward untouched liquidity zones.
Recognize market intent through structure shifts and imbalance reaction.
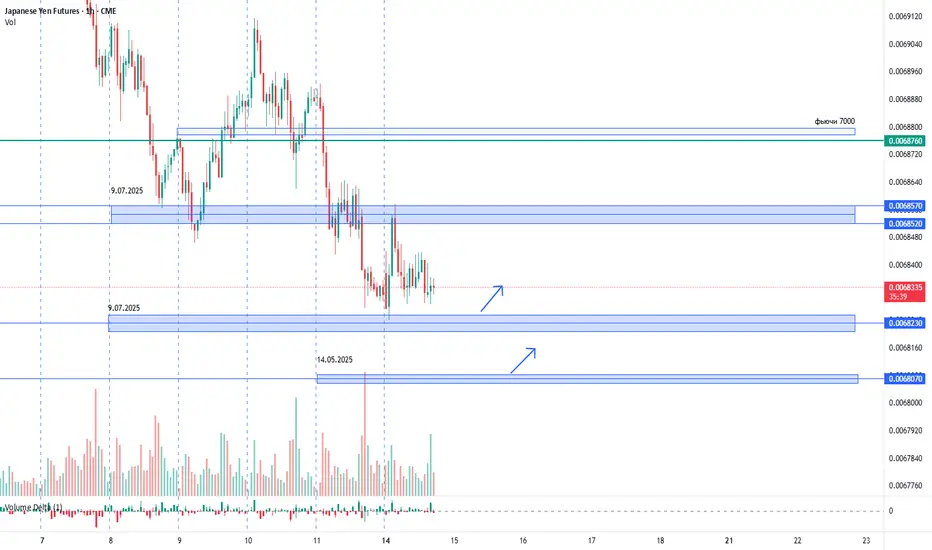
USDJPY. 14.07.2025. The plan for the next few days.The nearest interesting resistance zones have already been worked out at night and have given a good reaction. Let's mark the others where we can expect a reaction. It's not certain that there will be a major reversal, but I believe we will see a correction that can be monetized. We are waiting for a reaction and looking for an entry point.
The post will be adjusted based on changes.
Don't forget to click on the Rocket! =)
GOLD 4H: not all that glitters is bullish...The 4H chart shows a clean descending triangle breakdown. Price failed to reclaim the trendline and was rejected under both MA50 and MA200. The bounce into 3325–3340 was absorbed — classic liquidity sweep and fade. Volume confirms bearish control.
Technically, the breakdown below 3320 opens the way toward $3293 (1.0 Fibo), $3250 (1.272 extension), and final target at $3195 (1.618), where buyers might step in. RSI supports the continuation without signs of reversal. Structure broke — and the market is telling us where it's heading.
Tactical plan:
— Entry at market or on a retest of $3325–3335
— Targets: $3293 → $3250 → $3195
— Stop: above $3340 (above MA50 and broken trendline)
When gold looks shiny, smart traders look deeper. This breakout isn’t golden — it’s a trap for late bulls.

BTCUSD Analysis | Bearish Setup Unfolding?Bitcoin is trading within a descending channel, respecting lower highs and lower lows. The recent price action shows a sharp bounce from the $98,600 support zone, but the bigger picture still hints at potential downside.
🔍 Key Technical Insights:
Descending Channel remains intact – structure suggests bearish continuation.
Price bounced from $98,626 support, but is struggling below key resistance at $108,622.
A possible lower high formation near $106K–$107K could trigger the next drop.
Bearish projection remains valid if price fails to break above the descending trendline.
🟢 Upside Scenario: If bulls manage to break above $109K resistance, we could see a bullish reversal.
🔴 Downside Target: If the bearish setup confirms, we may revisit the $98,000–$99,000 support area once again.
📌 Plan Accordingly:
Wait for price action confirmation near resistance. Patience pays in volatile zones like this!
#BTCUSD #Bitcoin #CryptoAnalysis #TradingView #BTCUpdate #CryptoTrader #TechnicalAnalysis

EUR/USD Biases (Long, Short, and Today’s View)EUR/USD Trading Biases: Navigating Bullish Momentum and Key Resistance Zones
This will be a concise market analysis essay (around 600–700 words) suitable for a financial audience, such as forex traders or analysts. Let me begin:
EUR/USD Trading Biases: Navigating Bullish Momentum and Key Resistance Zones
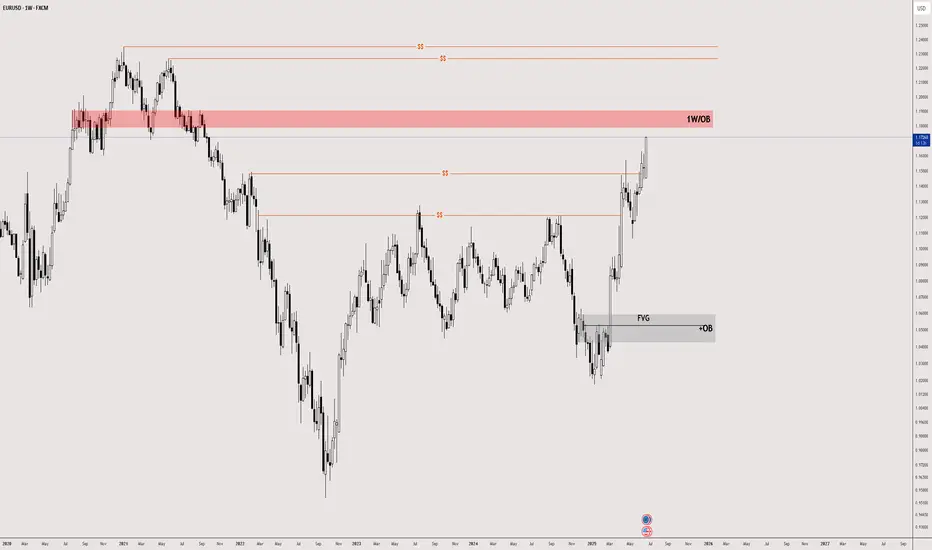
The EUR/USD pair, one of the most actively traded currency pairs in the forex market, has exhibited strong bullish momentum in recent sessions. As of June 26, 2025, the euro’s ascent against the dollar has brought it to a critical juncture, testing significant technical and psychological resistance levels. Traders are now weighing the potential for continued upside against growing signals of exhaustion and looming fundamental catalysts.
Bullish Outlook: A Technically Supported Advance
From a technical perspective, the bullish case for EUR/USD remains compelling. The pair is entrenched in a sustained uptrend, marked by successive breakouts above prior resistance levels and validated by daily and weekly closes above 1.1600. The current price action is converging on a crucial supply zone located between 1.1700 and 1.1900—an area historically known for triggering reversals but also pivotal in confirming trend continuation if broken convincingly.
Technical indicators further bolster the bullish narrative. The Relative Strength Index (RSI), while approaching overbought territory, is still supportive of higher prices. The Moving Average Convergence Divergence (MACD) displays a widening bullish histogram, and the Average Directional Index (ADX) confirms trend strength. Near-term resistance lies between 1.1680 and 1.1730, with potential for an extension to 1.1800 should the pair breach this upper band.
On the fundamental front, improved German Ifo business sentiment data has injected optimism into the eurozone outlook. Additionally, easing geopolitical tensions and a broader risk-on sentiment in global markets have undercut the dollar's safe-haven appeal. Speculation over potential Federal Reserve rate cuts further dampens dollar strength, creating tailwinds for EUR/USD.
Bearish Considerations: Resistance and Reversal Risks
Despite the encouraging trend, caution is warranted. The area between 1.1700 and 1.1900 represents a major weekly order block (OB) resistance—territory where several past rallies have lost steam. Oscillators such as the Commodity Channel Index (CCI) and RSI are showing signs of overextension, and the market is now vigilant for reversal patterns or signs of exhaustion.
Fundamentally, while the recent Ifo data is encouraging, it remains below the key threshold of 100, reflecting lingering skepticism about the eurozone's full recovery. Moreover, upcoming U.S. economic releases, particularly GDP figures and jobless claims, could act as potential catalysts for a dollar rebound. Hawkish commentary from Federal Reserve officials could also tilt sentiment, especially if it dampens expectations of rate cuts.
If EUR/USD fails to hold above the 1.1700–1.1730 resistance zone, a corrective move toward 1.1530–1.1500 becomes plausible. Deeper pullbacks could extend toward 1.1470 and 1.1390, especially if risk sentiment reverses or economic data surprises in favor of the dollar.
Today’s View: Bullish with a Note of Caution
For today, June 26, the prevailing bias remains bullish, yet increasingly cautious. The pair is testing the lower end of the 1.1700 OB zone. A decisive break and hold above this level would likely unleash further upside toward 1.1730 and 1.1800. However, overbought conditions and proximity to a known resistance zone suggest that traders should remain alert to potential rejection.
Intraday strategies favor buying on dips above 1.1600–1.1635, with stops placed just below 1.1600 and targets set at 1.1700–1.1730. Conversely, short positions should only be considered if there is a clear rejection from the 1.1700–1.1730 area, with downside targets at 1.1530–1.1500 and stops above 1.1800.
Conclusion
The EUR/USD is currently at a pivotal inflection point. While the bullish trend is intact and supported by both technical and fundamental factors, the proximity to a major resistance zone introduces a layer of complexity. Traders must remain agile—ready to ride a breakout higher if confirmed, but equally prepared to pivot if the pair falters and signals a reversal. In markets like these, timing and confirmation are everything.
[INTRADAY] #BANKNIFTY PE & CE Levels(26/06/2025)Today, Bank Nifty is likely to open slightly gap up near the 56,550–56,600 zone, which is a crucial resistance area. A sustained move above this zone can trigger bullish momentum, opening the door for further upside targets of 56,750, 56,850, and potentially 56,950+. Traders can look for buying opportunities in call options above this range with a tight stop-loss, especially if the index breaks out with strong volume and positive sentiment. The zone between 56,600 and 56,950 has acted as a resistance band in recent sessions, so a clean breakout may lead to a directional rally.
On the flip side, if Bank Nifty fails to hold above the 56,450 mark and starts to trade below it, we may see downside pressure in the market. This breakdown could offer a good short opportunity using put options, with downside targets around 56,250, 56,150, and 56,050. The 56,050 level will act as a strong support and could attract buyers again if tested. Traders should remain cautious near resistance and support zones and avoid aggressive positions unless there is clear confirmation. The market may remain volatile in the first half, so a wait-and-watch approach with disciplined risk management is advisable.

MGY: Technical Breakout + Fundamental Momentum = Quiet Winner?Magnolia Oil & Gas (MGY) is showing one of the cleanest technical breakouts in the energy sector — and the market hasn’t priced it in yet. After months of pressure, price has broken above both the 50-day and 200-day moving averages with rising volume, signaling a clear phase shift from distribution to accumulation. Recent candles confirm control shifting to the buyers, with a tight structure, rising lows, and bullish momentum building underneath resistance.
The fundamentals back the technical setup. In the latest earnings report, MGY delivered a 9.7% revenue increase, $110M in free cash flow, and continues to pay dividends with low leverage. UBS upgraded the stock with a $29 target, which aligns precisely with the post-breakout projection. Operationally, the company is expanding in key U.S. basins like Eagle Ford, while seeing growing demand from Australia and Latin America.
With oil prices pushing higher and geopolitical tensions rising, MGY stands out as a stable energy play in a volatile world. Holding above the $24.00–$24.30 zone keeps the breakout valid, with $29+ as a natural magnet for price. Most investors are still asleep on this name — but the structure is already telling a very different story.

EURJPY Sell - May 13, 2025📍Context:
Reaction from Daily Orderblock
Clear 15m BOS
Two Asia lows & a gap in our direction
Entry at 15m OB with 0.5% risk
If price gives a 1m BOS within the OB, I’ll add another 0.5% to go full risk.
Even though there’s a 5m OB above, I’m comfortable taking the trade if we show signs of rejection.
🎯 TP: Targeting Asia lows and continuation down with clean structure.

May 8, 2025 EURUSD Buy📈 Bias: Countertrend Long | Risk: 1% (2 entries)
🎯 Target: Fill Asia range / 15mOB for LH
🧠 Reasoning:
London session opened inside a 5m OB, followed by a BOS in our direction.
Even though it's a countertrend trade, it aligns with the idea of forming a lower high from a strong reaction zone.
Waiting for 2 entries:
🔹 1 at the 5m OB
🔹 1 at a refined 1m OB

May 6, 2025 - EURUSD Sell📉 Bias: Bearish | Risk: 0.5% (+0.5% potential add-on) | 🎯 Targets: 1:3 (75% off), final TP > 1:8
🧠 Reasoning:
Price reacted from Daily Orderblock, broke structure on 15m ⛓️.
Refined entry from 15m OB → 5m OB for more precision on the tap entry🎯.
2x Asia lows below = high-probability targets 🔻.
Looking to add 0.5% if 1m BOS + retracement OB confirm.
⚠️ Note:
There’s unmitigated Asia High & 15m OB above, but too far to affect today’s bearish idea.

May 6, 2025 GBPUSD Sell📉 Bias: Bearish | Risk: 0.5% | 🎯 Targets: 1:3 (take 75%), final target ~1:7
🧠 Reasoning:
Price reacted from a Daily / Weekly Orderblock with confluence from a 15m OB
Asia Low as target provides clean downside structure
Morning Star formed inside the OB → entry taken at the imbalance left behind
10 pip SL covers highs efficiently ✅

USDJPY 05/06/2025Scenario USDJPY TF H4
- Stick to your stop loss to protect your trades
- Manage your positions patiently until you hit the target
- Profit always in risk, take the risk or lose the chance

XAUUSD. Weekly trading levels 14 - 18.04.2025During the week you can trade from these price levels. Finding the entry point into a transaction and its support is up to you, depending on your trading style and the development of the situation. Zones show preferred price ranges WHERE to look for an entry point into a trade.
If you expect any medium-term price movements, then most likely they will start from one of the zones.
Levels are valid for a week, the date is in the title. Next week I will adjust the levels based on new data and publish a new post.
! Please note that brokers have a difference in quotes, take this into account when trading.
The history of level development can be seen in my previous posts. They cannot be edited or deleted. Everything is fair. :)
----------------------------------------------
I don’t play guess the direction (that’s why there are no directional arrows), but zones (levels) are used for trading. We wait for the zone to approach, watch the reaction, and enter the trade.
Levels are drawn based on volumes and data from the CME. They are used as areas of interest for trading. Traded as classic support/resistance levels. We see the reaction to the rebound, we trade the rebound. We see a breakout and continue to trade on a rollback to the level. The worst option is if we revolve around the zone in a flat.
Do not reverse the market at every level; if there is a trend movement, consider it as an opportunity to continue the movement. Until the price has drawn a reversal pattern.
More information in my RU profile.
Don't forget to like Rocket and Subscribe!!! Feedback is very important to me!

GBPUSD. Weekly trading levels 14 - 18.04.2025During the week you can trade from these price levels. Finding the entry point into a transaction and its support is up to you, depending on your trading style and the development of the situation. Zones show preferred price ranges WHERE to look for an entry point into a trade.
If you expect any medium-term price movements, then most likely they will start from one of the zones.
Levels are valid for a week, the date is in the title. Next week I will adjust the levels based on new data and publish a new post.
! Please note that brokers have a difference in quotes, take this into account when trading.
The history of level development can be seen in my previous posts. They cannot be edited or deleted. Everything is fair. :)
----------------------------------------------
I don’t play guess the direction (that’s why there are no directional arrows), but zones (levels) are used for trading. We wait for the zone to approach, watch the reaction, and enter the trade.
Levels are drawn based on volumes and data from the CME. They are used as areas of interest for trading. Traded as classic support/resistance levels. We see the reaction to the rebound, we trade the rebound. We see a breakout and continue to trade on a rollback to the level. The worst option is if we revolve around the zone in a flat.
Do not reverse the market at every level; if there is a trend movement, consider it as an opportunity to continue the movement. Until the price has drawn a reversal pattern.
More information in my RU profile.
Don't forget to like Rocket and Subscribe!!! Feedback is very important to me!

Gold (XAUUSD) — Technical and Fundamental Analysis 2HTechnical Outlook
On the 4H chart, gold is forming a rising structure and is currently trading near the 3236–3260 resistance zone, aligned with the 1.272 Fibonacci extension. This area is expected to act as a short-term cap, with a potential corrective move ahead.
🔹 Key Levels:
Resistance: 3236, 3260
Support: 3132–3140 (trendline), 3082 (horizontal zone)
🔹 Formations:
Potential retracement setup after an extended impulse
Expected correction toward 3132–3140 (rising trendline)
If support holds, price may resume the uptrend toward 3308 (1.414 Fibonacci extension)
🔹 Indicators:
RSI near overbought zone
MACD shows momentum weakening
EMA 50/200 continue to support the bullish trend
Fundamental Drivers
Inflation concerns and soft landing expectations support safe-haven flows
Market is pricing in potential Fed rate cuts in H2 2025
Central banks continue to accumulate gold reserves
Dollar weakness provides additional support for gold prices
Scenario
Base case:
Rejection at 3236–3260 → pullback to 3132–3140 → continuation toward 3308
Alternative:
Break above 3260 → direct move to 3308.
Break below 3132 → possible slide toward 3082.

Lockheed Martin 1W Possible Scenario 1WTechnical Analysis 1W
The chart shows a second breakout of the weekly trendline, which could increase downside pressure on the price.
Key Levels:
- Support: $393.08 (0.236 Fibonacci), $324.65 (0 Fibonacci)
- Resistance: $439.70 (0.382 Fibonacci), $471.48 (0.5 Fibonacci), $500.00 (0.618 Fibonacci)
Indicators signal weakness, suggesting a potential continuation of the downtrend.
Fundamental Analysis
Lockheed Martin is one of the world's largest defense contractors, specializing in aerospace, defense, and security. The company is known for producing the F-35 fighter jet, missile defense systems, and space exploration technologies.
Key Factors Affecting the Stock:
Financial Performance:
- Strong revenue growth supported by high government defense spending
- Solid backlog of contracts, ensuring future revenue stability
- However, potential budget constraints or shifting defense priorities could impact future earnings
Macroeconomic & Geopolitical Factors:
- Rising global tensions (Ukraine, Middle East, Indo-Pacific) drive higher defense budgets worldwide
- US interest rates and inflation may affect long-term government contracts
- Potential NATO expansion and Indo-Pacific security agreements could bring new contract opportunities
Competition & Industry Risks:
- Competes with Boeing, Northrop Grumman, Raytheon, and General Dynamics
- Cost overruns and supply chain disruptions could pressure profit margins
- The US government's shift to AI-driven warfare and cyber defense might change future contract allocations
Conclusion:
A breakdown below $393.08 could open the way toward $324.65, signaling a deeper correction. To regain an uptrend, the price must reclaim the $439.70 resistance level.

NIFTY INTRADAY LEVELS FOR 27/08/2024BUY ABOVE - 25030
SL - 24970
TARGETS - 25080,25160,25240
SELL BELOW - 24970
SL - 25030
TARGETS - 24900,24850,24780
NO TRADE ZONE - 24970 to 25030
Previous Day High - 25030
Previous Day Low - 24850
Based on price action major support & resistance's are here, the red lines acts as resistances, the green lines acts as supports. If the price breaks the support/resistance, it will move to the next support/resistance line. White lines indicates previous day high & low, high acts as a resistance & low acts as a support for next day.
Trendlines are also significant to price action. If the price is above/below the trendlines, can expect an UP/DOWN with aggressive move.
Please NOTE: this levels are for intraday trading only.
Disclaimer - All information on this page is for educational purposes only,
we are not SEBI Registered, Please consult a SEBI registered financial advisor for your financial matters before investing And taking any decision. We are not responsible for any profit/loss you made.
Request your support and engagement by liking and commenting & follow to provide encouragement
HAPPY TRADING 👍

EURCHF: Swing Trading & Technical Analysis
Balance of buyers and sellers on the EURCHF pair, that is best felt when all the timeframes are analyzed properly is shifting in favor of the buyers, therefore is it only natural that we go long on the pair.
❤️ Please, support our work with like & comment! ❤️

How to Identify Candlestick Strength | Trading Basics
Hey traders,
In this educational article, we will discuss
Please, note that the concepts that will be covered in this article can be applied on any time frame, however, higher is the time frame, more trustworthy are the candles.
Also, remember, that each individual candle is assessed in relation to other candles on the chart.
There are three types of candles depending on its direction:
🟢 Bullish candle
Such a candle has a closing price higher than the opening price.
🔴 Bearish candle
Such a candle has a closing price lower than the opening price.
🟡 Neutral candle
Such a candle has equal or close to equal opening and closing price.
There are three categories of the strength of the candle.
Please, note, the measurement of the strength of the candle is applicable only to bullish/bearish candles.
Neutral candle has no strength by definition. It signifies the absolute equilibrium between buyers and sellers.
1️⃣ Strong candle
Strong bullish candle signifies strong buying volumes and dominance of buyers without sellers resistance.
Above, you can see the example of a strong bullish candle on NZDCHF on a 4H.
Strong bearish candle means significant selling volumes and high bearish pressure without buyers resistance.
On the chart above, you can see a song bearish candle on EURUSD.
Usually, a strong bullish/bearish candle has a relatively big body and tiny wicks.
2️⃣ Medium candle
Medium bullish candle signifies a dominance of buyers with a rising resistance of sellers.
You can see the sequence of medium bullish candles on EURJPY pair on a daily time frame.
Medium bearish candle means a prevailing strength of sellers with a growing pressure of bulls.
Above is the example of a sequence of medium bearish candles on AUDUSD pair.
Usually, a medium bullish/bearish candle has its range (based on a wick) 2 times bigger than the body of the candle.
3️⃣ Weak candle
Weak bullish candle signifies the exhaustion of buyers and a substantial resistance of sellers.
Weak bearish candle signifies the exhaustion of sellers and a considerable bullish pressure.
Usually, such a candle has a relatively small body and a big wick.
Above is the sequence of weak bullish and bearish candles on NZDCHF pair on an hourly time frame.
Knowing how to read the strength of the candlestick, one can quite accurately spot the initiate of new waves, market reversals and consolidations. Watch how the price acts, follow the candlesticks and try to spot the change of momentum by yourself.

COT reports + SMT. How to determine the long-term trend (BIAS).A pattern in the COT reporting curve to determine long-term trend or bias (BIAS). With a scope from several weeks to months. Of course, reports arrive with a delay, but on a long-term scale this is not a big problem.
Many people use divergences, or SMT in the teachings of Smartmoney Michael Huddleston (ICT), when analyzing charts. Why not use COT and divergence reports together as a useful chart analysis tool.
Everyone probably noticed that the positions of Commercial traders in the curve constructed from reports coincides with the price movement (there is some direct correlation, and a large one). After a long observation and playing with the scale, obvious discrepancies in correlations and emerging divergences (SMT) caught my eye. And very often at the peaks of movements, followed by a reversal.
Data reports are of course released once a week. Therefore, tracking such SMTs can be used as an additional factor to determine bias in the analysis of higher time frames. And already having a bias for the next few weeks, or even a couple of months. You can look for signals in trades with confirmation on lower timeframes.
I like these divergences, they are built on an indicator that is completely independent of price. unlike any RSI, Stochastics, etc.
The curve is constructed solely based on trading volumes on the CME exchange, and does not depend in any way on the price, therefore it does not follow the price further to infinity. This is a direct correlation of two different data streams, and their divergence (divergence).
I think I’ll make a separate short article about “data streams”, what I mean by this.
And finally, of course, the tool is not the holy grail. But with a proper and adequate approach in skillful hands, it is a very good tool that can be kept in mind during a complex analysis of charts. At a minimum, if divergence occurs, you can be wary and reconsider your plans.
I hope the information will be useful. Don't forget to like, subscribe, share with friends, leave comments. All you have to do is click a button, and I love seeing feedback. Thank you.
