NZD/USD multi time frame analysis - Possible Down MomentumPurple Line = Daily SNR/Trendline
Red Line = 4 Hour SNR/Trendline
Orange = 1 Hour SNR/Trendline
If this help you with your trading Please Like, Share and Follow that give me motivation to make another Trading Ideas
If you have some suggestion, comment or other opinion feel free to write it in comment
Wish you succesfull and consistent trading with profits!
This is not an investment advice.
"CFDs are complex instruments and come with a high risk of losing money rapidly due to leverage. Between 74-89% of retail investor accounts lose money when trading CFDs. You should consider whether you understand how CFDs work and whether you can afford to take the high risk of losing your money."
Tehnicalanalysis

USD/JPY Multi Time Frame Analysis - Possible UptrendPurple Line = 4 Hour SNR
Red Line = 1 Hour SNR
Yellow = 5 Minute SNR
4 Hour candle close above 4 Hour support level and on 5 Minute chart we can see clear triangle which is break in uptrend and now if we see pullback price should go high at least till new 4 Hour Trendline Resistance
If this help you with your trading Please Like, Share and Follow that give me motivation to make another Trading Ideas
If you have some suggestion, comment or other opinion feel free to write it in comment
Wish you succesfull and consistent trading with profits!
This is not an investment advice.
"CFDs are complex instruments and come with a high risk of losing money rapidly due to leverage. Between 74-89% of retail investor accounts lose money when trading CFDs. You should consider whether you understand how CFDs work and whether you can afford to take the high risk of losing your money."

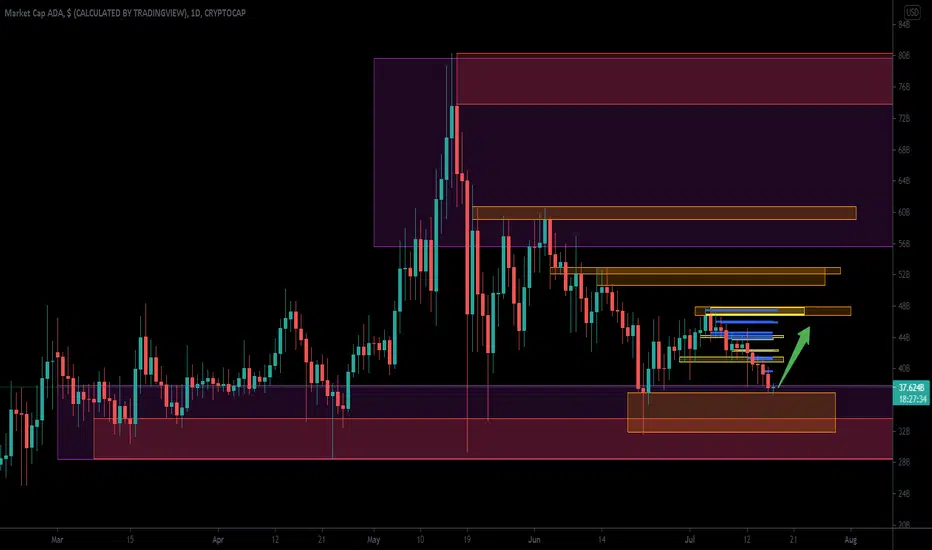
Cardano (ADA) Multi time frame analysis, Crypto Trading Idea #4Purple Zones = Monthly SNR
Red Zones = Weekly SNR
Orange Zones = Daily SNR
Yellow Zones = 4 Hour SNR
Blue Lines = 1 Hour SNR
Cardano (ADA) close above Daily Support and it is on Monthly support zone too and can go up from this level but this depend on fundamental analysis about Cardano too. I also draw SNRs on 4 hour and 1 hour chart that can be easily follow the new uptrend
If this help you with your trading Please Like, Share and Follow that give me motivation to make another Trading Ideas
If you have some suggestion, comment or other opinion feel free to write it in comment
Wish you succesfull and consistent trading with profits!
EUR/USD multi time frame analysis, Trading Idea #3Purple Zones = Daily SNR
Red Zones = 4 H SNR
Orange Zones = 1 H SNR
Yellow Zones = 5 Min SNR
Blue Lines = Opportunity for trade
1.) SHORT TRADE REVERSAL
When Candle close bellow Resistance and next candle form as Bearish ( better if it is some Bearish reversal candlesticks like bearish engulfing candle or bearish evening star etc....) open short trade;
- Stop Loss above resistance zone
- Take profit little bit above next support (or if see that candlestick break next support (new Bearish candlestick open bellow next support zone ) keep open trade to get more profit)
- Check Economic calender to be sure that avoid trade on double (15 Min before and after news) and tripple news (30 Min before and after news), and also speak with double and tripple star (2 H before and after speeach) =Check www.forexfactory.com
2.) SHORT TRADE CONTINUATION
When Bearish Candle close bellow support zone place Short trade (better if is some strong bearish candle) Open short trade
- Stop Loss above resistance zone
- Take profit little bit above next support (or if see that candlestick break next support (new Bearish candlestick open bellow next support zone ) keep open trade to get more profit)
- Check Economic calender to be sure that avoid trade on double (15 Min before and after news) and tripple news (30 Min before and after news), and also speak with double and tripple star (2 H before and after speeach) =Check www.forexfactory.com
3.) LONG TRADE REVERSAL
When Candle close Above Support and next candle form as Bullish ( better if it is some Bullish reversal candlesticks like Bullish engulfing candle or Bullish Morning star etc....) open Long trade;
- Stop Loss Bellow Support zone
- Take profit little bit Bellow next Resistance (or if see that candlestick break next Resistance (new Bullish candlestick open above next Resistance zone ) keep open trade to get more profit)
- Check Economic calender to be sure that avoid trade on double (15 Min before and after news) and tripple news (30 Min before and after news), and also speak with double and tripple star (2 H before and after speeach) =Check www.forexfactory.com
4.) LONG TRADE CONTINUATION
When Bullish Candle close above Resistance zone place Long trade (better if is some strong Bullish candle) Open Long trade
- Stop Loss Bellow Support zone
- Take profit little bit Bellow next Resistance (or if see that candlestick break next Resistance (new Bullish candlestick open Above next Resistance zone ) keep open trade to get more profit)
- Check Economic calender to be sure that avoid trade on double (15 Min before and after news) and tripple news (30 Min before and after news), and also speak with double and tripple star (2 H before and after speeach) =Check www.forexfactory.com
If this help you with your trading Please Like, Share and Follow that give me motivation to make another Trading Ideas
If you have some suggestion, comment or other opinion feel free to write it in comment
Wish you succesfull and consistent trading with profits!

BTCUSDT Long opportunity Price range 28500-30500Long Opportunity in BTCUSDT within price range of 28500-30500

Matic Network is consolidatingFRom Sunday when MATIC reached and breaked the 1.75 resistance, now is consolidating.
I hope after that it will break the 1.92 support and go to the next resistance target 2.5.

Binance Coin, interesting scenarioThe price has been able to create a triangle pattern. If we manage to break the upper boundary of the triangle and come back for a re-test, we will be looking for BUY positions. On the opposite, if the price breaks the lower boundary and retests it, we will be opening short positions and aiming for the target identified on the chart.

Trading Basics Part 1:How Candlesticks Work!
Hello,Traders!
Japanese Candlesticks are thought to have been invented by the Japanese rice traders
And then made their way into the West where they were used for stocks, forex and commodity trading.
Reading candlesticks is quite easy: the body represents an area that indicates the price distance between the open and close of the candle, while wick’s ends indicate the full magnitude of the movement in-between open and close. Thus, when picking the timeframe for your chart, you are deciding on how much time will be contained between open and close of each candle.
If open is below the close, the candle is bullish , and if open is above the close, the candle is bearish , which is usually represented by different colors of the bodies and wicks on the chart, typically, green and red.
Some of you might ask me, why am I explaining things that seems to be obvious and self evident, yet my experience of Coaching, paints a different picture, with thecandlesticks being undervalued and misunderstood by many, despite them being the staple of technical analysis .
In my trading strategy, which is based on multi timeframe top-down technical analysis ,
we examine multiple timeframes, from 1 week to 1 hour, going from higher to the lower timeframes. Looking for strong levels on weekly and daily and for patterns and confirmations on 4 hour and 1 hour charts. Which means that we are opening 1 week/1 day candle like a Russian doll, finding multiple candles inside the other. We enter the trade only if we are getting the same bias on all timeframes that were of our interest!
If you found my post helpful and interesting, please, like comment and subscribe!
Thank you!

Can it reach the price of 0.25?Conditions for growth towards the price of 0.25 are good, if you break the middle line and cross the green line (strong resistance), you can hope to grow and reach the goal of 0.25.
In the MacD indicator, the buy signal is also given and shows an upward trend, but in case of large and negative volume, it is possible to change the shape of the MacD
good luck

DOGECOIN Must break resistance before testing the highs- Speculators have suffered losses from major profit-taking
- If speculators are to push this higher, they must break above resistance
- Hold for breakout
- Buy the retest
- Trade with caution as this market is driven by the major coins and speculators
VERY VOLATILE MARKET

in short term btc will dip again then will skyrocketthe correction will be at 45$k then will finish his bull run in summer.

DOGECOIN/USDT AnalysisRecent events sending Dogecoin to increase by 400%, with a combination of 4/20 and pure demand.
Elon musk is obviously doing his bit to quite literally put DOGECOIN TO THE MOON and is a big contributor towards the rises, and market volatility.
We must also take into consideration the HUGE amount of DOGECOIN that is store by apparently GameStop. Regardless of who it may be with the huge wallet of coins is another potential contributor to the further rise of DOGECOIN.
I bought a small amount at 0.04p, then bought it again at 0.23p. I will continue to hold my positions and see how it all plays out.
Let me know what you think in the comments!
Happy Trading.


Litecoin Bullish Harmonic Crab If we can see some further retracement on Litecoin price action will form a potential harmonic crab that can if entry on his bullish trend . Wait for rejection off the harmonic reversal zone , bullishing engulfing on 5 or 15 min for extra confirmation . Use trailing stops with enough breathing room securing profits along the swing up. This should go the moon

GBP/JPY, GBP/USD, GBP/CHF and GBP/NZD on watch for me today.GBP/JPY:
• If price impulses back down below our rayline, it does so in a convincing manor and a subsequent tight flag forms, then I'll be looking to get short with a reduced risk entry on the break of the flag.
• If this setup doesn't present itself then I will simply wait until another setup which meets my plan materialises.
• If there's any ambiguity then I will not place this trade.
GBP/USD:
• If price pushes up to and ideally just above the upper trend line of our most recent piece of structure and the last part of the move is corrective, then I'll be looking to get short with a risk entry after a phase line break on either the fifteen minute or the one hour chart.
• If price pushes up impulsively to and ideally just above other upper trend line of our most recent piece of structure, then I'll be waiting for a convincing impulse back down followed by a tight flag and then I'll be looking to get short with a reduced risk entry on the break of the flag.
• If price only pushes up to and ideally just above our rayline, then regardless of how it does so I'll be waiting for a convincing push back down followed by a tight flag and then I'll again be looking to get short with a reduced risk entry on the break of the flag.
• If none of these setups present themselves then I will simply wait until another setup which meets my plan materialises.
• If there's any ambiguity then I will not place any of these trades.
GBP/CHF:
• If price impulses down below our rayline, it does so in a convincing manner and a subsequent tight flag forms, then I'll be looking to get short with a reduced risk entry on the break of the flag.
• If this setup doesn't present itself then I will simply wait until another setup which meets my plan materialises.
• If there's any ambiguity then I will not place this trade.
GBP/NZD:
• If price pushes up to and ideally just above our upper rayline, then regardless of how it does so I'll be waiting for a convincing impulse back down followed by a tight flag and then I'll be looking to get short with a reduced risk entry on the break of the flag.
• If this setup doesn't present itself then I will simply wait until another setup which meets my plan materialises.
• If there's any ambiguity then I will not place this trade.

AUDCADPRICE will BUY to resistant zone .96721
then SELL long term to support zone .94978
long term daily tf


Eur/Jpy(Sell,Short)Hello everyone :)
After we saw a big sell-off, the British Pound and Australian Dollar which were big gainer on the market for the whole of February, and Japanese Jen was the worst performed currency,
is there any possibility for making Japanese Jen a very good performed currency?
From a fundamental point of view, Japanese Jen was the worst performed currency because investors gave up investing in save haven currency, and they started to invest in risk assets such as British Pound, etc. British Pound and Australian Dollar were best-performed currency because England made decrease of infected and they are the second country in the world which they vaccinated their population. Also WHO reported a big decrease in infection in the whole world which is also not a good sign to invest in Japanese Jen. Probably you are asking yourself, why I am so sure about investing in Japanese Jen. Well if you are watching an infection rate Germany and Japan are in a big decrease momentum but the big difference is in that Germany will probably extend their "lockdown" and on the second hand, Japan started to vaccinated their population which they had a problem a month ago about a whole plan. In the beginning, they didn't know when the whole process would start, who is first in a population that will be vaccinated, and who will be their main supplier of the vaccine. As I mention in the post AUD/JPY(natural) they made an arrangement with BioNTech about the vaccine. In my opinion that is the main reason why is, EUR/JPY was a big uptrend at the moment because the Japanese government needed to exchange a lot of Japanese Jen to convert to Euro to pay BioNTech for the vaccine. But there is one problem. As well Europa and Japan are second-biggest trading partners of import/export goods and at the moment Euro export price against Japanese Jen is too expensive at the moment and we can see a good sell-off. I am watching this pair a lot and when is some period of price made a "52-week high or low" or etc. we often saw a good buy or sell off(depends on where in the market at the moment).
From a technical point of view, we can see that price at the moment at the big ascending channel and the small descending channel which we can also interpret as a bearish flag, but because of fundamentals and making at the moment LL, LH, and breaking previous low, which we can read that maybe sentiment is changed. I prefer to see this pair in a sell-off mood. We can see above a price a sell zone and a resistance line and my personal enter will be a start making a new LL, LH and there I see my potential entry-level. Both EMA´s are above the price which is a good indicator that the price will dropdown. TP will be at the nearest support line and SL can be over the previous high or above the resistance line and our sell zone.
WHAT DO YOU THINK ABOUT THIS SETUP?
Please let me know in the comment section!
THANKS FOR READING!
If you have some different opinions please let me know and if you like this please hit that like button and give me support, I will appreciate every support.
Remember this analysis is not 100% accurate. No single analysis is. To make a decision follow your own thoughts. The information given is not Financial advice.

TESLA LONG IN 4H CHART- Never been under 200 EMA between oct 2019 and now.
- MACD will cross
- RSI as one bottom done and will do another before reversal
- Touch the trenline and will bounce up
- In support zone
SL: 637.04
BUY: 715
TP 791
TP 2: 888
TP3: 1030

GOLD (XAUUSD) Waiting For Important Decision Next Week!
Gold is still trading within a wide horizontal trading range on a daily.
1765 is its low and 1965 is its high.
Based on a current price action I see two potential scenarios:
1 - The price may respect the drop to support of the range and continue trading within the underlined boundaries consolidating
2 - The price may break the support. Daily candle close below will signify a highly probable bearish continuation.
For now trading gold is not safe. Let it reach key levels before you open a trading position.
What do you think will happen?
