FOREX: NZDCHF - M pattern and our Limit OrderWe are waiting for a confluence of two factors where the S/R zone breaks around the location of the current trend line.
Our limit order is set at 0.62499
This whole idea is supported by the M pattern, where there is a price return to the Neck line.
M pattenr is seen in a higher time frame (W1), which gives us an even greater probability of success.
Happy trading, Alex_UCT
Telegramsignals

DOT: We are just below WEEKLY Pivot Point. Opportunity is here!The DOT / USDT price is just below Pivot Point Weekly, which is a very strong level.
If the Pivot Point breaks, it is possible to open a trade in the Long direction.
If the breakthrough is rejected, we trade the Short position.
Point Of Control levels, which show fair market prices, are also important.
The opening of positions will also depend on trends, so we need to follow the rules of our strategy. We are the traders, not stupid gamblers. Patience is the key!
Happy trading, Alex_UCT

BINANCE COIN: BEARISH NOW! Do not long it!As we can see on the BNB/USDT chart, the Binance coin has entered beasish mode.
A strong trend line has been broken, which has also been retested, so that it is now likely to fall below this TL.
In addition, at this point is Fibonacci level 0.618, which is generally considered the most important.
The price is also reflected from the bottom edge of the EMA 100.
At the moment, we should not trade the Binance coin in the direction of Long.
The entire market is in an area of strong fear, according to the Fear & Greed Index.
Stay with us and you will be informed about further events in the crypto markets.
Don't forget to like and write a comment.
Happy trading, Alex_UCT

EURJPY SELL SIGNALEURJPY
SELL @127.36
SL @129.06 (-175pips)
Tp @ 146.23 (+350 pips)
Risk: Reward = 1:2

Free CRYPTO Signal: SKL/USDT We are buying the dip.We are longing SKL.
Looks bullish and SKL is in my watchlist for a few weeks. Now is good time to buy it.
Levels in the chart.
ENJOY YOUR MONEY, MY SERVICE IS FOR FREE!

Zcash is the anonymous heaven. Enjoy our trading analysis.ZEC/USD is located in triangle right now.
If we manage to break through the resistance wall and confirm it in support, there will be room for bullish movement.
Each Fibonacci level indicates resistance.
In order for the potential bullish movement to continue, the upcoming Fibonacci level will need to be broken through & confirmed in support so that growth can continue to the next resistance, for which the same scenario applies.

Usdjpy uptrend 20 09 2021USDJPY
The price finally decides to break the resistance level of the prolonged consolidation. If the breakout is not false, then there is a potential to renew the upper point - 111.65. But now I am waiting for the rise after the pullback to the resistance below. My target is 110.78
➖➖➖➖➖➖➖➖➖
My past forecasts on USDJPY 👩💻
№1USDJPY +65p✅

Gbpusd uptrendHello
GBPUSD
The instrument is in flat.
The range is narrow and it is quite difficult to trade it; all that remains is to wait for the price to exit accumulation.
I'm waiting for a slight rollback to the border of the descending channel and growth from the level to 1.388
———————

Eurusd downtrend 16 09 2021Hello
EURUSD
The currency pair is gaining energy in order to break through the support level .
After a false breakout, there is practically no reaction, it was returned back to the retest level.
Waiting for the price to fall for the level to the support of 1.17
———————

Eurusd 07 09 2021EURUSD
The global picture for the eurodollar today is as follows - a false breakout of a strong support level was made - the lower border of the price channel and the price was returned back to the level.
Recently, the instrument has tested already in the long movement the resistance of 1.19 and a small bearish correction is being formed.
The instrument is in the moment in the long zone, which means that the movement will continue to the long-range resistance.
I think that after the end of the correction, the price will continue its growth along the global trend.
There are important levels ahead, which are of interest to major players.
———————

Gbpjpy uptrend GBPJPY
New forecast
After the breakout of the level, the price consolidates above the resistance. I look forward to growth after consolidation. My goal is 153.34

Eurusd 03 02 2021EURUSD
The instrument is being actively bought back. Ahead is the resistance level 1.19.
I think that we can expect a slight pullback from the resistance to the lower border of the formed bullish channel .
——————

Usdjpy 02 09 2021USDJPY
The instrument, under pressure from buyers, approaches the resistance level with a consolidating movement, which is the upper tier of the trading range. I am waiting for the breakdown of local resistance and achievement of the target - 110.67
——————

Audcad 01 09 2021AUDCAD
The tool is at the resistance level of the descending channel .
The level is strong and I do not think that the price can break through on a distant retest and change a rather strong downtrend.
I'm waiting for the price to drop to 0.91
———————

Your Ultimate Guide to RSI DivergenceYour Ultimate Guide to RSI Divergence (Settings & Tips)
Hey traders,
Relative strength index is a classic technical indicator.
It is frequently applied to spot a market reversal.
RSI divergence is considered to be a quite reliable signal of a coming trend violation and change.
Though newbie traders think that the application of the divergence is quite complicated, in practice, you can easily identify it with the following tips:
💠First of all, let's start with the settings.
For the input, we will take 7/close.
For the levels, we will take 80/20.
Then about the preconditions:
1️⃣ Firstly, the market must trade in a trend ( bullish or bearish )
with a sequence of lower lows / lower highs ( bearish trend ) or higher highs / higher lows ( bullish trend ).
2️⃣ Secondly, RSI must reach the overbought/oversold condition (80/20 levels) with one of the higher highs/higher lows.
3️⃣ Thirdly, with a consequent market higher high / lower low, RSI must show the lower high / higher low instead.
➡️ Once all these conditions are met, you spotted RSI Divergence.
A strong counter-trend movement will be expected.
Also, I should say something about a time frame selection.
Personally, I prefer to apply it on a daily time frame, however, I know that scalpers apply divergence on intraday time frames as well.
❗️Remember, that it is preferable to trade the divergence in a combination with some price action pattern or some other reversal signal.

Eurusd 01 09 2021EURUSD
The currency pair makes a false breakout and returns to a short zone below the resistance level .
Selling pressure on the market is strong enough, as well as the level that they tried to break.
Waiting for the price to fall after fixing below the level to support 1.174
——————

Eurusd uptrendEURUSD
The price broke through the resistance, an attempt to change the trend to an upward trend.
The price has gone above the strong level and is in the long zone.
I am waiting for a pullback to consolidate and further growth to the resistance of 1.188
———————

US30 30 08 2021US30
The price closes almost at the very top. I am waiting for the breakout of the level and the update of the peaks. My goal is 35650

BANDUSD downward trendBANDUSD on a downward trend today heading towards a previous low support and resistance level

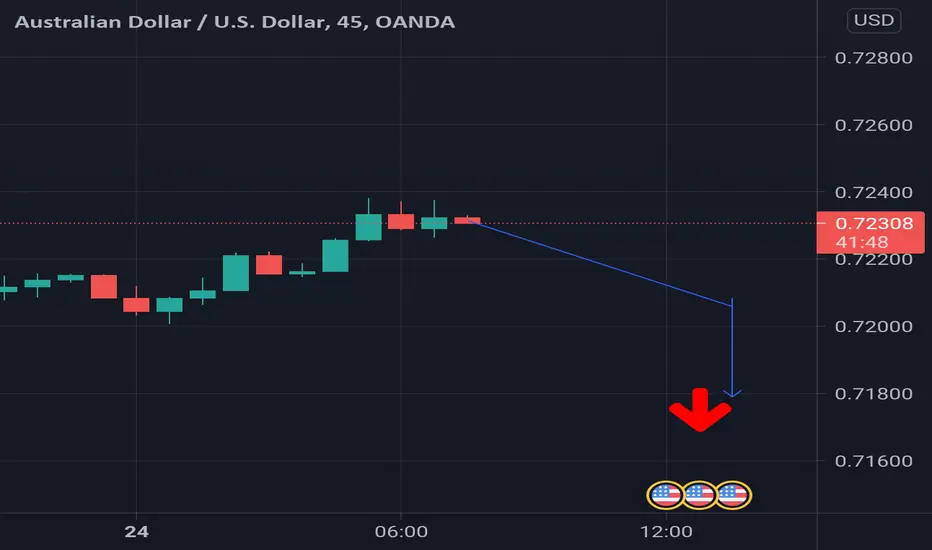
Audusd 24 08 2021AUDUSD
The price approached the upper border of the downtrend. I do not think that the price can break through this level when the movement is exhausted. I look forward to falling from the level. My target is the local low - 0.7
Eurgbp 24 08 2021EURGBP
The currency pair breaks the upper border of the descending channel with an impulse. He speaks of a trend change very early. The price rolls back to the previously broken border for possible consolidation, if the pair consolidates above the level, that is, there is every chance of a trend change. I look forward to growth from the level to the nearest resistance.
——————

Eurusd 24 08 2021EURUSD
The instrument in a downtrend rolled back after a false breakout to the resistance of 1.175.
Under pressure from sellers,
I think that the price will go short from this level.
The closest target that interests is the near support level of 1.17
————

Eurusd 20 08 2021Eurusd The Eurodollar has retraced slightly from the lower border of the channel and is trading between the support and resistance of 1.17.
I expect a deeper rollback, therefore, if the price goes beyond the level and consolidates above 1.17, then we can expect an increase to the resistance of 1.175
———
