$TEM - New ATH's Inbound! 50% UpsideNASDAQ:TEM - New ATH's Inbound! 🚀
Bull Flag Breakout = $84.17 🎯
74.20 Cup&Handle Breakout = $110 🎯
WCB forming 📈
TEM

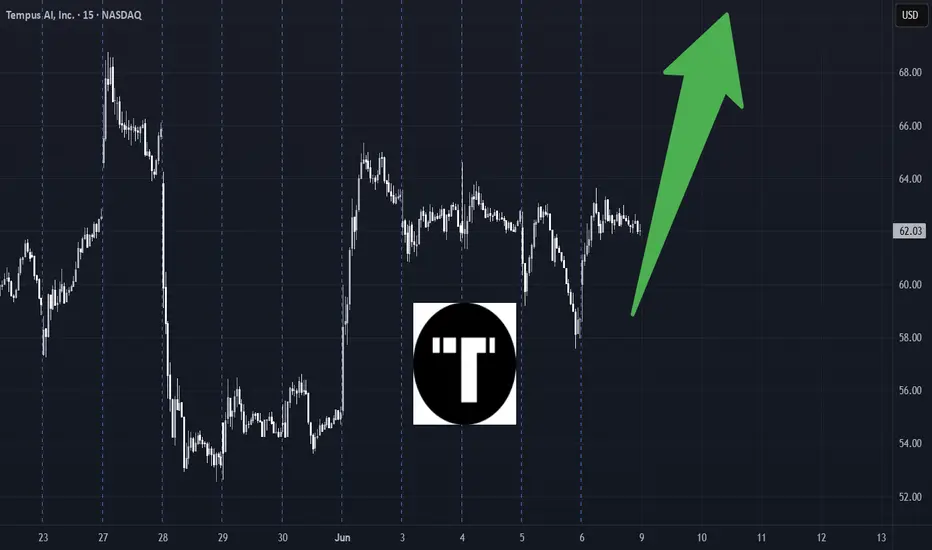
TEM Weekly Options Play – 2025-06-10🧾 TEM Weekly Options Play – 2025-06-10
Bias: Moderately Bullish
Timeframe: 5 trading days
Catalysts: Positive fundamentals, stable macro, bullish option flow
Trade Type: Single-leg CALL option
🧠 Model Summary Table
Model Direction Strike Entry Price Target Stop Loss Confidence
Grok Bullish 63.00C $2.45 $3.68 $1.72 65%
Claude Bullish 65.00C $1.70 $3.00 $0.85 72%
Llama Bullish 63.00C $2.30 $2.76 $2.07 70%
Gemini Bullish 68.00C $1.05 $2.00 $0.50 65%
DeepSeek Bullish 63.00C $2.40 $4.80 $1.20 70%
✅ Consensus: Moderately Bullish
📈 Core Setup: Trend continuation after short-term consolidation
⚠️ Outlier: Gemini sees breakout only above $68, targeting aggressive upside
🔍 Technical & Sentiment Recap
Trend: Daily uptrend intact across all models; short-term consolidation on 5m
Momentum: Mixed MACD and RSI readings—daily bullish, short-term still cooling
Sentiment: Falling VIX + positive earnings/news cycle favor upside
Options Flow: Max pain at $62 provides cushion; calls dominating OI above $63
✅ Final Trade Recommendation
Parameter Value
Instrument TEM
Strategy Weekly naked call
Strike $65.00
Entry Price $1.80 (ask)
Profit Target $3.00 (~67% gain)
Stop-Loss $0.90 (~50% risk)
Size 1 contract
Entry Timing At market open
Confidence 72%
🎯 Rationale: $65 call offers balanced leverage, high open interest (799), and aligns with Claude’s mid-week breakout thesis. Models converge on a bullish lean with manageable risk-reward.
⚠️ Risk Factors
5m chart bearish MACD may delay breakout
Price may hover near max pain ($62) early in week
Unexpected legal or macro news could reverse sentiment
Liquidity risk in thin spreads—use limit orders for entry/exit
📊 TRADE DETAILS SNAPSHOT
🎯 Instrument: TEM
🔀 Direction: CALL (LONG)
🎯 Strike: 65.00
💵 Entry Price: 1.80
🎯 Profit Target: 3.00
🛑 Stop Loss: 0.90
📅 Expiry: 2025-06-13
📏 Size: 1 contract
📈 Confidence: 72%
⏰ Entry Timing: open
🕒 Signal Time: 2025-06-08 16:04:57 EDT
TEM - what do you see ?I love this stock, so much momentum and good follow through.
I see it's ready for a strong rally. I've huge position via shares and Aug calls

$TEM - GET READY! 30%+ UpsideNASDAQ:TEM - GET READY!
✅ Inverse H&S Breakout
✅ Falling Wedge Breakout
🎯 Targets: $77.43 & $90.63 Before August!

TEM W pattern + base breakout setupMany of the beaten down tech stocks and ai stocks have this same look. Big basing patterns with a W bottom where clear ranges are being formed for a break of the lid.
Thinking entry here in the 56 range with a stop under todays low shoud get a good entry for the breakout here. NASDAQ:TEM

TEM Weekly Analysis Summary (2025-04-16)TEM Weekly Analysis Summary (2025-04-16)
Below is a consolidated view of the reports along with areas where they agree and differ, followed by a clear trade idea.
──────────────────────────
SUMMARY OF EACH MODEL’S KEY POINTS
• Grok/xAI Report
– Notes that although the daily trend is bearish, the 5‑minute chart shows bullish signals (RSI rising, MACD crossed up, price above the 10‑EMA) and key short‐term support around $40.
– Recommends buying the $41.50 call (despite its premium being slightly above the “ideal” range) to capture an anticipated move toward the max pain at $44.50.
• Claude/Anthropic Report
– Stresses that on daily timeframes price is in a strong downtrend with clear bearish momentum—but short‐term indicators (like a modestly improving 5‑minute RSI and MACD) suggest that downside may be softening.
– Leverages the heavy put open interest (especially at the $40.00 level) and overall support to recommend a bearish play by buying the $40.00 put.
• Gemini/Google Report
– Emphasizes short‑term technicals: the 5‑minute charts show a bounce potential using RSI, MACD crossover, and positive news (partnership catalyst) combined with falling VIX.
– Recommends a moderately bullish, counter‑trend trade using the $42.50 call (ask ~$0.50) as a short‑term bounce play aiming to reach the $42+ area.
• Llama/Meta Report
– Also lays out a mixed picture. Although the short‑term charts show hints of a rally, it notes the daily chart remains bearish.
– Leans toward a put option side (buying the $40.00 put) given the attractive premium and strong support at $40.
• DeepSeek Report
– Finds that while the very short-term (5‑minute) indicators have begun to turn positive, the overall daily picture remains in distress and the max pain level is much higher.
– Concludes “no trade” is best until direction is clearer, though it does sketch alternate setups for either a call or put trade if forced.
──────────────────────────
2. AREAS OF AGREEMENT & DISAGREEMENT BETWEEN MODELS
Agreements:
• All reports recognize that the current price is near crucial support around the $40 level.
• There is agreement that the 5‑minute charts are more bullish than the daily charts, which remain in a downtrend.
• Technical indicators (RSI, MACD on the intraday chart) hint at an intraday or end‑of‑day bounce even if the longer‑term bias is weak.
Disagreements:
• Grok/xAI and Gemini/Google favor a short-term bullish/counter‑trend bounce via call options.
• Claude/Anthropic and Llama/Meta emphasize the dominant daily bearish structure and would favor a put option to capture further downside.
• DeepSeek remains on the sidelines overall—indicating that the signals are too mixed to pick a clear directional bias without further price confirmation.
──────────────────────────
3. CONCLUSION & RECOMMENDED TRADE
Overall Market Direction Consensus:
While the overarching daily trend remains bearish, a number of models spot actionable short‑term bullish clues (rising 5‑minute RSI/MACD crossover, positive news catalyst, falling VIX) that suggest a possible intraday or early session bounce. With the price near strong support (~$40) and max pain at $44.50 offering a potential upward target by expiration, a short-term counter‑trend call trade is justified for the weekly options.
Recommended Trade:
• Trade: Buy a single‑leg naked call option.
• Option: TEM $42.50 Call (Weekly expiry 2025‑04‑17)
• Premium: Ask is $0.50 – comfortably within our favored range.
• Rationale: The trade banks on a short‑term bounce off key $40 support with the expectation that positive technical momentum and catalyst news may lift the price toward the $42+ area. (While the daily trend is bearish, the intraday indicators and market news support a careful, short‑term bullish view.)
• Entry Timing: At open.
• Profit Target: Approximately $0.80, roughly a +60% move on the premium.
• Stop‑Loss: Set at $0.25 (~50% loss on premium) to limit risk.
• Confidence: About 65% given the conflicting longer‑term vs. short‑term signals.
• Key Risks/Considerations: Should the price fail to hold support near $40 or if intraday momentum reverses suddenly, the call trade will likely suffer. The inherent counter‑trend nature of the play means disciplined stop‑losses and risk management are essential.
──────────────────────────
4. TRADE_DETAILS (JSON Format)
{
"instrument": "TEM",
"direction": "call",
"strike": 42.5,
"expiry": "2025-04-17",
"confidence": 0.65,
"profit_target": 0.80,
"stop_loss": 0.25,
"size": 1,
"entry_price": 0.50,
"entry_timing": "open"
}

$TEM - MASSIVE Opportunity for this Nancy Pelosi Darling!NASDAQ:TEM - Does History Repeat?! 🤯
Same Draw Down could lead to Same Upside!
My target is $100 🎯
Crazy High Risk/ High Reward if we repeat the same timeframe we get in less than a MONTH!!! (Wouldn't count on it, crazy if happens though)
Not Financial Advice

Tempus Ai is not done yet! 70% UpsideNASDAQ:TEM
Called the DIP, Now calling the RIP!
$115 Inbound! 🎯
- Volume Shelf
- Retesting previous highs to flip into support
- WCB Creating support and bottom
- H5 is GREEN with BUY SIGNAL
- Down on market weakness
Not financial advice

Is Nancy Pelosi about to RUG PULL $TEM - Tempus Ai?!NASDAQ:TEM : DIP BUYING OPP INCOMING?
DIP BUY BOX: $70-$80
We are very extended after breaking out of previous resistance and into ATHs!
We are slamming into the Red barrier, which typically brings much-needed pullbacks. This would build out our WCB and allow us to continue higher while staying within those confines.
Also, need to flip previous resistance into support before we can continue higher in a healthy manner.
We could just keep flying higher, but at that point, we would have a massive FLAG POLE, which would come down just as fast as it went up.
Not financial advice

Looking for TEM at $68I'm hoping to get into Tempus. Looking for $68 maybe it'll hit post earnings. Might have missed the bus, but just wanted to share that's my entry if it hits.
Good luck!

TEM has given breakout at 84 USDThe surge follows TEM's recent acquisition of Ambry Genetics, boosting its market position.
My predication :
Buy : 84 USD
Stop loss : 76.25
Target : 205

Tempus AI, Inc. (TEM) - Long Setup | 1H Chart AnalysisThe stock is currently in an uptrend within a rising channel (green lines), making higher highs and higher lows.
Based on Elliott Wave theory, we appear to be in a corrective Wave 4
bouncing from a 1H FVG.
A potential Wave 5 rally could be underway, targeting new highs near the upper channel boundary.
Trade Plan:
Entry: ~$66.84
Stop Loss: $64.00 (Below the demand zone & invalidation level)
Take Profit Target:
TP 4: $78.84 (4:1 RRR)
"Trade what you see, not what you think." – Jesse Livermore
Stick to your plan: Manage risk with stop loss placement and target levels.
Disclaimer:
This is for educational purposes only and not financial advice. Always conduct your own analysis and manage risk accordingly before trading.

$BBAI - No hibernation for this BEAR!NYSE:BBAI
The next parabolic AI name?!
NASDAQ:TEM NASDAQ:SOUN NASDAQ:PLTR 2.0
Breakout = 🎯$5.20🎯$6.75🎯$8.80
Not financial advice

Tempus AI (TEM) Investment Analysis Company Overview: Tempus AI NASDAQ:TEM specializes in AI-driven healthcare solutions, focusing on improving patient outcomes and accelerating medical research. By leveraging extensive datasets and advanced analytics, Tempus provides innovative precision medicine solutions, solidifying its position in the growing AI healthcare sector.
Key Growth Drivers:
Strategic Acquisition of Ambry Genetics:
Tempus AI's acquisition of Ambry Genetics significantly enhances its capabilities in genetic testing. This deal, completed at favorable multiples of 1.9x revenue and 15x EBITDA, demonstrates strategic financial discipline.
The integration of Ambry Genetics is expected to boost Tempus's market presence, expanding its offerings in diagnostics and genetic analysis, and driving revenue growth.
Multi-Year Partnership with BioNTech:
A new multi-year partnership with BioNTech is a major validation of Tempus AI's expertise in precision medicine. This collaboration will focus on leveraging Tempus's vast datasets and computational biology tools to enhance BioNTech's research and development in personalized treatments.
The partnership could lead to significant advancements in oncology and other therapeutic areas, potentially resulting in considerable revenue gains from breakthrough discoveries and innovative treatment options.
Competitive Edge in AI-Enabled Precision Medicine:
Tempus AI's proprietary operating system and robust data library provide a competitive edge in the precision medicine market. The company's AI-driven platform allows for rapid analysis of complex datasets, aiding in the identification of personalized treatment options for patients.
This competitive advantage positions Tempus to capture a larger market share as demand for AI-enabled healthcare solutions continues to grow.
Technical Analysis and Investment Outlook:
Current Price Level: We are bullish on Tempus AI (TEM) above the $43.00-$44.00 range. This level reflects investor optimism, particularly following recent strategic initiatives like the Ambry Genetics acquisition and the BioNTech partnership.
Upside Potential: Our upside target for TEM is $85.00-$90.00, driven by expected revenue growth from new collaborations and enhanced genetic testing capabilities.
Catalysts to Watch: Updates on the integration progress of Ambry Genetics, along with developments from the BioNTech partnership, are key catalysts to monitor. These could significantly impact Tempus's revenue trajectory and investor sentiment.
🔍 Tempus AI—Revolutionizing Healthcare with Precision Medicine! #PrecisionMedicine #HealthcareAI #GeneticTesting #BioNTechPartnership

New swingtrade on TEMI mean... THAT is an indecision candle. How cool would it be if we got another candle, maybe an inside candle on Monday or Tuesday and then we pop strongly next week for a few days?
Nice breakout potential?!
I'll find out!


