TERM

The birth of the chart. The evolution of the tapeLast time we studied how the exchange price is formed, and we found out that it is important to learn how to read charts correctly in order to analyze price changes correctly. Let's see how a chart is made and what it can tell us.
Everyone who went to school probably remembers: to draw a function, we need the X and Y axes. In stock charts, the X-axis is responsible for the time scale, and the Y-axis is responsible for the price scale. As we already know, a chart is built on the basis of data from a tape. At the previous post , we have produced the following tape:
FB $110 20 lots
FB $115 5 lots
FB $100 10 lots
Actually, in addition to ticker, price and volume the tape also fixes time of trade. Let's add this parameter to our tape:
FB $110 20 lots 12/08/22 12-34-59
FB $115 5 lots 12/08/22 12-56-01
FB $100 10 lots 12/08/22 12-59-02
That's it. Now this data is enough to put points on the chart. We draw three points, connect them with straight lines and get a chart.
At one time, this was enough, because trades on the exchange were not frequent. But now some popular stocks, such as Apple or Google, have hundreds of trades per second with different prices.
If the minimum division on the X scale is one second, what price point should we put if there were many trades at different prices in one second? Or let's place all the points at once?
We will discuss that in the next post. And now, as a postscript, I want to show you some pictures describing how the tape was born and evolved.
Here is a picture of a stock player, looking through a tape with quotations, which is given by a special telegraph machine.
Each telegraph machine is connected by wires which, like a spider's web, entangle New York City.
1930's broker's office with several telegraph machines and a quotation board.
An employee of the exchange looking through a tape of quotes. It won't be long before all this is replaced by the first computers.
We'll continue today's theme soon.

SANOFI INDIA Sanofi India has a breakout on DAILY TIMEFRAME.
The target will be found
6700 to 7700
Can be bought for long term
If it closes below 5300
A stop-loss of 5300 can be maintained

Another bounce? Based off the previous resistance the candlestick from last week broke above closing above. This could be a good sign however it may be time to retrace a bit to bounce off that new support. Patiently waiting is all I can say. We are in the long run for this one but definitely see potential in $$$ falling from the sky. I’ll keep you guys updated.

TWT/USDT Bright Star Of Binance EcosystemThe Market is so boring now, but TWT can be a spotlight in the lonely , cold winter night :))
Chart Of TWT is most beautiful of all
U can Buy at 2.5 - 2.6
Stoploss 2.2
Target 3.6 4.6 5.6 9.6...
Long-term signal, be patient!
Risk under control <3

LUNAUSDT - 4H Interval - Targets and StoplossHello everyone, let's look at the 4H LUNAUSDT chart as you can see that the price is moving in the uptrend channel, however it has locally moved sideways from the uptrend line in the channel.
Let's start by setting goals for the near future that we can take into account:
T1 - $1.6663
T2 - $1.6928
T3 - $1.7154
T4 - $1.7373
and
T5 - $1.7694
Now let's move on to the stop loss in case the market goes down further:
SL1 - $1.6464
SL2 - $1.6114
SL3 - $1.5821
SL4 - $1.5533
and
SL5 - $1.5145
Looking at the CHOP indicator, we see that the energy is strongly charged on the 4H interval, the MACD indicator indicates entering a local uptrend, while the RSI shows that despite we are high, we have room for further growth, but it is worth keeping the SL.

Long term playout strategy. 10th Dec 2022
Long term playout:
Price reached the first area to nimble in.
Second average price around 150-160.
Follow by 100 (if possible)
Above method is possible if you believed Tesla is long term playout and this company will still be available 10years down the road.

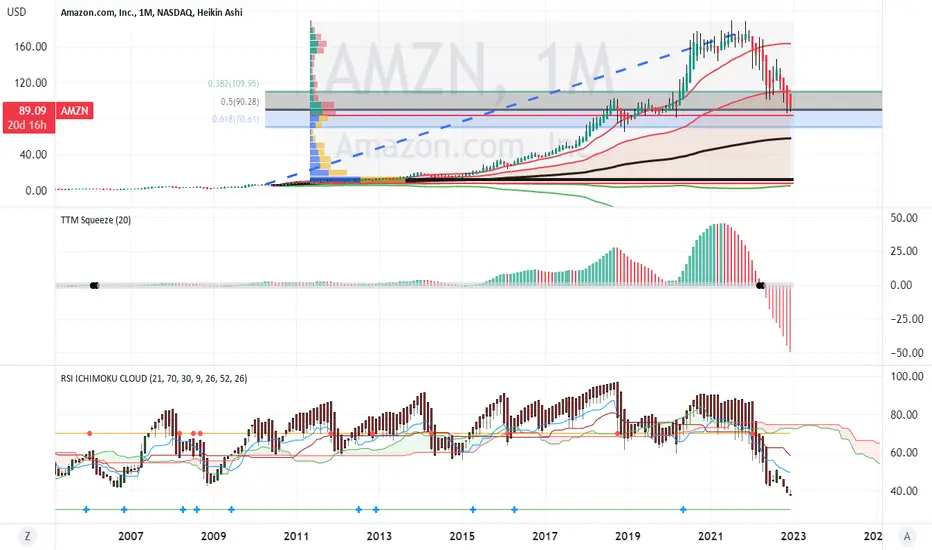
AMZN Can it reverse and go LONGOm a monthly chart from Amazon's beginning to the present.
Amazon was in a sustained uptrend peaking in the summer of 2021.
Since then it has retraced down to the Fib 0.5 level. Price
was more than two standard deviations above the long term
anchored VWAP and is now downtrending into a value area.
The volume profile shows three high volume nodes and price
is currently in the middle node, Finally, the volatility on the
RSI indicator has decreased as had the strength itself.
AMZN is likely setting up for a reversal. Now, is a good time
to buy stock or a long term call option. This is a long idea
for investors not traders.
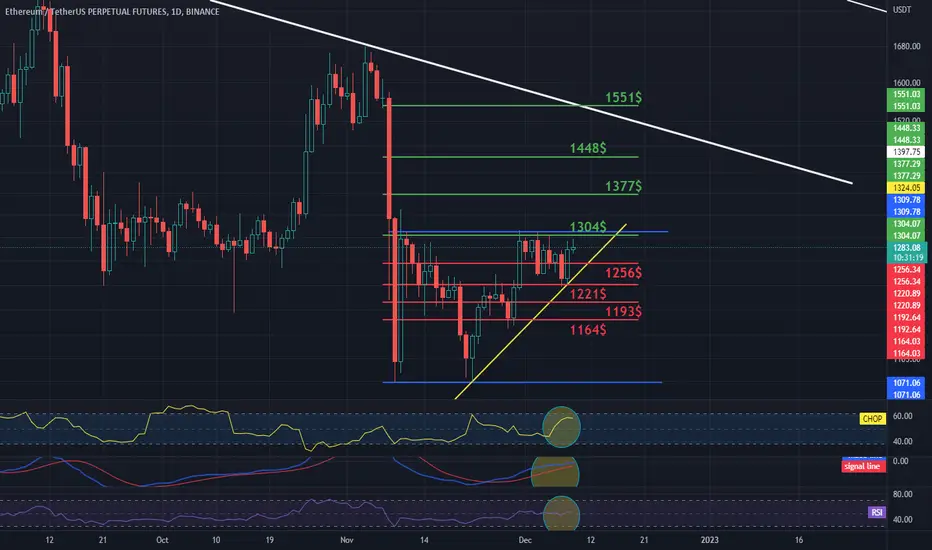
ETH - USDT, 1D Interval Resistance and Support Hello, I invite you to review the chart of ETH in pair to USDT on a one-day timeframe. We will start by marking with a white trend line, which the price must overcome before further increases, but before that, we can mark the sideways trend channel in which we have been moving for a month with the blue lines, and the local uptrend line with the yellow line.
Now let's look at what support we should take in the coming days if the market starts to pull back and so we see that we have the first support at $1256 when it breaks, then we have the second support at $1221, then at $1193 and $1164 .
Looking the other way, we see that ETH is trying to break the resistance at $1304, only when the price goes further up and leaves the sideways channel will go towards the resistance at $1377, then $1448 and $1551 now breaking the fourth resistance means going above first downtrend line.
As we can see, the CHOP index shows that we have a lot of energy on the one-day interval, the MACD indicator confirms that we are in an uptrend, while the RSI shows that we are in the middle of the range, which means that we still have room for further growth.
Market order or the hunger games of stock tradingThe previous parts of the post can be found at the links:
Part 1 - How is the share price formed on the stock exchange? We do it
Part 2 - Bid/Offer: The Yin and Yang of Stock Prices
So, let's continue. So why don't we ever see some orders in the order book?
Because such orders don't have a price, which means they can't be arranged in a book where all orders are sorted by price. This type of order is used by buyers or sellers who don't want to wait for a counter offer with a suitable price.
"But how can you buy or sell something without specifying a price?" - you ask. It turns out it's possible. When you put out an order without specifying a price, the order simply "eats up" the number of lots you need at the prices currently on the books. Such an order is called a " market order ". We can say that the most "hungry" investors who want to satisfy their "hunger" right now use the market order. Remember yourself: when you really want, for example, a cake, you won't stand at the counter and wait for the seller to set the price you want, you'll just buy the cake at the price that's valid at the moment.
So, let's imagine that someone sent the following order to the exchange: " to sell FB stocks in the volume of 20 lots". Such an order will not appear in the book, but it will "eat" all bids within 20 lots, starting with the most expensive ones.
In our example, there were a total of 15 lots left in the book, so the following concluded trades will be printed in the tape:
FB $115 5 lots
FB $100 10 lots
What will happen to the remaining market order of 5 lots (20-15) that couldn't be filled? The exchange will cancel the order for this remainder, as there are no counter offers in the book.
So, let's review what we learned in the current series of posts:
- For each company, the exchange maintains its own order book for buying and selling stocks;
- A buy order is called a "bid";
- A sell order is called an "offer";
- The order must contain the ticker (abbreviated name of the stock), the direction of the transaction (buy or sell), the price per share and the volume in lots;
- The lot size is set by the exchange. It may be equal to 1 share, 100 shares or some other quantity;
- All orders in the book are called "limit orders";
- There is a special type of orders, which are called "market orders". They have the following parameters: ticker, trade direction, volume in lots, and have no "price" parameter.
- The intersection of buy and sell orders by price creates a trade;
- The volume and price of a trade depends on how much volume was "eaten" in the counter offer and at what price;
- The trade is recorded in the tape. Each company has its own tape.
By the way, our book became empty because all limit orders were filled and no new ones came in. As a result, we have a tape of three trades. The trades are recorded in the tape according to when they were made:
FB $110 20 lots
FB $115 5 lots
FB $100 10 lots
So, when you see a flashing stock price somewhere, like in the broker's app, know that it's the last trade in the tape as of the current second. Or if you hear that Tesla stock has reached $2,000 a share, that means that there's a $2,000-a-share deal imprinted in the Tesla tape.
To show how the stock price has changed over time, a chart is made based on the prices of the trades and when they were made. At its core, a chart is a demonstration of how the stock tape has changed over time.
Knowing how to read a price chart is a basic skill that you will use as you invest. I will tell you how to read charts at our next meeting.

MSFT - Cup and Handle Continuation NarrativeMSFT has definitely gone parabolic. But how does price continue from here?
I think a larger pullback is in order. Forming the handle of the cup and handle structure.
The parabolic move can be encompassed as a cup structure
Lets see how it goes. This is the Monthly chart so longing is appropriate. Or wait for the larger pullback.

This setup is a Buy Opportunity for BitcoinHello,
Dear valued traders & investors, this is my own setup and view regarding the next Bitcoin move in the coming months that i will follow.
I am short description analyst & trader, so ill not write much about it because the chart tells itself.
I am preparing to buy SPOT and go Long aswell on Futures as soon as it reach my potential bottom target of this move.
PS: Chart is on weekly timeframe , and you have to understand that this will take months.
Please manage with your trades, invest only if you know what you are doing as i am a Swing & Long Term trader!
If you like the idea, please hit the Like botton.

Bid/Offer: The Yin and Yang of Stock PricesRead the first part of this post at the link: How is the share price formed on the stock exchange? We do it
So at what price and what volume will the deal eventually be made? To understand this, let's go back to the "price" parameter of the order.
When a buyer placed an order "to buy 25 lots at $115 a share", the exchange takes it as "to buy 25 lots at a price not more than $115 a share". That is the purchase price can be less than the price stated in the order, but not more.
And when the seller earlier submitted an order "to sell 20 lots at $110 a share", the exchange takes it as "to sell 20 lots at a price not less than $110 a share". That is, it is possible to sell at a price higher than that specified in the order, but not less.
Once again: buyers always put orders "buy at no more than such-and-such a price", and sellers always put orders "sell at no less than such-and-such a price".
So, we return to the situation with the crossing of prices. When the exchange detects a crossover, it begins to execute the order that has caused this crossover. In our case, it is an order for 25 lots at $115 per share. This order kind of "eats up" all sell orders that are on the way to the price of $115 (that is, everything cheaper than $115), until it reaches 25 lots.
Which orders were "eaten up" in our case? One single order to sell is 20 lots at $110 per share.
What was "eaten" is recorded as a buy and sell trade in what's called a tape. It's similar to the way a cash register punches a check with a price. The record looks like this:
FB $110 20 lots
However, we have a remainder after the trade is 5 lots, the remainder of those 25 at a price of $115. Since at this price (or lower) nothing can be "eaten", the order remains in the left page of the book until a suitable offer.
Let's see how the FB order book looks now, after the deal is done:
Let me note again that all orders in the book are sorted in descending order from top to bottom.
The concept of "book" is very useful for understanding how the exchange price is formed. In the past, when there were no electronic trading systems, there were so-called floor brokers, who used to collect and record prices and volumes of orders in a real book. Nowadays you may encounter alternative terms like Depth of Market (DOM), Level II, but they are all identical to the notion of an " order book ".
The orders to buy that we see in the order book are called " bids ", and the orders to sell are called " offers ". So, in our order book there are two bids and no offers. All bids and offers are called " limit orders " because they have a price limit.
But there's also a type of order that we will never see in the book. Why? I'll tell you in the next post.

RCFRcf under construction
three month consolidation done
volume build gradually.Price action pattern ready for breakout.Our trading system(thetrendraider) given buy setup
all levels share for education purpose only.we are not sebi registered

Game plan for tomorrowWere headed back down , hard. Lets just hop on the short train and ride it to tendieville. Good luck to you! LFG!

BTC has to finish it's correction. Hi everyone,
I'm back with my new idea about the bitcoin. It have to finish its correction to under FIB 0,786 like every other time and altcoins.
You can see the other idea's I had about BTC in related ideas.
I'll be glad to see your idea about it.
Regards.

How is the share price formed on the stock exchange? We do itYou already know that the stock exchange is a one-stop place to buy or sell stocks, whether you are a novice investor or a seasoned professional. But even if you don't trade stocks, you will still "come" to the stock exchange to find out stock prices.
Let's find out how the exchange price of a stock is formed. Regardless of what country the stock exchange is in, the rules for determining the price are similar for everyone. Let us understand how it works, as always, with the help of our imagination.
Imagine a large rack of books. Each book has a name on the cover: Apple, Facebook, Amazon, etc. Let's take one of the books, let's say Facebook, and open it. We will see only two pages, and they are both blank. On the left page we will record buyers' orders to buy shares, and on the right page we will record sellers' orders, respectively, to sell shares. So, every day the exchange, when it opens trading, essentially opens such a "book" and records every bid it receives.
What should be written in the order?
First of all, there must be an abbreviated name of the stock, or, in professional slang, the "ticker," to understand which book to get off the shelf. For example, Facebook shares have a ticker consisting of two letters FB, while Apple shares have four letters - AAPL.
Second, the order must indicate the direction of the transaction, i.e. "buy" or "sell". This is how the exchange understands whether to record the incoming information on the left or on the right page of the book.
Third, the order must indicate the price per share, so that the exchange can sort the orders in descending order of price from top to bottom.
Fourth, the order must specify the volume in lots, that is, how many lots of shares we want to buy or sell. To clarify: Shares on the exchange are not traded by the piece, but by the lot. The lot size is set by the exchange. One lot may be equal to one share, or a hundred, a thousand, or even ten thousand shares (depending on the specific share). This is really handy because the price of one share can be equal to, for example, the price of your computer (then 1 lot may be equal to 1 share), and sometimes 1 share may be worth as much as a box of matches (then 1 lot may be equal to a thousand shares). Why "may be"? The specific rules for determining the lot size depend on the laws of the country and the exchange itself. For example, on the New York Stock Exchange (NYSE), the usual size of 1 lot is equal to 100 shares.
So, let's return to our example. Suppose we want to buy shares of FB at a price of $100 per share in the amount of 10 lots. Then the exchange will record the following on the left side of the FB book:
100$ 10
Then there is a seller who wants to sell FB stock at $110 per share in an amount of 20 lots. Then this is what the exchange will record in the right side of the book:
110$ 20
Then there is a buyer who wants to buy FB stocks at $115 per share in an amount of 25 lots. The entry on the left side of the FB book will look like this:
115$ 25
And now comes the interesting part.
Did you notice that the $115 price in the last buy order is higher than the single sell order of $110? That means the buyer is willing to make a deal at a price even higher than what the seller is offering. So at what price and what volume will the deal end up being made?
Please wait for the next post.


FET FLYFETUSDT LONG
i See my Harmonic pattern as confirmation after the C
Line and waiting for the breakout on my yellow marker 0.0800
to proceed to my tp 0.1048
with a stop loss around 0.7
Disclamer:
I am not a financial advisor. The content that I share on this website are for educational purposes and are our own personal opinions.

Bullish GOLD / 6M FIB AnalysisThe Graph presents DXY/GOLD = Inverse price of gold. Given Fibonacci levels have acted as great resistance/support lines, therefore might predict the next bull-run for gold. DXY/Gold is retesting its 2.414 Fibonacci resistance to break down; which is a bullish signal for gold.
Fundamentally (refer to main graph)
- Gold is a great inflation hedge
- Currently massively undervalued
- Falling returns or/and outlook on substitute investmentment instruments
Technically (these 2 graphs)
- Previous retests from Fib levels have shown a 100% accuracy on the 6M timeframe
(breakouts represented by red circules and current by the blue circule)
- The diagonal blue resistance line (which rejected 100% breakouts) has been reached with a significant rebound below the fib level.
- The MA is extremely close to both the FIB and blue line resistance levels.
Fun fact: These fib levels have been determined through price history between the years 1969-1976.
1M timeframe:
1W timeframe:
Thanks for your time!

CHZUSDT 30M - Targets and StoplossHello everyone, let's take a look at the CHZ 30M to USDT chart as you can see that the price has moved above the local downtrend line.
Let's start by setting goals for the near future that we can take into account:
T1 = $0.1626
T2 = $0.1656
T3 = $0.1687
and
T4 = $0.1706
Now let's move on to the stop loss in case the market goes down further:
SL1 = $0.1609
SL2 = $0.1601
SL3 = $0.1594
and
SL4 = $0.1588
Looking at the CHOP indicator, we see that the energy has been exhausted on the 30M interval and is slowly rebounding, while the MACD indicator indicates that we are close to confirming the trend change to an upward one, however, looking at the volume despite the visible green candles, we see that it is very low compared to the red candle.


Apt usdt short sell idea Greetings from Team : Trading The Tides.
lets discuss a short sell oportunity on (APt usdt )
Target area for initiating short :5.4
DCA Limits : 5.5
TP :5,4.8,4.3
SL : 5.63
Hold Time : short- medium term
Technical Chart Pattern: Almost at distribution zone , divergence on 30 min tf
Posible liquidity area : 5.55-5.6
Exchange:Binance
Rules :
We use big capital with less leverage .
Max leverage : 3x
Better take trades with 1x.
We only post the exact setup we are following for the trades .
But DYOR .
Not a Financial Advice !
From Team :
Trading The Tides
Like , Share ,Follow
Thanks a lot and see you soon on the next trade .
